Tag: #CromfordReport

  • Greater Phoenix Housing Update 9/27/2022

    Today is all about the AZ market. Recently, Clear Title hosted a Market Update with the Cromford Report’s Tina Tamboer. She always shares pertinent and timely information. Below I have combined a lot of her information from her presentation, along with additional information from my research.

    To learn more about a Cromford Report membership, click here.

    To register for our October 12th Cromford Market Update with Tina Tamboer, click here.

    Mortgage Interest Rates:

    Interest rates have been very volatile and while inflation remains persistent despite the Fed’s continued efforts it is unlikely rates will decline any time in the near term. We need rates to be stable and boring and not bounce around like they are. This constant fluctuation is hurting the already tight affordability.

    In March when rates moved above 4.4% there was a measurable weakening in the market. When rates reached 5% in May, we saw a bigger dip. Then in May rates hit 5% and we saw a bigger dip. The rate movement directly influenced the number of listings going under contract. When rates went from 5.1% to 5.89% in June there was a 28% decline in contracts. When rates dropped back to 4.99% there was a 25% increase in contracts. While rates hovered around 5.1% – 5.2% contracts stayed high. Then in the past few weeks, we have seen a substantial decline in contracts. Expect this decline to continue.

    Rates have changed our perspective of what is a good rate. People are back to thinking that 5% is awesome. Low 5% are looking good to consumers now.

    Accepted Contracts:

    These accepted contracts include cash sales, which are up from previous years.

    Emotional Cycle:

    All of the volatility has created “FUD” standing for fear, uncertainty, and despair. Our contracts are at 2014 levels. Back in 2014 contracts were increasing and today they are decreasing which has put despair back into the market. This decline is much larger than seasonal shifts. There was hope and with rates creeping ever higher, the hope has evaporated.

    This happened in 2009 when we had the first-time home buyer credit and we saw a pick up in contracts. But when the credit went away, so did those additional contracts. It gave us hope and then went back to despair.

    Nothing lasts forever, the market changes always, so never expect anything in housing to last forever. That is true of mortgage rates too. They move up and down.

    In every single recession since 1974 rates have declined. There is no declared recession right now. Many believe we are already in one or on the cusp of one. Recessions typically last anywhere from 6 months to 1.5 years. Based on the history it is reasonable to expect that at some point in the next 12 months rates will probably come down.

    Fannie Mae’s latest forecast predicts a mild recession in Q1 2023 but they do not expect rates to decline as the Fed has made a commitment to taming inflation first.

    Affordability:

    In August the median sales price was $440,000. Based on a 10% down payment and basic assumptions, the estimated monthly payment was $2,616. But with September’s estimated median of $450,000 and increased interest rates the estimated payment (with the same assumptions) is around $2,844.

    Buydowns are great but buyers still need to be approved at the higher payments.

    Rents are up 2.2% over the past 12 months. Inflation is 40% housing and rentals carry a lot of weight. In the first 2 weeks of September rental rates declined. Would-be buyers are looking at rentals again. The median monthly rental payment for the median home is about $2,249. That $600 a month difference from a mortgage payment to a rental payment has played a role in the declining purchase demand. $2,249 is an affordable payment for households with an income of $96,000 annually.

    Q2 22 affordability was 22%, which is terrible and with higher interest rates, this could get worse.

    Investors:

    With available rentals listed on ARMLS up 134% since September, a long-term hold strategy may be better on affordability for investors when offering their product (rental/flip) to consumers.

    The 2005 crash looked similar in market movement to today but the fundamentals are very different. In 2005 many flip investors took advantage of very risky loan offerings which ultimately put the consumers on the hook when prices declined. Today, the stock market has taken on most of the risk. Due to the volume of cash purchases, investors may see less-than-expected returns. Today’s consumers are in good shape.

    If the population cannot afford the prices, they will not buy. We are seeing the investors bringing prices down as inventory rises. Rental supply is up 134% in a year. Up 82% since January. Landlords are scaling back. Rents are only going up 2.2%. Expect rental rates to decline further.

    Flip Investors are also struggling and left with more inventory and less demand. We are in a balanced market. iBuyers scaled way back in August. Acquisition to sales is down 60%. Of the flips, only 1/3 are iBuyers.

    In 2012 – 2014 flips declined as the market normalized. iBuyers arrived in 2015 and didn’t really rock the market until 2021 when Opendoor and Zillow overheated the market.

    Contract Ratio:

    The contract ratio is not seasonally adjusted so shifts appear more quickly. It is a great gauge in a quickly changing market. Ratios above 60 illustrate a seller’s market and below 30 a buyer’s market. This shows we are in a balanced market but with low demand and few listings so we are in a low velocity balanced market.

    In June we had measurements as high as 100. There are still some hot spots but they are fewer and further between. Luxury is doing very well.

    The contract ratio has stopped dropping. We have been here for nearly 8 weeks. The ratio rises when listings decrease and under contract increases. When listings under contract rose and so did active listings so they balanced each other out. It doesn’t mean that our inventory will keep rising.

    The slide below really shows seasonality. Buyers should not wait until the spring. Every single year the contract ratio goes up in the spring. Mostly from January to March. Buyers looking for a deal should buy now. It is impossible to time the market. The best time to buy is when you have sad sellers, not when you have hopeful sellers. Don’t wait for the spring. Buy now.

    Who are the most desperate sellers? iBuyers and builders. Go bargain hunting. New homebuilders want to sell before the end of the year.

    For the industry, it looks like 2014’s market. But 2014 was a better market for the industry with more contracts written. Now there are fewer contracts. The only thing that fuels our industry is when people write contracts. It is what keeps us fed, regardless of price point.

    For the consumer, the 2014 market and 2022 markets are the same. They are not impacting the seller, they do not have to come to the table with money to sell. They are making money on their sales. Owners have equity and the means to weather the price reductions and still sell for a profit.

    The majority of buyers who have owned for 18 to 24 months are fine. The flips are struggling more and they are impacting our industry the most.

    Cromford Market Index (CMI): 

    The best tool for predicting future price appreciation trends available is on the main page of the Cromford Report: https://cromfordreport.com/ (without a subscription)

    • 100 is balanced and prices rise at the rate of inflation (currently 8.3% nationally, 13% in Greater Phoenix), below 100 is a buyer’s market, above 100 is a seller’s market, prices drop below 90, and prices rise at 110. 
    • Between 90 – 110 prices roughly follow the rate of inflation.
    • Yesterday we were at 104.7
    • All-time high: 3/14/2021 at 514.9 
    • 2022 High: 2/7/2022 at 474.6
    • 3 months ago, 6/26/2022 it was 193.8
    • CMI is the predictor, it moves first and then appreciation follows. Cannot predict the CMI. It tells us where we are.  

    When CMI goes down that means it is dropping despite seasonality. When things are balanced homes appreciate at the rate of inflation which is now 8.3%.

    It is a true supply and demand index and it shows that we are in balance. We have been here for nearly 2 months. This is why we keep talking about 2014, which was our last balanced market. Some say feels like a market crash. In 2007 we had a crash when there were 57,000 active listings and only 4,000 under contract. Today we are closer to 19,000 active listings and 7,800 under contract.

    The demand index hasn’t been this low since 2008 which is where the stress of the market is coming from. This has everything to do with the industry fears. Expect the blue and green lines in the chart below to come together.

    Demand increased when rates dropped to 5%. Expect demand to decline since rates are up again. The market is gliding downwards not falling off a cliff. Expect the glide to continue as things settle down. These numbers do not support prices getting back to 2020 numbers. The math does not support a crash but a correction. We are not crashing, we are on our way toward a regular buyer’s market.

    There is a lot of evidence that the demand will come back. And it will likely come back strong when rates drop down to around 5%/5.5%. Sidelined demand emerged when rates touched 5%. This indicates that demand will likely come back quickly when rates are at an acceptable level. That acceptable level continues to change and move upwards.

    We do not know when the market will turn but we know that it will turn.

    Overall, we are in a balanced market. But it is not the same in all places. Paradise Valley has the strongest seller’s market. The strongest buyer’s markets have more to do with builders because they are adding more inventory. Strong builder activity means you will have a stronger buyer’s market.

    Supply:

    Supply is up 159% year over year. We normally see an uptick in supply this time of year. Interest rates are dampening demand which is allowing for increased supply, despite few new listings hitting the market. Expect listings under contract to bounce around as it follows the normal seasonal curve. Contracts are down 30% year over year.

    The growth rate is impacted by supply and demand. Lots of new listings with lots of demand decreases inventory, like last year. Lots of new listings with not a lot of demand increases inventory, like in June and July. Now with less of everything the market is balancing out. This is why we are in a low-velocity balanced market. We were following the 2005 trajectory earlier in the summer and then stopped and dipped in August.

    Many sellers are realizing that this isn’t the best time to sell. In 2007 we were adding 3500 to 4000 listings a week to the MLS. Now it is less than 200 a week. It is not the best time to sell if you don’t have to. The best way to stabilize the market is for sellers to hang on to their houses. Only serious sellers want to be in this market.

    Both canceled and expired listings are normalizing to about where we were in 2014.

    New home builders are scaling back on permits, from March to July permits declined by 49%. Preliminary data shows permits were lower than sales in August.

    Seller Concessions:

    Seller concessions are rising. In August 32% of new homes closed with seller concessions. During the same time period, resale homes closed with 11% seller concessions. Resales are competing with new homes. Builders are throwing a lot at buyers.

    Expect seller concessions, both in new homes and resales, to continue to increase. It is typical to see about 25% of sales have concessions. The vast majority of seller concessions are in the $300,000-500,000 price range.

    Days on Market:

    In 2014 the average number of days on market before contract was 38-44 days. Today it is about 29. A buyer wants a tired, desperate seller, this fall is the great time to buy, we are seeing the most days on market in years. The best time to buy is October through December. We are adjusting back to a balanced market. Expect days on market to increase throughout the remainder of the year. This is the slower season and interest rates are slowing things down further and faster.

    Price Reductions:

    Price reductions are up 746% in the past 5 months. Historically speaking, we are seeing far more price reductions than usual. We have to get down to where the buyers are. The median amount of weekly price reductions is 1800-1900. Today it is about 3800 reductions a week.

    Sale Price/List Price Ratio:

    Lowest since 2019, which was a seller’s market. Things are getting more normal. 97% of the last list price is normal. Buyers are trained to offer list price. Now they are learning that they can go down. This is why we maintained 100% until about 1.5 months ago.

    Price Appreciation:

    Remember, the sales price of a property was agreed upon 30-60 days prior to closing. These sales prices reflect a past market. While they are a guide, they are a lagging indicator.

    The median sales price through the middle of September is $450,000. That is up 9.5% year over year. That is also down 6.25% since May’s median reached $480,000. In May, the year over year appreciation rate was 22.3%. The rate of appreciation is slowing dramatically. With inflation at 8.3% any appreciation rate below 8.3% but is still positive is actually a loss. In a flat market, homes appreciate at the rate of inflation.

    If we have a drop of 10-15% decline in prices that is a correction, not a crash.

    Employment Report:

    We do have some good news. Employment remains very strong. When employment is strong, there is demand for housing. Unemployment may be increasing but we are starting at a very low level of 3.3% in AZ in August. The labor force grew by 5.7% or nearly 192,000 which is good and more people are working. Hourly earnings are up 6.7% in AZ, ahead of the national increase of 5.3%.

    In 2009 we had an employment crash. The majority of our local jobs were in hospitality or real estate, both of which were devasted by the Great Recession. Today our employment is very diverse, we have more of everything. Great diversity not only saved us during the pandemic because it was spread out, but it also actually grew. Despite the continued headwinds, the economy and employment are strong. And more jobs are on the way.

    Final Thoughts:

    Sales are down a lot. Expect low sales counts as long as we have low demand and low inventory.

    This is a good time to buy for those not-so-perfect buyers. Don’t wait for better conditions, then there will be more competition, likely in Q1 2023.

    The Greater Phoenix economy is doing great.

    Expect to see more concessions and it will likely reach 25%. Prep sellers that it will take about 2 months to sell their houses. Sales over list will continue to decline. Sales per month are declining quickly. Prices will likely decline slowly. We do not have an oversupply of homes right now. The best (not needing a lot of work) homes are still selling quickly.

    This too shall pass. It is always darkest before dawn.

  • Greater Phoenix Real Estate Market Update 5/20/2022

    Today is all about the AZ market. Recently, Clear Title hosted a Market Update with the Cromford Report’s Tina Tamboer. She always shares pertinent and timely information. Below I have combined a lot of her information from her presentation, along with additional information from my research.

    To learn more about a Cromford Report membership, click here.

    In light of all of chaos and headlines, it is imperative to focus on what is going on right now. As difficult as it might be to avoid predictions, that is what is necessary. The market is shifting quickly and it is dangerous to make assumptions. The best way to service today’s home buyers and sellers is to guide them through our current market.

    Focus on the NOW.

    What affects demand?

    • Population growth
      • Every person, whether a renter or owner, is an element of demand.
    • Relocation (inbound)
      • Households relocating from outside Greater Phoenix brings one excess element of demand without adding to supply.
    • Household formation
      • Population doesn’t need to grow for demand to grow if new households are forming. You can increase demand without population growth. Household formation is mostly related to affordability.
      • When 1 household splits into 2 (growing), one excess element of demand is created.
      • When 2 households merge into 1 (shrinking), one element of demand is removed.
    • Affordability (based on the worst census data ever)
      • Employment/income
      • Appreciation/depreciation
        • Appreciating home prices decrease affordability and decrease demand.
        • Depreciating home prices increase affordability and increase demand (eventually but not immediately)
      • Interest rates (can offset effects of Appreciation/Depreciation)
        • Because rates are going up demand may decrease, but prices will not decline. There is still more demand than supply, prices are still increasing.
      • Loose/tight lending practices (can offset effects of interest rates)
        • Loose lending practices increase demand.
        • Tight lending practices decrease demand.
    • Consumer Sentiment
      • Emotions, such as euphoria or utter despair, based on speculative opinions or unreliable forecasts can cause some home buyers to make decisions that are not in line with market indicators.

    Affordability:

    Affordability is today’s biggest challenge for buyers. Interest rates are moving quickly and will hopefully settle down soon. When affordability is challenged, household formation shrinks, even if a population is growing.


    When the external influence impacting interest rates retreats; demand will be released and will increase. During the height of the pandemic interest rates were artificially held down. Once they were released, rates jumped quickly.

    Pricing:

    The median resale home is about 1900 square feet. Through May 7 the median sales price was $470,000, up 25.3% year over year. The rate of appreciation is declining daily. Appreciation rates remain incredibly high but the speed in which homes appreciated over the past couple of years has pushed enough people out of the market that demand is no longer supporting the 28% year over year growth rates.

    Interest Rates:

    Over the past 10 years, each time interest rates increased by 1% it took about a year to go back down. We use this as a baseline only because in the 1980s rates increased by 5% and dropped in only 1.5 years. Rates will go down because they always fluctuate. They will come down again in the future, we just do not know when. For the most recent Freddie Mac data, click here.

    Monthly Payments:

    Home values are up 25% while rents are only up 13%. When rental rates decline while sales prices increase a big RED FLAG is raised.

    A few weeks ago, median monthly rents were about $400 less than the median monthly mortgage payment. Now that spread is $555.

    The monthly median payment for the median home is up 56% year over year to $2800. In order to afford $2800 a month; household income needs to be at $120,000 annually. The monthly median rent payment is $2250, which means household income only needs to be $96,000 annually.

    Median Income:

    The extent of the affordability challenge is seen in the actual household incomes. The darkest blue areas in the slide below represents households with an income of about $119,000+. The people with the highest incomes are in the least densely populated areas. Only about 32% of households make enough to buy a regular sized home. This is making people ask, is it really a good time to buy?

    Long Term Appreciation: 

    With rent vs buy spreads that large, it is making people ask, is it really a good time to buy? A way to illustrate the power of homeownership is to show the long term benefits. Homeowners who purchased 20 years ago have averaged an 8.6% appreciation rate per year (yes, including those years).

    Looking at the slide below, homeownership is a hedge against inflation, which in Greater Phoenix in April was 11% year over year, and can be a bit of a forced savings account in equity. The potential equity gain in 5 years at 6% increases $159,000 in equity.

    We have gone through over 2 years of 25% value increases. Markets can weaken without prices going down. Prices are not declining right now.

    The Market Cycle:

    Our market has moved from euphoria to unease. Do not make decisions based on emotion. There have been continuous market bubble headlines since 2013. And Tina said, “2013 was 9 years ago y’all!” The last time we had a balanced market was 2014 and there were bubble headlines then! Look at the facts, use reason, leave out emotion.

    What if prices go down? Don’t sell. People should want to hold onto their homes for 2-3 years.

    Bubble vs. Correction:

    They are now calling it a correction, not a bubble. Now they are trying to slow the acceleration of price. That is not a correction it is pulling the emergency break. But it is hardly slowing it down, prices are still increasing. The past 9 years have not been a bubble.

    2005-2008 Bubble Vs. 2022

    The biggest risk to all housing markets is vacancy.

    2005: HIGH VACANCY & HIGH FORECLOSURE RISK:

    • False demand leads to vacant properties and vacant properties lose value.
    • Bad financing: 100% (or more) loans, interest only loans, no equity
    • Lots of speculation: no intention of occupying the property
    • Over built for 10 years, no labor or supply shortages

    2022: HIGH EQUITY, LOW FORECLOSURE RISK, LOW VACANCY RISK

    • Good loans with significant down payments
    • Cash does not foreclose
    • Stable buyers
    • Intent to occupy
    • New home development struggles to keep up with demand
    • Wall Street’s returns may be lower than expected, rentals/short term: moderate risk of vacancy due to potential pull back on rentals
    • Lack of water creates a high risk of vacancy

    There is a common denominator between the markets = Wall Street. People always take more risk when spending other people’s money. A flood of capital in any sector often creates chaos. In 2005 investors put all of their money in lending and mortgage-backed securities (MBS).

    Today only 23% of Americans are considered subprime, with scores under 660. That is a very small group. In the past it was much higher.

    This time around Wall Street has taken on nearly all of the risk. They are not leveraged but will likely have more risk of a lower or negative return. The risk is with short term rentals and second homes. If the investors cannot rent the property, they will sell. If short term rental owners can’t rent to vacationers, they will go to long term rentals.

    With a potential recession on the horizon (not now, the economy is very strong right now), tourism often pulls back first when money tightens. Vacancy is what creates a decline in value. What could happen in the future, vacancy to short term rentals, then regular rentals

    Other big risks are places with water sources that are lacking. People will not be as interested in buying or renting if there is a water shortage. Expansion will be restricted in areas with stressed water resources. It will likely push more density in areas with a solid water supply. Water supply could impact future housing demand in shortage areas.

    Rentals:

    Rentals are a precursor to sales, way in advanced of resale market. Lots of info on Crane Watch from Phoenix Business Journal.

    Build to rent is going in every direction. It is in all areas around Greater Phoenix. RL Brown offers detailed information on build to rent to learn more click here.

    MLS is the last resort for rentals. It also means that the property is currently vacant. When the counts increase, it means more houses are vacant. Even though it is not the entire rental market it is an accurate representation of the rental market.

    Available rental inventory is up across the board and getting closer to normal supply. Since September we have increased by:

    • Greater Phoenix is up 70%
    • Phoenix is up 48%
    • Northeast Valley is up 59%
    • Southeast Valley is up 71%
    • Pinal County is up 197% (huge rental supply)
    • West Valley is up 82%

    Could have some seasonality coming into play. Market is no worse than it was in 2018 which was a good market. Last August we saw the early shift in rentals. Now are seeing it in sales.

    Of the 1,748 properties successfully leased in April:

    • 38% closed under the listed rent
    • 0.9% difference between the median asking rent and median closed rent, a difference of $20.

    Just 2 months prior, in February, there was a 4.5% difference equating to a difference of $99.

    The areas with the largest rental gaps between asking and closed amounts are the areas with the largest new build growth.

    Supply:

    April new listings:

    • Coming Soon status = 296 Maricopa and Pinal County
    • 10,379 Total Listed
    • Total New Listings -4.2% from last year

    Our new listing counts were low but are increasing. We are now at a normal level of new listings coming to market. However accepted contracts are 5.8% below last year’s.

    Listings under contract, we are below normal range, if we are moving into seasonality, that means that this number will continue to decrease. We will not see what we saw last year.

    A few things need happen before prices drop and remember markets move slowly and a softening market does not mean prices are declining. Rental market moves way faster than the housing market does. Rental rates haven’t dropped yet. First thing needs to happen is that supply needs to rise.

    Active supply is up 41% above this time last year. Six weeks ago supply started increasing and has gained speed. But it is not equal in all price points:

    • Overall inventory is up 117% year over year.
    • In 3 weeks, inventory for homes priced $400,000 – $500,000 increased by 35%
    • In 6 weeks, inventory for homes priced $500,000 – $1M increased by 99%
    • In 6 weeks, inventory for homes priced $1M – $1.5M increased by 38%

    Investors will not likely have a large sell off. Private investors will care more than the big institutions. Depends on goals, if they want to buy and hold 20 years, won’t care that rental rates are changing. Many are not looking to sell unless rents decline by 50%. If they do a sell off, it would be bulk sales to other investors.

    We are still in a frenzy market. All supply is still very low (seasonally). When there are more listings under contract than active for sale, it is a frenzy. Prices do not decline here. They only increase less quickly as inventory increases.

    Price Reductions:

    List prices will have to come down first. Sellers want the moon right now. Price reductions are increasing to nearly 2019 levels.

    • Homes priced $400,000 – $500,000 had a 71% increase in price reductions in 3 weeks. The median reduction amount is $13,000.
    • Homes priced $500,000 – $800,000 had a 157% increase in price reductions in 6 weeks. The median reduction amount is $16,000 for $500K – $600K and $20,000 for $600K – $800K
    • Homes priced $800,000 – $1.5M had a 125% increase in price reductions in 6 weeks. The median reduction amount is $25,000 for $800K – $1M and $50,000 for $1M – $1.5M

    Cromford Market Index (CMI): 

    The best tool for predicting future price appreciation trends and is available on the main page of the Cromford Report: https://cromfordreport.com/ (without a subscription) 

    • 100 is balanced and prices rise at the rate of inflation (currently 8.5%), below 100 is a buyer’s market, above 100 is a seller’s market, prices drop below 90, prices rise at 110. 
    • Between 90 – 110 prices roughly follow the rate of inflation. (through April it is 8.3% nationally, 11% locally)
    • Yesterday we were at 323.1
    • All time high: 3/14/2021 at 514.9 
    • 2022 High: 2/7/2022 at 474.6
    • CMI is the predictor, it moves first and then appreciation follows. Cannot predict the CMI. It tells us where we are. 

    Prices are still rising right now. CMI will change. It will take 3-6 months before prices weaken. Do not look at price, have to look at the market today to know what is going to happen. Demand and supply are going in different directions. The CMI has been declining for 6 weeks, market remains in a strong sellers market that is quickly weakening. Closing numbers are not reflecting the CMI, we will see if in 4 weeks. Everything will be different in a month. Things started shifting in mid-February.

    It is still a strong seller’s market but weakening quickly. In a weak seller’s market seller concessions increase and days on market increase. The CMI is boring when it is normal. We are not in a normal market. We do not know what the indicator will do. It is changing very quickly right now.

    This could be the top of the market; we are seeing the writing on the wall. Waiting longer means you could be less likely to get over asking and fewer people may waive appraisals.

    Things are changing quickly but there is a big difference between a bubble and a correction. During the market crash there were 59000 active listings with 4000 in escrow.

    Demand is still over supply, so prices are still going up. In 2014 when it was balanced, prices were flat

    The buyer and seller care about price, we will sell a home at any price. For our industry we need to have a lot of buyers and sellers, volume of transactions is important for people in the industry. When demand is below normal, we see stress on our industry.

    Phoenix has below normal demand, but supply is so low prices are still increasing, but there are fewer sales with declining demand.

    Urgency is on the side of the sellers. Sellers should feel a frenzy right now in getting their houses on the market. What we experienced is not normal. This will not last forever.

    Flips:

    We do not have desperate sellers. But the most excited sellers are flip investors. 2015 was the first seller’s market. Opendoor has never seen anything but a seller’s market. Not even a balanced market.

    Flip investors are looking to unload their properties right now.

    Opendoor Activity:

    • Opendoor made its first profit in Q1 2022.
    • May through November 2021 Opendoor acquired 3609 properties and sold 1861. They acquired 94% more homes than they sold.
    • December 2021 through March 2022 Opendoor acquired 1408 properties and sold 2149. They sold 53% more than they acquired.

    Offerpad Activity:

    • June through December 2021 Offerpad acquired 1050 properties and sold 742. They acquired 29% more than they sold.
    • January through March 2022 Offerpad acquired 201 properties and sold 546. They sold 172% more than they acquired.

    The iBuyers struggled to turn a profit during the largest resale year in history. The rest of the flip investors did very well. Regular, private flip investors hold properties for shorter timeframes.

    Sales Prices:

    Sales measures don’t tell us where we ARE, they tell us where we’ve ALREADY BEEN.  They reflect contracts written at least 4-6 weeks ago. Sale prices are a trailing result, not a forecasting indicator.

    The median sales price is $470,000. It tells us where we were. Today’s 25% annual appreciation will slow down but not quite yet. Today’s prices reflect contracts signed in February and March. Do not expect these types of gains in the coming months.

    57% of April’s closing closed above asking at a $20,000 median over asking, expect that to decrease soon.

    Days on market is flat, the softening is just beginning. The price reductions are happening now and the reductions are allowing properties to sell quickly. Movement is still fast. Price reductions keeping DOM low. When inventory increases eventually DOM will go up too. Then seller concessions will increase.

    Before prices decline we will see:

    1. Price reductions (increasing)
    2. Increased DOM (currently flat)
    3. Increased seller concessions (not yet)

    Appreciation is still very high. It is where we are now. The areas with the greatest increases in supply are still seeing small increases in prices.

    Pre-Foreclosures:

    Yes, they are up 306%. But that is not a foreclosure, it is a notice of trustee sale. There were only 337 properties in April and we are just coming out of a foreclosure moratorium. There were 32 foreclosures in April. They all sold to a 3rd party. No bank-owned homes coming to market. There are no indications of foreclosure increases. We do not have desperate sellers, only motivated sellers.

    Final Thoughts:

    April outperformed March on about everything except appreciation. Expect this to change next month.

  • Greater Phoenix Real Estate Update 2/18/2022

    Today is all about the AZ market. On Wednesday, Clear Title hosted a presentation with Tina Tamboer, with the Cromford Report. She always shares pertinent and timely information. Below I have combined a lot of her information from her presentation, along with additional information from my research.

    To learn more about a Cromford Report membership, click here.

    The AZ Market:

    In order to be successful in real estate you need to know what is actually going on, clear information is the best. Ignore the noise and fear mongering headlines, it is just click bait. The sky is not falling but the market is indeed changing, it is always changing. This is what I wrote about in my update from last week, which can be found here.

    Wages and Demographics:

    The Census Bureau openly admits that the 2020 US Census data is incomplete and of low quality. The Census released experimental estimates for the 1-year data. Between the low quality, lack of data, and experimental estimates; establishing benchmarks, like affordability levels, is difficult. Garbage in, garbage out.

    The US Census stated, “Unfortunately, even with modifications focusing on known sources of bias, the Census Bureau determined that the estimates did not meet our statistical quality standards. These inconsistencies led to the Census Bureau’s decision not to release the standard set of 1-year data products.”

    Without the 1-year data, we cannot estimate population growth or accurate wage information. And without that data, we cannot accurately estimate affordability.

    HUD publishes wage data once a year, from the Census data. The next update will be released in March. To measure affordability in Greater Phoenix we are still using $79,000 as the median household annual income. This number was established by using the 2018 wage data and applying inflation over time (yikes!).

    Based on that amount, affordability is suffering significantly. The ideal affordability range is 60-75, meaning that of the families earning the median income were able to afford 60-75% of the homes sold that quarter.

    Tina doesn’t believe it is this bad, it is unlikely that our affordability level is only at 44.5 like it is on the report. With demand still 18% above normal, Phoenix’s affordability rate is probably closer to the national number at 54.2.

    Rather than using the affordability index as a predictor; we have to closely watch all demand indicators. As soon as the population cannot afford an item, demand drops.

    Buyer Mix:

    All residential property owners are categorized in one of three buckets. 1. Owner occupied, 2. Second home, and 3. Landlord.

    From 2015 to 2019 owner occupied buyers purchased 70-76% of the properties. In 2020 it was 80-83%. In Q2 2021 a new trend emerged, owner occupied purchases began declining and by the end of the December that rate dropped to 64%.

    What changed? It wasn’t the iBuyers, they pulled back on purchases in Q4 2021. It was the massive increase in landlord purchases that pushed that percentage down. We have to watch this number very closely. If owner occupied purchases go down further, then we clearly have a big affordability problem. This matters to everyone. Can the landlord find a renter? Can the ibuyer find a buyer? Ignoring this info today will cost the investors.

    While the intensity of the market feels like the intensity of the bubble. The fundamentals are very different. A market correction will not hurt the consumers like it did in 2008-2011; it will hurt the investors who are asking too much in rent or sales price. Miscalculations destroyed Zillow Offers.

    Mortgage Payments:

    The February 2022 median sales price for a 1,500 to 2,000 square foot home is $435,000. That is a 27.9% year over year increase. Combine the increasing interest rates with the appreciation, payments are now 38% higher than February 2021. With an estimated monthly payment of $2,232 a family needs an income of $95,700 a year to make it affordable. That is up from $91,000 last month, last month’s update notes are here.

    That monthly payment is based on an interest rate of 3.69% which was the rate last week. Yesterday’s, Freddie Mac survey showed a 30 year fixed rate mortgage is now 3.92%. Rates dropped from 2018 through January of 2021 when rates bottomed at 2.65%. In December 2021 rates were 3.12%

    In 2018 they increased by 1%. Mortgage payments jumped, demand declined, inventory grew, and in 2019 rates dropped and houses became more affordable. Based on the market movement in 2018 when rates increased, we have a general idea of what to expect today. 38% year over year monthly payment increases is unsustainable.

    A fixed rate mortgage is one of the best hedges against inflation.

    Rentals:

    Single family rental rates have been flat for the past 5 months. It is very typical to see rents hold steady in the fourth quarter of the year. Any prospective landlords must make sure there is room for rents to grow when investing. The median monthly rent is up to $2,195; up 17.1% year over year and up 34.3% since Q1 2020. Some luxury rentals have declined, February is not outperforming January.

    For apartment, rents are an entirely different beast and they have been increasing significantly as well. For details on apartment rents, evictions, and distressed properties, check out these new charts from the Maricopa County Association of Goverments.

    Now that the median mortgage payment is higher than the median rent, some potential buyers may be on the fence. The advantage of homeownership remains. Real estate ownership is still the greatest wealth creator.

    Where can landlords get the biggest bang for their buck?

    • West side
    • Southeast valley
    • 85254 – the magic zip code

    Median size of rentals is 1,600 square feet. Rentals follow the same law of diminishing returns. Properties over 1,700 square feet have lower price per square foot rentals. Larger homes do not have huge price per square foot prices.

    There is not going to be a decline in rentals until the vacancy rates decline. At 5.6% vacancy rates very low. They haven’t been this low since the early 1980s. An issue during the 2004-2006 bubble was the high vacancy rates; indicating false demand. Today’s low vacancy rates indicate true demand.

    What affects demand?

    • Population growth
    • Relocation (inbound)
    • Household formation (growing)
      • Population doesn’t need to grow for demand to grow if new households are forming. You can increase demand without population growth. Household formation is mostly related to affordability.
    • Affordability (based on the worst census data ever)
      • Employment/income
      • Appreciation/depreciation
      • Interest rates (can offset effects of Appreciation/Depreciation)
        • Because rates are going up demand may decrease, but prices will not decline. There is still too much demand for the supply, prices are still increasing, quickly.
      • Loose/tight lending practices (can offset effects of interest rates)
    • Consumer Sentiment

    Population:

    National population growth is very low, and it is very location dependent. Where is the population moving? (the Census will have an update in March) How much can we draw into Greater Phoenix? Some people talk about over building for the future due to lack of growth. Today’s market is telling us that we do not have enough houses for the people that are here now.

    What will happen to AZ in the future? Job growth. Many people are moving here for jobs. Retirees used to drive the population growth, but now with so many new jobs more and more working age people are moving here. We depend heavily on domestic migration for our population growth.

    From 2020-2021 only six states had a population growth greater than the entire country’s. Those states are Arizona, Utah, Idaho, Montana, Texas, and South Carolina. 16 states saw population declines.

    Unsurprisingly, the areas with the greatest inbound flow are from southern California, Chicago, and Seattle. Check out the interactive map at https://flowsmapper.geo.census.gov/map.html

    What affects supply?

    • New homes
    • FSBOs
    • Appreciation/Depreciation (Equity)
    • Foreclosures/Household Formation (shrinking)
    • Relocation (Outbound)
    • Divorce/Illness/Death/Job Losses/Tragedy
    • Consumer sentiment

    Builders are not going to crash the market, after a decade of insufficient building the undersupply is significant. Until you see vacancies or longer days on market, builders will keep building. Are the builders overbuilding? Permit counts are where they were in the 90s, down 15.7% year over year. New home sales declined 0.5% in 2021 from 2020. We are not currently overbuilding for the demand.

    Even if builders wanted to build like they did in 2005; it won’t happen. There are still far too many challenges with tight labor and supply chain issues. Typical build time is up to 12-14 months. Permits are primarily being pulled for the west valley and Pinal County.

    Arizona has indefinitely tabled a recent controversial bill that would have allowed the state to override city zoning and rules.

    Household formation is growing, which makes supply drop. When household formation slows, supply increases.

    Investor Flips through December 2021:

    The more balanced the market, the fewer flip transactions. Briefly, in 2014, we had a balanced market and was the year with the fewest flips. Today’s market is seeing nearly as many flips as we had in 2012, when investors were selling all of the properties they picked up for $1 in 2011 (the bottom of the market after the crash). iBuyers do not affect supply.

    Zillow lost $880M on its failed iBuyer business. How did they do this in a market with 28% appreciation in 2021? By paying more for properties and it sold them for. Zillow’s median acquisition price was $466,765 and its median sales price was $430,000.

    Opendoor is in the hot seat with a median acquisition amount of $429,500 and a median sales price of $435,000. ibuying is risky and yet Opendoor just launched in the Bay area.

    Offerpad is the most conservative of the three and is not doing as poorly as the others. Offerpad’s median acquisition price of $395,000 is 8.8% higher than its median sales price of $429,900.

    Traditional flips are doing great. The long term average return is 30-40% and right now the average return is about 25%. This is significantly better than the iBuyer returns.

    Short term rentals might be adding some supply, maybe. Cities are enforcing ordinances on short term rentals. PV and Scottsdale are enforcing the most.

    Short term rentals are mostly in the Northeast valley, primarily in Scottsdale, Paradise Valley, and north Phoenix. One reason rents are so high is because short term rentals reduce supply in these areas which makes houses in these areas cost even more. Long term rentals is a place for someone to live so it helps slow price appreciation.

    Short term rental data is tough to track. Despite some available data, analysts believe that the numbers in the chart below are very low. Rather than 210 short term rentals in Paradise Valley, experts believe the number is closer to 380, which is closer to 6% of supply in PV.

    Realtors:

    ARMLS Agent population has grown 19% in the past 5 years. With declining inventory and increasing competition, many agents are expected to leave the business. Keep track of those agents getting out and work with them for referrals, etc.

    New listings:

    • YTD down 3.1% year over year. In 2021 we had a lot of new listings hitting the market.
    • We are at the lowest count for new listings since 2001. Contract activity is higher than 2021.
    • Newly accepted contracts are sky rocketing.
    • There are 3.5% more listings in the MLS than we had this time last year.
    • Listings under contract are down 2.1 from last year but still very high and are expected to keep rising.
    • Closings are still coming in very high. Second highest closing rate since 2000 (behind 2021).

    Cromford Market Index (CMI): 

    The best tool for predicting future price appreciation trends and is available on the main page of the Cromford Report: https://cromfordreport.com/ (without a subscription) 

    • 100 is balanced and prices rise at the rate of inflation (currently 7%), below 100 is a buyer’s market, above 100 is a seller’s market, prices drop below 90, prices rise at 110. 
    • On 3/20/2020 we were at 241 
    • On 5/15/2020 we were at 145.2 
    • Yesterday we were at 471.9
    • We peaked on 3/14/2021 at 514.9 
    • CMI is the predictor, it moves first and then appreciation follows. Cannot predict the CMI. It tells us where we are. 

    The predictor says the annual appreciation rates are going to increase. This is not good for buyers. Prices are not declining.

    Supply stopped dropping so quickly. At 4.1 points in 30 days, demand is now dropping faster than supply which is down 2.4 points in 30 days. We are starting to see a slight softening in the market.

    Prices are not going down. Prices are going up quickly. Currently at a 2% month over month rate. First half of 2021 we saw a 3-5% rate of appreciation. In the second half of the year, we had 1.1% monthly appreciation.

    Cities with the most new home completions have the weakest CMI. Cities with fewest new homes have the highest CMI.

    Median Sales Prices:

    The median sales price is up 50% in 2 years!

    Prices are increasing slightly faster than they were at the end of 2021 but not as quickly as they were in the first half of 2021. Currently prices are increasing at a 1.8% month over month, up from 1.6% just last month. We may see this go up but unlikely to go up to the 4-5% we saw last year. Definitely be faster than 1.1% from last year. Average and median prices are increasing at about the same percentage together.

    2022 will not be like 2021, buyers are exhausted and pulling back slightly.

    What is normal anymore?

    It could be another year before we see demand drop to near normal. Demand dropped in 2018 due to rates. No softening in price anytime soon. The rate of growth is slowing. Supply has to go above demand for prices to drop. It is not worth waiting for prices to go up 20% for a slight possibility of a small drop maybe in the future. The interest rates hikes have slightly decreased demand, slightly.

    Past 21 Years:

    • Buyer’s market – 3.6 years
    • Balanced market – 4.6 years (2001-2003, 2014)
    • Seller’s market – 13 years

    What we are used to is not a balanced market. We are used to a weak seller’s market, like 2015-2019. There were seller concessions and some wiggle room for negotiations.

    Contract Ratio:

    • We are mirroring last year.
    • Phoenix has slight weakening in demand.
    • Pinal County has a lot of demand.

    The demand is many areas is not unusual demand. Pinal and northeast valley cities have high high high demand and crazy low inventory. None of our areas have much supply, way below on where we should be. The highest contract ratio you should see is 105. All cities are currently over 200.

    Closed Sales:

    • We currently have a 22% annual appreciation rate (normal is 4-10%).
    • 46% of homes sold over asking in February.
    • Median over asking $11,000 (up from 10,000 last month)
    • List to sale price ratio is rising. Great to be a buyer in Q4. Normal is 97-98%.
    • Median days on market is currently 7 and will likely drop to 5.
    • Median sales price is $445,000 up 27.1% from February 2021.

    Summary:

    Prices are expected to rise through June, possibly even at a faster rate than last year. Even in a booming market, buying still wins. It’s a hedge against inflation and provides greater opportunity as the value increases.  

  • Greater Phoenix Real Estate Update 5/14/2021

    Once again, today is all about the AZ market. On Wednesday, Lawyers Title hosted a presentation with Tina Tamboer with the Cromford Report. She always shares pertinent and timely information. Below I have combined a lot of her information from her presentation, along with additional information from my research.

    Inflation:

    According to Reuters, consumer price inflation increased by 0.8% from March to April, the largest increase since June 2009. It increased by 4.2% year over year, the highest since September of 2008. Experts blame supply chain challenges and last spring’s weak readings. Many economists believe has taken the brunt of inflation already. Consumers call it appreciation and economists call it inflation.

    Why Do We Have a Housing Shortage?

    From 2000 to 2009 we over-built for the population. From 2010-2020 we under-built for the population. In 2004-2006, speculation building on credit caused huge problems. When the lending dried up, we had huge price declines. This is not a gap that can be closed easily.

    Housing unit counts will be released at the end of May.

     New Construction:

    Material prices are going up. Lumber has increased the most at roughly 430% year over year. Eye On Housing is a great blog with lots of information. The increased cost of materials for the average new home is nearly $36,000. Condos are up $1,300. Apartments are up $119 a month. Builders pass the costs to the consumers. Builders are begging appraisers to take into consideration the increased material when appraising. If an appraisal doesn’t come in at contract then the builders will struggle to sell.

    Personal income growth soared in 2020. People did not take fancy vacations, spent less on gas, spent less on eating out, etc. This helps offset the rise in prices.

    Single-family permits through March are up 26.7%, year over year. We are at elevated levels. People are afraid of all the building. We haven’t seen this many permits since 2006. The builders may not build all the houses they have permits for.

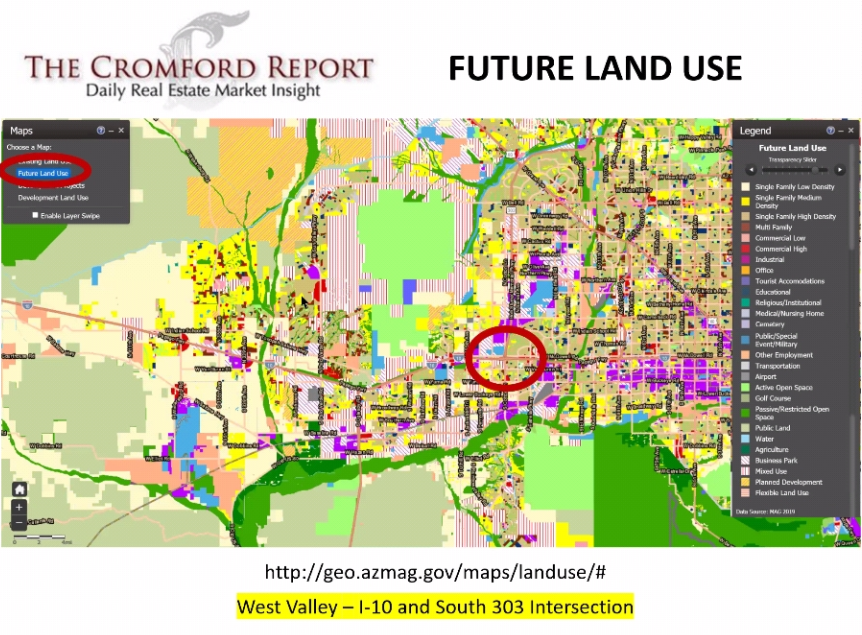
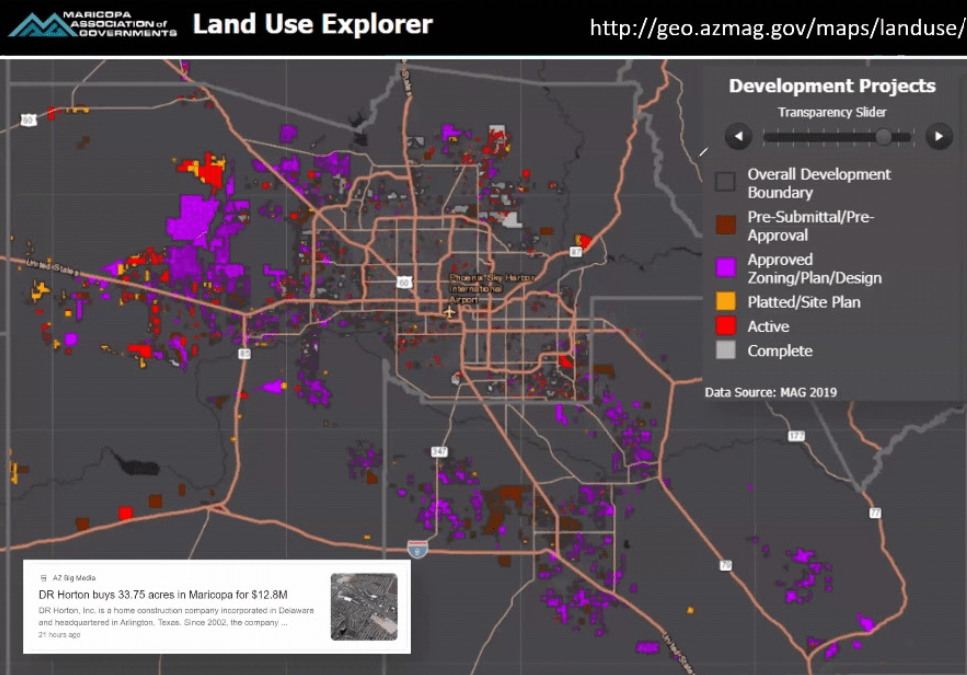
    To see the existing and future planned developments visit http://geo.azmag.gov/maps/landuse/

    Blue is vacant land, which there is a lot of in the northwest valley by the I-17 and 303. The future land use shows upcoming development. A lot is going in around the Taiwan Semiconductor Manufacturing Company.

    Yellow is SFR. High density is tan. Pale yellow is low density, yellow is medium density. Affordable housing to come in the NW valley also. Green is agricultural land, light green is passive land use. Tons of SFR building on the west side. Lots of industrial, which brings lots of jobs.

    Many people are worried about water. The future plans show development in place of agriculture. Agriculture uses far more water than developments do.

    DR Horton is buying large quantities of land as far south as Eloy and that huge Superstition Vistas area just south of Apache Junction.

    Employment:

    US unemployment rate: 6.1%

    AZ unemployment rate: 6.7%

    The labor force increased. Our base has recovered for people who are already working. The numbers don’t look great but we are improving. A lot of service sector jobs are coming back and restaurants and hotels are hiring.

    • Month over month, Arizona nonfarm employment increased by 16,000 jobs.
      • Nine of the eleven major sectors gained jobs.
    • Year over year, Arizona nonfarm employment declined by 2.9%, while US nonfarm employment declined by 4.4% YoY.
    • Year over year, ten major sectors lost jobs; one major sector gained jobs.
    • The Arizona unemployment rate decreased to 6.7% in March 2021 from 6.9% in February 2021.
    • Month over month, the Arizona labor force increased by 6,749 individuals
    • As of March 2021, the Arizona labor force is larger than it was prior to the COVID-19 pandemic.

    Population:

    US population grew by 0.4% we grew by 1.8%. Losing population slows housing growth because fewer people are in houses and buying houses. Our growth came from domestic migration with the largest populations coming from CA, IL, WA.

    Forbearance:

    When forbearance ends it will not rain houses.  There are about 2.2 million mortgages or about 4.2% in an active forbearance plan. There have been huge improvements in forbearance counts. 54% have successfully exited the plan. If all states are equal, each would have about 46,000 properties in forbearance.

    Lots of people are exiting and are current, about 47% are ok. The struggling amount is about 16.4% and that leaves us 7,128 new listings for all of them if they are all struggling and need to sell right away. That is not enough to cause a problem.

    Greater Phoenix economic council has diversified employment over the past 10 years. NV, TX, LA, FL, NJ are going to have more issues with forbearance exits because of the business. We will probably not even have as many as 7,000.

    For more information on forbearance, check out my latest AZ Forbearance Update, here. Properties that are late and in forbearance are still counted in the delinquency numbers. For more info on delinquencies, check out my AZ Forbearance Update from the end of April, here.

    Inflation:

    Overall including gas is 2.6%. (April came out Wednesday) People are stressed, gas has seen an impact. The overall long-term inflation rate is 3%. We are within range. We were at 2.9% right before the pandemic. We have been under 2% and have gotten spoiled. We like low inflation. Low inflation usually follows not-so-great times in our lives. There is no real correlation between inflation and appreciation. When we are in a balanced market appreciation matches the rate of inflation, when it is low, things are not good. Probably won’t have an impact on housing.

    Luxury Market:

    The luxury market and Bitcoin have spiked in 2021. Luxury increased in 2020, but this year it is crazy. It is not just from the CA buyers. The $2 million market is booming! Only Bitcoin and luxury real estate have exploded to this extent. No supporting data, only circumstantial.

    Recording only tells us whether or not they have a loan. Not how they paid for it, with USD or crypto

    Bitcoin is the only thing that has gone up as fast as real estate, if it drops off, will we see a drop off?

    Bitcoin in real estate has been a big headliner for a year. People are buying with crypto. Who are we attracting to Phoenix? A lot of tech companies from CA. Again based on circumstantial info.

    Cromford Market Index:

    Available on the main page of the Cromford Report: https://cromfordreport.com/ (without a subscription)

    • 100 is balanced and prices rise at the rate of inflation, below 100 is a buyer’s market, above 100 is a seller’s market, prices drop below 90, prices rise at 110.
    • On 2/5/2020 we were at 215.1
    • On 3/20/2020 we were at 241
    • On 5/15/2020 we were at 145.2
    • Yesterday we were at 461.2
    • We peaked on 3/14/2021 at 514.9
    • Prior to this run, the previous peak was 312.9 in the spring of 2005.
    • CMI is the predictor, it moves first and then appreciation follows. Cannot predict the CMI.

    The CMI is declining. This is where we see the shift taking shape. Demand is not falling as fast as it was earlier in the year. Since December demand has been dropping but inventory was dropping faster, keeping the CMI high. When the CMI started declining it was at a rate of about 8 points a month, then 5 points and now we are at 2.3 points a month. Demand has stopped dropping and actually increased yesterday, supply has actually risen which is great news. When demand goes below normal is when we see fewer transactions. Homes are still appreciating. It is good to see demand level off. Under 90 is low demand.

    There are still multiple offers and many sales over asking. Measure the temperature 514.9 degrees to 461.2 degrees; the market is still super-hot.

    How long will it take us to get to balance? It took 8 months to drop in 2005. If we stay at this rate, we are looking at 11.5 months to get to balance, which is May of 2022. It is measuring like 2005 which only means that prices are going up at a slower rate.

    Appreciation rates respond to markets. Appreciation rates will continue rising for the next 3-6 months. Annual appreciation rates rise when CMI drops. Price is a lagging indicator. It shows us where we were. CMI is a leading indicator, it tells us will happen.

    Yes, it is still a good time to buy because you always want to buy in a seller’s market, it is a winner’s market. Watch the equity grow. If it drops, it is ok because you have a down payment. Buyer’s markets are losers markets, everyone loses in a buyer’s market, and prices keep dropping during a buyer’s market.

    Just because it goes up does not mean that it will go down. The worst case is going down to balance. Nothing is indicating a decline in prices and no one is predicting one. If supply and demand come together and demand is below balance, the market will be slow and boring with fewer transactions. If supply and demand come together with demand above balance, then the market will be fast-moving, exciting, and have lots of transactions.

    There are 5 cities with increasing CMIs: Fountain Hills, Glendale, Goodyear, Paradise Valley, and Surprise. The factor for downward trend is affordability and pent up demand that created a surge, and buyer fatigue.

    Affordability:

    Affordability in Q1 2021 did not drop below 60, which is the bottom of the unaffordable range. The median family income is $79,000 a year. The national affordability score is 63.1 and for Phoenix, it is 62.8.

    Rentals are not affordable, mortgages are but not rents year over year. Affordability will be tough on rentals. With FHFA 7% portfolio limits for 2nd homes, any added expense will be pushed to the renter, further challenging renters.

    Supply:

    Inventory is rising. It doesn’t usually rise in May, going against the local seasonality trends. This is something to watch. People aren’t going to notice it yet. When you are supposed to be going down and are going up instead it shows a shift in the marketplace.

    Demand:

    • Restrained by lack of supply, not so much by demand.
    • 57.1% of sales closed over asking in April.
    • $16,100 median over asking amount.
    • Larger homes are appreciating more and faster. This is not normal for us or really anywhere.
    • The median sales price for single-family homes has reached $418,500, which is a 33% year over year appreciation rate.

    Summary:

    • The seller’s market is weakening. Sellers won’t notice but we do.
    • Supply: 77% below normal but increasing.
    • Demand: 7.6% above normal, leveling off.
    • 57% of April sales closed over asking for a median amount of $16,000.
    • The median days on market is 6 (hasn’t changed in 7 weeks)
  • Greater Phoenix Real Estate Update 3/19/2021

    Once again, today is all about the AZ market. Recently, Lawyers Title hosted a presentation with Tina Tamboer with the Cromford Report. She always shares pertinent and timely information. Below I have combined a lot of her information from her presentation, along with additional information from my research.

    What affects supply?

    • New Homes
    • FSBOs
    • Appreciation/Depreciation (equity)
    • Foreclosures/Household Formation (shrinking)
    • Relocation (Outbound)
    • Divorce/Illness/Death/Job Losses/Tragedy
    • Consumer Sentiment

    What affects demand?

    • Interest Rates
    • Appreciation/Depreciation (affordability)
    • Relocation (inbound)
    • Employment/Income
    • Loose/Tight Lending Practices
    • Population Growth
    • Household Formation (growing)
    • Consumer Sentiment – this could be the most important of them all.

    The recent announcement that Fannie Mae and Freddie Mac must restrict second home and investment property loans to only 7% of their total portfolio (far less than it is currently) may negatively impact demand. This move could force second home buyers to pay higher interest rates on their loans.

    Employment:

    • AZ is on track to see 11% job growth over the next 2 years.
    • 519 new companies came to AZ in the past 5 years.
    • The AZ job market has diversified a lot in the past 12 years. We have gone from the majority of our population working in hospitality and housing to also have an emphasis on tech, biotech, manufacturing, health care, etc. 
    • Arizona’s unemployment rate is 6.3% and the national rate is 6.7%. 5% is considered full employment.
    • Initial claims were at 4,108 the first week of March, normal is 3,807.
    • Continuing claims remain significantly heightened. We are running 65,000 continuing claims a week and normal is about 19,000.
    • People will less education have been more negatively impacted than have those with a college degree or higher.

    Renters:

    Due to the high unemployment rates for younger workers and less-educated workers; renters are struggling more than homeowners. In addition to the additional renter’s assistance in the latest stimulus plan, Arizona has quite a few options for rental assistance. Landlords are able to register on behalf of their tenants. For more information visit: https://des.az.gov/ERAP

    Forbearance:

    There are people who think it will be raining homes when the forbearance period ends. This is not going to happen.

    Every 3 months we see an improvement, as more borrowers exit their forbearance plans. But the past few months have been flat. Hovering around 2.6 million borrowers in a plan. The recovery continues making slow progress. At the end of March, we will likely see a lot of forbearance plan exits. There have been additional filing extensions. For more information on forbearance, delinquencies, and demand please see my forbearance update from Wednesday, here.

    Foreclosures:

    What happens with the moratoriums are lifted? We will see a wave of foreclosure filings but not of short sales. After 18 months of no foreclosures, there will be a backlog. But they will mostly be sold normally as owners have more equity today. According to KCM, on average nationwide there are about 69,000 foreclosure a month, during normal times.

    Population:

    • Population growth is creating demand.
    • When you lose population, you have extra homes, when you gain it, you have insufficient supply.
    • AZ is #2 for incoming migration behind Idaho.
    • All of the moving companies agree, people are leaving CA, NY, IL, WV and are moving out to AZ, ID, and TX.

    The majority of AZ’s population growth is from people moving here domestically. It is not from lots of babies or international migration. 

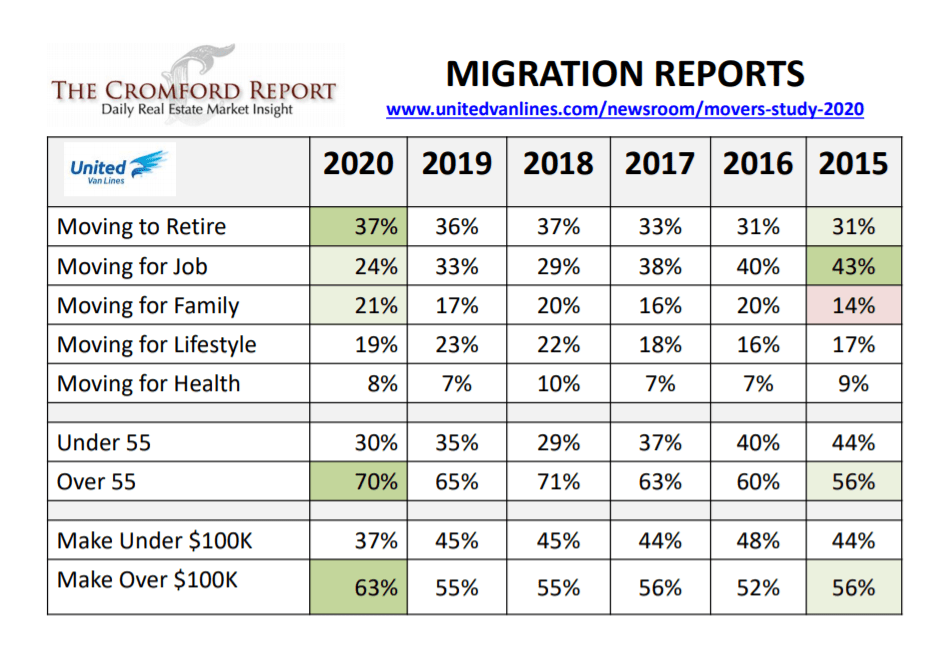
    Most people started moving here to retire versus people moving here for a job in 2018. Look at the ages of the people moving here, their income, and retirement. Our domestic migration is older, wealthier, highly trained, more experienced population and finishing up their career and then retiring.

    Affordability:

    The ideal range for housing affordability is 60-75. Through Q4 2020 in Phoenix someone earning the median income, they can afford 60.6% of what is for sale. In LA it is 9.1% and San Francisco it is 11%.

    Household Income:

    Maricopa county association of governments, shows demographics, click here for the demographics map. Density is increasing in new luxury areas. South Chandler, a lot of Gilbert, east Mesa, and South Mountain is getting bluer. Showing new emerging luxury markets.

    Job Centers:

    Jobs are created by freeways. The heavier the employment area the bluer. A lot of job growth, biomedical, and tech, fueling demand, bringing in people who make a lot of money. Click here for the interactive map.

    The Cromford Market Index:

    Available on the main page of the Cromford Report: http://cromfordreport.com/ (without a subscription)

    • 100 is balanced and prices rise at the rate of inflation, below 100 is a buyer’s market, above 100 is a seller’s market, prices drop below 90, prices rise at 110.
    • On 2/5/2020 we were at 215.1
    • On 3/20/2020 we were at 241
    • On 5/15/2020 we were at 145.2
    • Yesterday we were at 512.6.
    • We peaked on 3/11/2021 at 514.9
    • Prior to this run, the previous peak was 312.9 in the spring of 2005.
    • CMI is the predictor, it moves first and then appreciation follows. Cannot predict the CMI.

    Demand is 14.5% above normal and supply is 77.7% below normal. Despite demand dropping by one percentage point a week and faster than supply is dropping, the market is still in a frenzy. As inventory stabilizes, which it will, this market is unsustainable, things will calm down. Buyers will once again be able to get a house without having to write 10+ offers before one is accepted.

    With the CMI dropping, prices will not go down, they will increase more slowly, which is what we want. This appreciation rate is not sustainable. This doesn’t mean that we will crash. Indicators wants to be together. Markets want to be balanced. Buyer’s markets do not happen because it is time. There are reasons for buyer’s markets, there has to be a cause. Demand needs to be lower than supply in order for prices to drop.

    Is it a good time to buy? Yes! It is best to buy and sell in a seller’s market. Sellers make money and buyers see appreciation right away.   

    What will slow it down? Affordability.

    Affordability in Q1 2021 will likely drop below 60 which puts pressure on prices. the level of demand doesn’t start dropping until we are below 60. How long will it take to get to lower demand? It could take months, who knows. Demand, once it goes to the low side of normal and then we will see supply go up.

    Number of Sales:

    ADRE is adding 500 new licensees a month, not all in residential but it is increasing the amount of competition as more people will be fighting for a certain number of monthly sales.

    Supply will come up when demand goes below normal, prices will continue to go up until demand is lower than supply.

    As transaction counts decrease, it will impact all of our jobs. We need to position ourselves for the 2nd half of the year. Focus all efforts on listings. We have the demand but the competition will be increasing significantly in the 2nd half of the year.

    Interest rates:

    The recent big hike could be a reason for the drop-off in demand. Even though 3% is great, people get scared when it increases. It does limit options for some buyers.

    Those who waited for prices to go down are now paying $20,000 more for the median sales priced home just since December due to rate increases. Since 2018 the median sales price has increased by $80,000 but monthly payments have only gone up by $133.

    Rents:

    Rents are more expensive than mortgages. Rents are rising quickly. The median house rents for $250 more a month than the going rate for a mortgage for the same house.

    Rents are rising = not a bubble, rents decline due to false demand. Rents are declining in San Francisco while houses are still rising, equating to false demand. San Francisco could be considered over-valued. Prices only drop due to vacancies. The number one risk in housing is vacant houses.

    Vacant Homes:

    • 77% of sales in Q4 2020 were owner occupied purchases.
    • The remaining 23% were iBuyer, investor buy & hold or flip, vacation rental, 2nd home properties.
    • Second homes are always counted as vacant. The new Fannie and Freddie rules may impact this market.
    • The new lending guidelines will not impact international buyers.

    Supply: 

    • Supply stopped dropping for the first time in a year.
    • It actually increased by 100 listings in one week.
    • This is the worst year in the past 20 years for new supply, even with the slight increase and despite being the best quarter ever for sales.

    Sales:

    • Selling 2500 houses a week, listing 2000 a week.
    • Pendings have been flat for 1.5 months, we can’t increase properties under contract when there isn’t enough supply.
    • And still are having the best quarter ever.
    • Appreciation is pushing 24% year over year, but most price ranges it is about 10%-15%.

    These markets do not stay like this forever. We will not see then impact of the pullbacks for about a month. Then we may see a slow down in sales. Need more inventory under $500,000.

    Sales Over Asking:

    • 49% of sales closed over asking the first week of March.
    • 40% of sales closed over asking in February.
    • The median amount over asking is $10,000.
    • 50% of all accepted contracts were on the market for only 6 days.

    Population Growth and New Builds:

    We overbuilt for 10 years before we started underbuilding for another 10 years and population growth outpaced building. In 2019 we ate up the last of the glut of housing.

    Developments:

    Without new listings we have to look at new construction which is a challenge due to labor shortages and lumber prices are up 200%, adding, on average an additional $24,000 in cost to the average new build.

    Most developments are going into the south and west, due to cheaper available land. Very little in the north. Values are increasing the most in the north. Click here for the interactive map.

    Contract Ratio:

    On March 1 the contract ratio was 300. That means for every 100 active listings there are 300 pending listings.

    Final Thoughts:

    • Supply is down 77.7% below normal.
    • Demand is 14.5% above normal.
    • Year over year appreciation is pushing 24%.
    • Sales prices are not going to decline this year.
    • There will likely be fewer sales in 2021 than in 2020 due to the low inventory levels.
  • Greater Phoenix Real Estate Update 3/5/2021

    Today is all about the AZ market. Recently, Lawyers Title hosted a presentation with Tina Tamboer with the Cromford Report. She always shares pertinent and timely information. Below I have combined a lot of her information from her presentation, along with additional information from my research.

    What affects supply?

    • New Homes
    • FSBOs
    • Appreciation/Depreciation (equity)
    • Foreclosures/Household Formation (shrinking)
    • Relocation (Outbound)
    • Divorce/Illness/Death/Job Losses/Tragedy
    • Consumer Sentiment

    What affects demand?

    • Interest Rates
    • Appreciation/Depreciation (affordability)
    • Relocation (inbound)
    • Employment/Income
    • Loose/Tight Lending Practices
    • Population Growth
    • Household Formation (growing)
    • Consumer Sentiment – this could be the most important of them all.

    What affects luxury demand?

    • Stock Market Performance
    • Corporate Profits
    • Exchange Rates
    • Consumer Sentiment

    Employment:

    • Initial and continuing unemployment remains elevated but has dropped more quickly than experts initially predicted.
    • We still need to drop again by 50% in order to get to where we were a year ago.
    • The pandemic has negatively affected low-income earners and renters far more than it has homeowners, which is why despite the high levels of unemployment real estate continues to be the strongest sector in the economy.
    • Mid-level managers had the highest initial claims, according to the most recent update.

    Forbearance:

    There are people who think it will be raining homes when the forbearance period ends. This is not going to happen.

    Every 3 months we see an improvement, as more borrowers exit their forbearance plans. But the past few months have been flat. Hovering around 2.6 million borrowers in a plan.

    Foreclosures:

    What happens with the moratoriums are lifted? We will see a wave of foreclosure filings but not of short sales. After 18 months of no foreclosures, there will be a backlog. According to KCM, on average nationwide there are about 69,000 foreclosure a month, during normal times.

    When the foreclosures are filed, homeowners will likely sell as they have equity, which is why we will not see short sales. The vast majority of borrowers do not have loans greater than the value of their house. Tina expects that we will not see a lot of properties actually being foreclosed upon because the owners can easily sell.

    This will not be a big issue nor will it last very long. It is more about pent-up demand than it is about a wave of foreclosures. These homes will be absorbed quickly and will not have a negative impact on prices.

    Stock Market Performance:

    This impacts the luxury market which has been crazy busy because the stock market is doing so well.

    There was a pause in March, a dip at the election, and then a slight drop for Gamestop and now we have a nice smooth curve. Things are looking good and driving nice corporate profits.

    iBuyers are also impacted by the stock market.

    Population:

    AZ is in the top 3 states for population increase along with Texas and Florid. This shows population changes from July 2019 to July 2020.

    CA lost 70,000 residents. This is the first time it has had declines 150 years.

    LA has been the #1 spot for AZ’s inbound migration for 20 years. This chart shows where people are searching from only.

    Several moving companies share the data of the moves they service. They are all slightly different but show consistent trends. Arizona is usually in the top 5 for inbound relocations nationwide.

    This shows the most people coming here are still coming here to retire. The 55+ group got larger.

    63% of the inbound migration have an annual income of $100,000 or more.

    We are on the low side of international inbound. It is nearly all domestic migration.

    Household Formation:

    Household formation creates demand. In 2020 household formation spiked across the country. The work from home movement drove this train. Now you don’t need to live where you work so people left and got their own space. When you can live anywhere the world opens up.

    Affordability:

    The ideal range for housing affordability is 60-75. Through Q4 2020 in Phoenix someone earning the median income, they can afford 60.6% of what is for sale. In LA it is 9.1% and San Francisco it is 11%.

    Taxes:

    Why are all of the rich people coming here? It only took the threat of CA increasing the income tax from 13% to 16% to create a mass exodus. It created a wealth flight. High tax states are seeing outbound migration to lower tax states.

    Outbound states: CA, IL, NY, NJ

    Inbound: AZ, TX, FL, ID

    Business taxes, corporate taxes, individual income taxes, sales taxes, and property taxes are

    are the highest in those outbound states. AZ, while not the lowest in all of those, competes for being quite low in most of those. Sales tax tends to be the highest because it is the easiest to raise.

    Where are all of the rich people going?

    Maricopa county association of governments, shows demographics, click here for the demographics map. Density is increasing in new luxury areas. South Chandler, a lot of Gilbert, east Mesa, and South Mountain are getting bluer. Showing new emerging luxury markets.

    Job Centers:

    Jobs are created by freeways. The heavier the employment area the bluer. A lot of job growth, biomedical, and tech fueling demand, bringing in people who make a lot of money. Click here for the interactive map.

    The Cromford Market Index:

    Available on the main page of the Cromford Report: http://cromfordreport.com/ (without a subscription)

    • 100 is balanced and prices rise at the rate of inflation, below 100 is a buyer’s market, above 100 is a seller’s market, prices drop below 90, prices rise at 110.
    • On 2/5/2020 we were at 215.1
    • On 3/20/2020 we were at 241
    • On 5/15/2020 we were at 145.2
    • Yesterday we were at 513.6.
    • Prior to this run, the previous peak was 312.9 in the spring of 2005.
    • CMI is the predictor, it moves first and then appreciation follows. Cannot predict the CMI.

    At balance, or 100, values rise at the rate of inflation. We are not at balance. Demand is 18% above normal. Supply is 77% below normal.

    Demand is now dropping faster than supply. The CMI slows as demand decreases. When the index goes flat prices do not drop. Supply remains shockingly low.

    In order for prices to stop rising, the CMI has to be at 100. If it starts on the way down, prices rise more slowly. When will it go down? We can’t know that until it stops rising. In order for prices to start dropping we will have at least 8 to 10 months and that is only after the CMI stops increasing.

    What will slow it down? Affordability.

    Tina thinks we have dropped below 60, the level of demand doesn’t start dropping until we are below 60. How long will it take to get to lower demand? It could take months, who knows. Demand, once it goes to the low side of normal and then we will see supply go up.

    Property values will not go down. As long as demand is above supply, prices rise. When demand and supply come together, below balance, transaction volume declines.

    Appreciation: 

    Prices have increased 22.5% year over year, is it really a good time to buy? It is always a good time to buy in a seller’s market and it is good for sellers to sell in a seller’s market. Buying and selling in a seller’s market is winning.

    Interest rates have impacted affordability. Payments have gone up $72 for an increase buying power of $77,000.

    Rents:

    Rents are more expensive than mortgages. Rents are rising quickly. The median house rents for $250 more a month than the going rate for a mortgage for the same house.

    Rents are rising = not a bubble, rents decline due to false demand. Rents are declining in San Francisco while houses are still rising, equating to false demand. San Francisco could be considered over-valued.

    Supply:

    Supply is down 54% year over year. The end of forbearance plans (summer 2022) will have little impact in adding supply. All price points are down.

    This year is lower than last year and last year was a record. We do not have enough coming in to maintain supply.

    Population Growth and New Builds:

    We overbuilt for 10 years before we started underbuilding for another 10 years and population growth outpaced building. In 2019 we ate up the last of the glut of housing.

    Developments:

    Without new listings we have to look at new construction which is a challenge due to labor shortages and lumber prices are up 170%, adding, on average an additional $16,000 in cost to the average new build.

    Most developments are going into the south and west, due to cheaper available land. Very little in the north. Values are increasing the most in the north. Click here for the interactive map.

    Single Family Permits are Up!

    • Avondale at 428% year over year.
    • Coolidge at 182% year over year.
    • Glendale at 123% year over year.
    • Casa Grande at 84% year over year.

     Multi Family Permits are Up too!

    • Overall increase of 28% year over year.
    • Mostly they are not for sale, build to rent movement is huge.
    • Gilbert is up 434% year over year.
    • Mesa is up 236% year over year.
    • Chandler is up 142% year over year.

    Demand:

    • 50% of all accepted contracts were on the market for only 6 days.
    • Contract activity is booming.
    • Busiest February ever.
    • As of 2/26 there were 12,072 properties in escrow. Normal is 10,000.
    • In February, the contract ratio was 239, meaning for every 100 active listings there are 239 in escrow.
    • In 6 weeks, many areas moved from $200,000 to $300,000 for average sales prices

    Final Thoughts:

    • Supply is down 59% from last year.
    • New listings, year to date, are down 11% from last year.
    • Demand is 18% above normal.
    • Sales prices are not going to decline this year.
    • There will likely be fewer sales in 2021 than in 2020 due to the low inventory levels.
  • Greater Phoenix Real Estate Update 1/15/2021

    Today is all about the AZ market. Yesterday, Lawyers Title hosted a presentation with Tina Tamboer with the Cromford Report. She always shares pertinent and timely information. Below I have combined a lot of her information from her presentation, along with additional information from my research.

    Employment:

    The national unemployment claims through December increased slightly. Not enough to change it from 6.7%. Last week’s preliminary numbers show another increase in initial claims.

    The people with the lowest levels of education and the lowest income earners are struggling the most. Unemployment is impacting landlords and renters more than homeowners.

    Private sector earnings increased most dramatically in Q2 2020. More and more jobs in AZ have higher wages. Incomes are increasing.

    2018-2019 had earnings decreases.

    Forbearance:

    • Lately, we are seeing weak numbers and small decreases.
    • We will likely see this come to a head in March and April. All plans are in 3-6 months long with a maximum of 12 months.
    • There is a lot of misinformation and a lack of info on the borrower’s side. Some may get NOTs. Servicers have unclear guidelines and tracking could be better.
    • Even in the best markets properties still foreclose. On average, prior to 2020, there were about 69,000 foreclosures nationwide a month.
    • There will be an increase (not huge) in foreclosures because of the backlog due to the moratoriums.
    • As soon as the NOTs are recorded Realtors and investors will after those properties. People will want to buy the houses and the sellers will be able to have a normal sale.
    • This is on hold until the moratoriums are lifted.

    Click here to watch my 10 minute forbearance update video from Wednesday.

    Corporate Profits:

    The end of 2020 was surprising, for Q3 2020 corporate profits were way up. They bounced back and set a record which is what drove the demand for luxury real estate.  The strong stock market drove confidence up.

    Increasing corporate profits is a significant indicator for luxury real estate. Q3 2020 had huge corporate profits with an increase of 27.5% over Q2 2020. Nationwide luxury real estate is booming and Arizona is no exception. In October, the largest residential sale in the state closed at just over $24 million in Silverleaf in Scottsdale.

    Stock market is on the rise, again. Wall Street does not like uncertainty. It improves after elections, regardless of who is elected, because it likes to know who is in the White House and Congress. Political uncertainty is poison for the stock market.

    Why do we have a housing shortage?

    This is a housing shortage for real. This is not like 2005-2008. We are waiting for the census for the newest numbers, not yet for the county but soon. Expects all numbers by May 2021.

    In 2019 we were already in trouble. We under built the past 10 years. We had a glut of housing in 2008 and it has all been absorbed. Since then we have been behind. Overbuilt for 10 years and then underbuilt for 10 years. All housing types; rental, condos, townhouses, single family.

    From 2010 through 2019 our population increased by 18% while housing units increased by 9%.

    AZ ranked #3 for population growth from June 2019-June 2020. Behind Texas and Florida. CA lost people for the first time in over 100 years.

    23% of inbound migration to Arizona is from California.

    We have diversity of labor force and job growth. More jobs are coming because we have the lots of highly skilled workers. It is pushing out the people who cannot afford the housing prices. Work force housing is really being impacted.

    Moving Company Data:

    Moving companies United Van Lines, Atlas, and National share their client data trends. United provides a deeper dive into the data, but all are worth checking out.

    Since moving trend data is older, another way to gauge where people are moving from is based on home searches. Redfin shares the search trends for its users.

    The Cromford Market Index:

    Available on the main page of the Cromford Report: http://cromfordreport.com/ (without a subscription)

    • 100 is balanced and prices rise at the rate of inflation, below 100 is a buyer’s market, above 100 is a seller’s market, prices drop below 90, prices rise at 110.
    • On 2/5/2020 we were at 215.1
    • On 3/20/2020 we were at 241
    • On 5/15/2020 we were at 145.2
    • Yesterday we were at 461.4.
    • Prior to this run, the previous peak was 312.9 in the spring of 2005.
    • CMI is the predictor, it moves first and then appreciation follows.

    We are 30% above normal for demand. Supply is about 72% below normal. Our supply was stable for most of the year, just at a very low rate. In December inventory started dropping. Demand also started dropping in December. Supply dropped faster than demand and it is still in favor of sellers. Demand is down 4% but supply is down 5.6%

    On 1/1/21 we were at 432 and now we are in the 461.4, super-fast increase. We cannot even discuss prices going flat, let alone down until CMI starts dropping. This indicator needs to drop in order to even lead to a price decrease. It will still take us a year to get to a balanced, aka normal, market for prices to go flat. At this rate, if demand dropped now, prices would not decrease until at least 2022.

    Affordability:

    What could possibly slow this down? Affordability challenges.

    At the end of 2018 we dropped below the affordability range and we had an immediate decline in demand. We almost hit balance in 2018. Then in 2019 we got back into the normal affordability range.

    Normal is 60-75 in Q3 2020 we were at 61.9. For Q4 2020 Tina expects that we will drop below normal affordability. Makes it more expensive for buyers.

    The low-interest rates have kept the median monthly payment down. Since 2018 the monthly PITI has increased by $23 while the median sales price is up $68,000 to $328,000. The PITI for the median home is $1,574 with an interest rate of 2.67%. In 2018 median the median home was $259,995 and with a 4.87% interest rate, the PITI was $1,551 a month.

    Emotions:

    Supply is dropping and demand is still high. Until the demand and supply come closer to each other the prices will keep going up. The numbers simply do not support the theory that prices will go down.

    People are emotional about what they think will happen. But the numbers do not support it.

    Not a good idea to sell and rent for a year. Rents are increasing faster than sales prices. In 2005 with decreasing rental rates, it made sense. In 2020 rents increased $254 a month or 16%.

    It is not great to buy in a buyer’s market and then watch their value decline. It is best to buy at the end of the buyer’s market. The beginning of a buyer’s market has the highest prices.

    It is always good to buy at the beginning of a seller’s market and sell at the end of a seller’s market.

    Are we in a peak market? No, will prices appreciate from here? Yes. The numbers all point to yes.

    We are not at the peak.

    To truly time the market, buyers needed to purchase real estate in 2015. That was the beginning of our seller’s market.

    Inventory:

    • We are 52% below where we were at this time in 2020.
    • The first week of January is always the lowest supply week.
    • January 2021 was the lowest first week in January in at least 20 years. Historically low. Shockingly low.
    • Seasonally adjusted, we should have 21,000-25,000 the second week of January. Not 5,000!
    • About 10% of all listings in MLS are outside of greater Phoenix. We are way, way, way low.
    • We had 10% more listings in Q4 2020 than in Q4 2019.
    • We had 12.5% more listings in December 2020 than in December 2019 but have 31% greater demand.
    • In 2020, about 100,000 homes were listed, 38 than in 2019.
    • New listings are 36% below January 2020. There were only 2,088 new listings in the first 11 days of the year.

    New Builds & Developments:

    • Single-family permits are up 24.1% through November 2020.
    • Builders are struggling to maintain a healthy labor force
    • Lumber prices increased by 161% due to fires in the west and a beetle infestation in the east.
    • Multi-family permits are by 21.6% through November 2020. 90% is for rentals only about 10% is for sale.
    • Multi-family sales increased by 0% from 2019 to 2020.
    • In the past 8 months resale take off in sales past new home sales. New home sales are recorded once it closes and people move in, usually are negotiated 8-10 months prior.
    • New single-family median sales price increased by 6.1% in 2020.
    • New single-family sales volume increased by 15%.

    Builders are building in many areas throughout the valley around job expansion. Tons in Florence and Casa Grande. The Town of Maricopa is getting a hospital. Be sure to check out the Land Use Explorer http://geo.azmag.gov/maps/landuse/ on the Maricopa County Association of Governments website, https://www.azmag.gov/Programs/Maps-and-Data. The Land Use Explorer shows expansion, what is approved, proposed and pending.

    Demand:

    • Listings under contract are up 20.1% year over year. Tina expects to see a spike in under contract listings through May.
    • A lot of listings are selling before they actually hit the MLS. Coming soon never gets counted towards supply because it goes straight into under contract.
    • 33% of all closings in December were for over asking.
    • So far in January, we are at 35% over asking.
    • The median over amount is $5,500.
    • Very few concessions paid. Only 10% of closings had any seller concessions. Huge drop, 60% decrease a year ago.
    • Year over year appreciation for resale homes is 21.6%.

    2020 Records:

    • Q4 2020 the best Q4 ever. We had 27,804 sales, up 25% from 2019.
    • Sales only 4% more than in 2019 due to the slow spring.
    • Listed 111,000 listings.
    • Sold about 101,000 listings.
    • 90% of everything that was listed sold.
    • Luxury crushed it in 2020, pushed all averages up.
    • The heavy top end is pushing prices up.
    • In 2020 we hit #2 for MLS sales, beat 2019 by 4%. 2005 remains #1 for units sold.
    • In 2020 we #1 for dollar volume. Beat 2019 by 19.5% and blew away 2005.

    Contract Ratio:

    • Contract ratio is 171 right now.
    • For every 100 listings active there are 171 in escrow
    • January is always the lowest for contract ratio and December is always the second-lowest, until 2020 and now December and January are the top months for this year.

    Final Thoughts:

    New listings are under contract in a matter of days.  We are not at the peak, prices will rise probably all the way through 2021. You have time, markets move slowly. Things change over the course of years.

    Prices in 2021 will continue to rise most likely throughout the year. May slow down as demand wanes with rising prices.

    To sign up for a Cromford Report subscription visit http://cromfordreport.com/join-armls.html 

  • Greater Phoenix Real Estate Update 12/11/2020

    Today is all about the AZ market. Yesterday, Lawyers Title hosted a presentation with Tina Tamboer with the Cromford Report. She always has incredible information to share. Below I have combined most of her information from her presentation, along with some additional information from my research.

    Employment.

    The national unemployment rate through November is 6.7%. The Arizona unemployment rate through November is 8%. After running lower than the rest of the country through October, we had some slight gains in unemployment. Tina called it a stutter step.

    There was a short recovery for some and then a long, slow recovery for the large group remaining unemployed. Early on it was about the age of the unemployed, that has changed and now there is one significant indicator in regards to unemployment. It is education level. The largest group of unemployed Americans, at 64%, have only a high school education. The unemployment rate for those with at least 4 years of college is 11%. It is only 2% for those with a graduate degree. This could be a large factor for housing and why it has not been impacted by the high unemployment rates.

    Forbearance.

    Most forbearance plans are 3, 6, or 9 months long. Unless the borrower requests an extension; once the plan has run its course the borrower is removed from the plan. This is why we often see the biggest drops at the end of the month. (Tina Tamboer)

    After two weeks in a row of slight forbearance count increases, the first increases in 25 weeks, I closely watched the numbers released this week, three weeks make an early trend. And they remained flat, unchanged from the previous week, 5.54% of loans and roughly 2.8 million loans in a forbearance plan. (MBA)

    Initial stage forbearance plans decreased. Like the 2 weeks prior, this past week had increases in forbearance plan extensions and re-entries. Nearly 78% of all loans in forbearance are on extension. (MBA)

    Click here to watch my 12 minute forbearance update video from Wednesday.

    Luxury Real Estate.

    Between corporate profits and a bullish stock market, the luxury real estate market is moving faster than ever.

    Increasing corporate profits is a significant indicator for luxury real estate. Q3 2020 had huge corporate profits with an increase of 27.5% over Q2 2020. Nationwide luxury real estate is booming and Arizona is no exception. In October, the largest residential sale in the state closed at just over $24 million in Silverleaf in Scottsdale.

    The stock market is on the rise. Wall Street does not like uncertainty. It improves after elections, regardless of who is elected because it likes to know who is in the White House and Congress. Political uncertainty is poison for the stock market. And we have not seen a recovery like this since 2009!

    Cromford Market Index.

    Available on the main page of the Cromford Report: http://cromfordreport.com/ (without a subscription)

    Cromford Market Index Continued.

    • 100 is balanced and prices rise at the rate of inflation, below 100 is a buyer’s market, above 100 is a seller’s market, prices drop below 90, prices rise at 110.
    • On 2/5/2020 we were at 215.1
    • On 3/20/2020 we were at 241
    • On 5/15/2020 we were at 145.2
    • Yesterday we were at 387.7, a new record and nearly double the May low.
    • Prior to this run, the previous peak was 312.9 in the spring of 2005.
    • CMI is the predictor, it moves first and then appreciation follows.

    What is driving the CMI this time? We have had different drivers over throughout the past 9 months. At the beginning we had a flat supply line with rising demand. Then supply was remained stable while demand increased. Since Thanksgiving, supply started dropping and demand has been relatively stable, only declining very slightly. Demand remains 35% above normal while supply remains 65% below normal. Tina thinks that there might be a slight decrease in demand due to affordability challenges.

    The CMI has been moving at Ludacris speed. In the first 10 days of December we have gone from 375.6 to yesterday’s 387.7. When the market turns, which it has not done yet, how long is the journey back to balance and what does that look like?

    In 2005 it took 8 months from the turn to reach balance. In 2009 it took 4 months. In 2013 it took 6 months. Based on where we are now, even at a very fast clip, it will take at least 10-12 months to reach balance. Because it is still going up today, it will be even longer. As long as you are in a seller’s market prices rise. Prices may rise more slowly, but they still rise. We are nowhere near a crash, we are very far above normal.

    Affordability.

    Wages did not increase from Q2 2020 to Q3 2020 but affordability dropped. Here is a chart from HousingWire illustrating price increases and wage increases. Wages are not keeping up with appreciation, putting pressure on buyers.

    Greater Phoenix is on the edge of no longer being affordable. At the end of Q3 2020 our affordability rate was 61.9, down 3 points from Q2 2020 while wages remained flat. Below 60 is considered unaffordable. We dropped below the affordable range in 2018 and demand dropped. Demand drops when affordability is challenged. Tina believes that we will drop below 60 by the end of Q4 2020. Even if demand would start to come down now, because we are above normal, prices will still rise. The movement takes a long time. It hasn’t started yet, the day isn’t today but at some point there will be a shift.

    When shifts start prices increase more slowly. That is the prediction for 2021 that prices will go up more slowly.

    Appreciation.

    Year over year appreciation through December is nearly 17%. Nearly all of that appreciation has come since May. With the speed of this increase it is no surprise people fear a bubble. This time is very different from 2005. For a more detailed explanation of the market differences, check out my market comparison here.

    Prices are not going to go down. Don’t wait. We haven’t seen a price decline in 9 years.

    Single family rental demand is through the roof. For today’s median home the full mortgage payment is $1,563. For the same house a renter is paying $1,850 and those prices go up each year, in Q4 2019 the rent was $1,595!

    2001 to 2005 rents dropped by 18%, not real housing demand. NYC and San Francisco have dropping rents and increasing rental vacancies. Tina doesn’t recommend buying in an area with dropping rentals rates.

    Supply.

    Available inventory is down 44.6% from 2019. Yikes! For most of the past several months our inventory levels stayed stable, just at very low levels. We were bringing them on the market very quickly but they were selling just as quickly. Since Thanksgiving supply has not been able to keep up with demand and inventory levels are dropping.

    The big question coming into the New Year is how many new listings will we get in January-March? If we do not get enough new listings in January-March we will have a struggle with supply for most of the year. The first half of the year sells more than then second half (in normal markets)

    Year to date through December 6, we have had a 1.9% increase in new listings year over year. The week after Thanksgiving brought fewer new listings than expected. Even with 28% more new listings, it is not enough to keep up with the 35% above normal demand.

    Builders.

    Last week, DR Horton bought 270 square miles of raw land called Superstition Vistas for $245.5 million. It is bigger than Mesa, Gilbert, Chandler, and Queen Creek combined!

    Builders are building in many areas throughout the valley around job expansion. Tons in Florence and Casa Grande. The Town of Maricopa is getting a hospital. Be sure to check out the Land Use Explorer http://geo.azmag.gov/maps/landuse/ on the Maricopa County Association of Governments website, https://www.azmag.gov/Programs/Maps-and-Data. The Land Use Explorer shows expansion, what is approved, proposed and pending. The yellow below shows single family developments.

    • Lots of jobs and future development coming to the area.
    • We have exceeded 2019 total permits through October by 3.5% and by 23% in single-family permits.
    • Multi-family is up 30% but mostly for apartment complexes to rent.
    • The cause of the housing shortage: 2000-2019 we had a population growth of 18% and an increase in total housing units of 9%.

    Demand.

    • A lot of our demand is coming from renters because rent has gone up so much. Lots of millennials buyers. (national, 32% of buyers are first time home buyers)
    • Typically we have around 9,100 listings in escrow at this time of year. Today we have 28% more pendings than normal.
    • December typically sees a decline in supply, lots of cancellations and expirations and, of course, lots of closings.
    • Under contract, regardless of when they went into escrow are up 27.9% year over year.
    • Every year we have a drop in listings under contract in the 2nd half of the year. This year we stayed stable, which never ever happens. Busiest December ever.
    • We had a slight slowdown in new contracts after Thanksgiving, better than last year but still weak.
    • Escrow fallouts are down, year over year.
    • 122% gain in sales from 600-800K, year over year.

    This is the best Q4 ever. More sales than ever before. We are up 25% year over year for the quarter. The week after Thanksgiving, listings over $1 million had an accepted contract rate 102% above this time last year. Year to date sales are up 2.5%, this is not higher because of the March slow down.

    Every year CA is the #1 state feeding buyers to AZ. #1 county is LA County, followed by San Diego County and Orange County.

    Who is buying what?

    • 77.3% of buyers are owner occupied, 12.2% are investor purchases, and 2% are iBuyer purchases.
    • Where did the ibuyers go? They are going into lending and they are going traditional and selling regularly on the market.
    • iBuyer purchases are down 56%.
    • FSBOs are being purchased by ibuyers and investors, a great way to approach FSBOs offering help

    Contract Ratio.

    • 50% of all contracts accepted were on the market for 13 days or less.
    • 35% closed over asking in November. Median over asking is $5,100.
    • For every 100 listings on the market there are 174 in escrow.

    Final Thoughts.

    2021 talking point: forbearance expiration, foreclosure moratorium expiration, and affordability. New listings are up 6% so far in Q4 2020. November new listings were up 2% year over year. November sales were up 26% year over year. Under contract up 28% year over year. Luxury is a huge part of the increase. 2020 has been a rollercoaster. Any stability in 2021 will be welcome.

    To sign up for a Cromford Report subscription visit http://cromfordreport.com/join-armls.html 

    Please share this with your colleagues and clients.

    Copyright 2020 by Sarah Perkins

  • Cromford Report Market Update 5/5/2020

    Cromford Report accounts are only available to licensed Realtors who are members of ARMLS, to sign up and learn more go to www.cromfordreport.com/join-armls

    The Cromford Market Index:

    Available on the main page of the Cromford Report: http://cromfordreport.com/ (without a subscription)

    The Cromford Market Index (CMI):

    • 100 is balanced, below 100 is a buyer’s market, above 100 is a seller’s market
    • On 2/5/2020 we were at 215.1
    • On 3/20/2020 we were at 241
    • Today we are at 146.2
    • When it is at 100 property values increase at the rate of inflation.
    • Our supply is 55.3, 44.7% under where we should be.
    • Our demand has decreased to 80.9 (below normal) from it’s peak of 107.5 on 3/20/2020 (7.5% above normal)
    • As long as the CMI is above 110, prices will continue to rise, just at a slower rate
    • As of the week of April 19th the dramatic free fall has started slowing
    • Avondale (227.3) and Glendale (209.6) are the only 2 cities with a CMI over 200 as of 4/30/2020
    • Gilbert rounds out the top 3 with a CMI of 199.0
    • Paradise Valley’s 111.7 CMI is at the lowest, keeping PV in an appreciating market

    Price Appreciation:

    • Price is a lagging indicator
    • In order to gauge the actual price response, it will be another 6-8 weeks of watching closings to see the price response to COVID
    • Vacancies cause the biggest risk to real estate values
    • AirBNB’s lost a lot of value, is a riskier investment, and will be our biggest challenge (since REOs are low)
    • Forbearance keeps people in their homes
    • When inventory and demand both drop at the same time prices do not decrease
    • Prices are currently not dropping
    • Dr. Lawrence Yun, the chief economist of NAR is quoted saying, “More temporary interruptions to home sales should be expected in the next couple of months, though home prices will still likely rise.”
    • Market share by price range is changing, cheaper houses are selling more because so many luxury homes were pulled off the market

    Demand:

    *Today’s drop in demand is NOT due to changes in the market. It is an outside stimulus which pushes all indications that the recovery will be quick*

    • Factors that influence demand:
      • Interest Rates
      • Appreciation/Deprecation (affordability)
      • Relocation (inbound)
      • Employment/Income
      • Loose/Tight lending practices
      • Population growth
      • Consumer sentiment (biggest factor)
    • Right now consumer sentiment is driving everything. Fear overrides logic.
    • Unemployment is creating fear.

    Unemployment/Employment:

    • In March Arizona had a net job loss of 7400
    • Teachers are government employees. think about everything in the schools. all teachers technically unemployed
    • Historically unemployment was $240 a week, not a lot and forces people to get back to work right away.
    • State is now providing extra support, with an additional $600 a week, works out to be nearly $44,000 annually
    • Why would someone take a job that pays less than $840 a week? When that benefit goes away we will see a huge rebound for unemployment numbers and people will go back to work
    • 1099 independent contractors are now receiving unemployment benefits, this has never been available before, complicates the numbers since there is nothing to compare these numbers with
    • Majority of jobs lost are in accommodations, arts, and recreation
    • Since 2011 AZ has brought in tons of new industries, we are more diversified giving us more stability, as some areas are still hiring while others are letting people go.
    • In 2008 when the market crashed the majority of AZ jobs were based in real estate and hospitality.

    Affordability:

    • As of Q4 Phoenix metro was 65% affordable (meaning that normal people can afford 65% of houses on the market)
    • When the market crashed in 2008, we were 27% affordable
    • Watch for increased buyer demand from out of state relocation. People are looking to leave the more expensive cities likes NYC, Seattle, San Francisco and the Bay Area

    Supply:

    • What Affects Supply?
      • New home construction
      • appreciation/depreciation (equity)
      • Vacation rental vacancies
      • Foreclosures
      • relocation (outbound)
      • marriage/illness/death/job losses/tragedy
      • Consumer sentiment (biggest driver) how people feel
    • Anything that causes people to combine households, leaves a vacancy, that grows inventory
    • Inventory increased by 32.4% in the past 5 weeks (since 3/14), still 23% below where we were this time last year
    • First week of April saw a 9% dip in new listings hitting the market
    • The largest inventory increases we saw was 65% in the $250,000-$300,000 range, year over year
    • Highest price cities have smallest increases in inventory

    Under Contract:

    • In the first 6 weeks of the pandemic, new pendings dropped by 39.1%
    • Since April 5th we are up nearly 32% in number of new contracts written and accepted
    • We are 25.4% below where were at the end of April 2019 for pendings
    • Orange line is back on market, we had 2 weeks of large escrow falls outs and now we are back to normal
    • Real estate is picking up. These closing are now 6-8 weeks out.
    • Transactions are taking a little longer close
    • Half of all properties listed and put under contract during the pandemic took 21 days to sell
    • Properties asking $500,000-$1,000,000 had the largest increases

    Contract Ratio:

    • What is in escrow getting ready to close compared to what we have on the market
    • May 2nd was 71. Indicating for every 100 active listings, there are 71 properties in escrow
    • March 7th was 117 (for every 100 active listings, there were 117 properties in escrow INSANE)
    • April 18th was the lowest at 66
    • Scottsdale and the more expensive zip codes are selling more slowly
    • New home construction slowed
    • Now AIRBNBs are coming on the market and they are in great condition, they are selling fast.
    • 27% of everything that closed in April was over asking. Crazy appreciation was starting
    • The market has already turned, the headlines are way behind


    Sales Volume & Price:

    • Year to date sales volume is down 1.3% from 2019
    • April was down 27% in monthly sales volume, could go as low as 35-38%
    • Real estate values are holding steady
    • The longer sellers are on the market the more they will likely drop prices.
    • Luxury market would be doing price reductions but since so many cancelled they are having few price reductions
    • Complaints have increased against appraisals. We got low appraisals in January and February, the thing that has changed, is how people feel about it (consumer sentiment)
    • Before COVID (BC) the buyer usually came up with the extra money as sellers would not come down
    • Today buyers may not be as willing to come up to meet the appraisal price and sellers have to be more willing to come down
    • Seller concessions
      • 25% of all closings the first week of January had seller concessions
      • 18% the first week of April
      • 23.1% the first week of May
      • Before prices increase, seller concessions decrease
    • Price per square foot has dropped from $163 to $163 in the under $500,000 range, due to the increased sales of lower dollar properties
    • Price per square foot has dropped from $186.75 to $186.50 in all price ranges

    55+ Communities:

    • 55+ is suffering a lot
    • Mostly out of state relocation
    • Highest risk of COVID
    • Once travel restrictions are lifted expect recovery
    • Likely to be the last market segment to recover
    • No data available in the Realtor Cromford Report account (focuses on trends, not enough separate data on the subdivision level)
    • Cromford Public, which does not include MLS data, includes data in 55+
    • Cromford Public is $240 a year and does not require ARMLS membership

    Final Thoughts:

    • 3 weeks in a row things are going well (3 weeks you can see trends)
    • escrow falls outs have stopped
    • Costs to the seller are going up, seller concessions
    • Sales volume is suffering, you can’t sell houses that were never on the market
    • Lots of data showing that things are good, ignore all that the bad news.
    • Lean into what you know.

    copyright 2020 by Sarah Perkins

  • Real Estate Market Update

    Real Estate Market Update

    Tina Tamboer, with the Cromford Report, recently presented on the residential real estate market in the Phoenix metro area.
    To subscribe to the Cromford Report, click here: http://cromfordreport.com/join-armls.html. The complete presentation is available to subscribers.
    Here are my notes:
    Forget everything that Tina said at the beginning of 2019, even forget what she said last quarter. Everything is different. Again.
    Cromford Market Index (CMI):

    • 100 is balanced, above 100 is a seller’s market, under 100 is a buyer’s market
    • Cromford Market Index 184.2 (strong seller’s market)
    • Supply 57.2 and dropping
    • Demand index 105.3
    • Every week the CMI has increased significantly
    • we are higher than we were last year
    • CMI hasn’t been this high since 2004
    • Currently tracking 2004 demand

    From February through June of 2019, we went from the weakest seller’s market in 5 years to the strongest seller’s market in 14 years! This happened in a span of 5 months (long term chart)!!
    2005 PTSD?

    • Despite the numbers tracking close to 2005, our market today is very different than in 2005
    • We have real demand today
    • 2005 was false demand
    • we have today something we didn’t have in 2005, skepticism. We are not there now
    • We are not in bubble range but are watching it closely

    Supply & Demand

    • When supply and demand move together, everything is great
    • When they move together above CMI of 100, there are lots of listings, lots of sales
    • When supply and demand move apart, things go crazy, everything becomes unstable
    • February 2019 supply and demand broke up, despite expectations of a flat, calm, easy market
    • 2004 saw higher transaction volume than today due to our low inventory
    • Prices will continue to rise as long as supply and demand move apart
    • Prices are expected to continue to rise through 2019 and into 2020

    Appreciation

    • We are not in a bubble but we are a bit high for regular appreciation
    • We moved above the regular appreciation level at the beginning of 2019
    • Properties asking $150-225K have the highest appreciation rate
    • Properties asking over $500K, 1-3% appreciation rate (balanced market, equals rate of inflation)
    • Properties asking $225-500K, 3-5% appreciation rate (above rate of inflation, seller’s market but not huge gains)
    • Properties asking $150-225K, 6-10% appreciation rate (lots of fix and flip investors, area with the most appreciation)
    • Properties asking under $150K, 2-5% appreciation rate
    • first half of 2019 was tracking behind 2018 for amount in escrow
    • turned in February, we are now tracking above 2018
    • tracking volume of 2017 but with higher price points
    • seasonally between May and December, we have a 30% drop of quantity of properties in escrow
    • best time to buy is the 2nd half of the year, the very best is the 4th quarter, buyers do not give up on the market, this is true for all price points

    What Effects demand?

    • interest rates
    • 2011-2014, 45% of purchases were for cash
    • mortgage rates have dropped, again
    • when rates went up slightly in March, buyers got off the fence. People thought rates hit the bottom.
    • appreciation/depreciation (affordability)
    • affordability index tracks affordability with the changes in wages
    • recent wage increases have put Phoenix back to being affordable
    • 2004 we were affordable, 2005 with a 45% increase we were no longer affordable
    • relocation (inbound)
    • employment/income
    • 2.2M people employed, largest it has ever been
    • Phoenix job growth is outpacing the rest of the country, by increasing 2-3%, nationally it is around 1%
    • 3 continuous months of wage increases (April, May, June)
    • click here for the interactive job-center map on the Maricopa County Association of Governments website: https://geo.azmag.gov/maps/azemployment/
    • loose/tight lending practices
    • population growth
    • tons of inbound relocation
    • Largest group is from southern California
    • #1 source of incoming people LA county
    • #2 San Diego county
    • #3 Chicago
    • Here is the map of to see where people are coming from: https://flowsmapper.geo.census.gov/map.html
    • cost to rent vs buy
    • people will rent when it makes more financial sense to do so
    • 2018 prices are up 8.1%, so far in 2019 prices are up 6.5%
    • people are thinking it is easier for them to rent
    • cost of sfr rent has increased 7.1%/ patio homes rent increased 7.8%
    • median rental $1700 monthly for 1802 square feet
    • Tina used the Zillow calculations to estimate equity over 5 years (60 months)
    • Using the median sales price of $288,000 for a 1805 square foot single family residence, here is the calculator: https://www.zillow.com/mortgage-calculator/ (schedule from Zillow, click full report, go to month 60)
    • If purchased for $246,452; after 5 years with no appreciation owners now have $41,500 in equity
    • Based on the current rate of inflation, with 5 years of payments adds $71,500 in equity
    • 2005 purchase prices increased, rent prices did not, sign of false demand
    • Today rents and purchase prices are rising, sign of true demand
    • consumer sentiment (how you feel about the market, which could trump everything else)
    • we are at historically low rates and everyone is getting raises
    • consumer sentiment is going up when people get raises
    • now people have moreconfidence and feel better about buying

    Fix & Flips

    • Biggest gains ($60,000 or 60% margins) in areas with cheap houses with up and coming employment centers
    • See https://geo.azmag.gov/maps/azemployment/
    • Luxury flippers are making up to 60% in Scottsdale on houses over $500,000
    • Headlines define flips as: a property purchased and sold within 2 years
    • 2013 was the biggest year for flippers
    • Flippers love sellers markets and retreat in balanced or buyers markets
    • iBuyers are doing most of their business between $200K-$250K
    • iBuyer purchases are considered a FSBO, which is $127 per square foot for $200K-$250K
    • iBuyer sells, on average, 7% more than the contract price. average on mls sales 9% increase between $200K-$250K

    What Effects Supply?

    • new home construction
    • appreciation/depreciation (equity)
    • foreclosures
    • relocation (outbound)
    • divorce/illness/death/job losses/tragedy
    • cost to renovate vs move up
    • consumer sentiment (feeling)

    Supply

    • 2019 brand new listings June-July 10.7% lower than in 2018. This is the first time this has happened since 2001
    • we had roughly half the number of employed people and half the number of houses in 2001
    • people don’t want to move
    • when we have sellers turning and buying again, then it is a wash on supply
    • 2010 lots of outbound relocation, loss of employment
    • 2014 was the year for Canadian buyers due to beneficial exchange rates
    • supply is plummeting, we are down 10.9% in supply, southeast valley 9.7% down inventory
    • new home construction eases up options but not a lot
    • properties over $2M inventory is up over 13%

    Prices

    • SE valley average sold price is between $100-400K
    • South Tempe is the only place in the SE Valley with an average over $500K
    • seller asking price is up 6.8% from year over year
    • Pendings are up 12% through July year over year
    • SE valley pendings are up 16% year over year
    • decline in offering closing costs
    • Q3 2015 27.9% of closings included seller concessions
    • today it is way lower
    • 30-40% of sales $150-250K have some sort of closing costs
    • 24-28% of those houses are selling over asking (making up the concessions paid)
    • outskirts of town sellers can negotiate more
    • Tina suggests checking out renovation loans
    • 19% sold over list price July 2019
    • correlates with June 2004
    • in May 2005 it was 38%

    Short Term Rentals

    • Are today’s false demand
    • AZ recently adjusted the regulation to not regulate. now you get a tax id.
    • PV & Sedona started the regulation movement
    • #1 risk of airbnb: everything is wonderful all the time
    • #2. we don’t know if this is the beginning of regulation. will taxes go up?

    Final Thoughts

    • interest rates dropped and everyone got a raise
    • Our market is still considered affordable
    • there is no end in sight for this seller’s market
    • prices have not come down and they are not projected to come down anytime soon. definitely not this year.
    • Next predicted recession is in 2020, will it effect real estate?
    • first thing to drop is tourism during a recession, will make an impact on Airbnb
    • 10% drop is the new definition of a crash. Always ask how a “market crash” is defined when people talk about a crash. Many of us think of the 50-60% days.