Tag: #tinatamboer

  • Greater Phoenix Real Estate Update 5/14/2021

    Once again, today is all about the AZ market. On Wednesday, Lawyers Title hosted a presentation with Tina Tamboer with the Cromford Report. She always shares pertinent and timely information. Below I have combined a lot of her information from her presentation, along with additional information from my research.

    Inflation:

    According to Reuters, consumer price inflation increased by 0.8% from March to April, the largest increase since June 2009. It increased by 4.2% year over year, the highest since September of 2008. Experts blame supply chain challenges and last spring’s weak readings. Many economists believe has taken the brunt of inflation already. Consumers call it appreciation and economists call it inflation.

    Why Do We Have a Housing Shortage?

    From 2000 to 2009 we over-built for the population. From 2010-2020 we under-built for the population. In 2004-2006, speculation building on credit caused huge problems. When the lending dried up, we had huge price declines. This is not a gap that can be closed easily.

    Housing unit counts will be released at the end of May.

     New Construction:

    Material prices are going up. Lumber has increased the most at roughly 430% year over year. Eye On Housing is a great blog with lots of information. The increased cost of materials for the average new home is nearly $36,000. Condos are up $1,300. Apartments are up $119 a month. Builders pass the costs to the consumers. Builders are begging appraisers to take into consideration the increased material when appraising. If an appraisal doesn’t come in at contract then the builders will struggle to sell.

    Personal income growth soared in 2020. People did not take fancy vacations, spent less on gas, spent less on eating out, etc. This helps offset the rise in prices.

    Single-family permits through March are up 26.7%, year over year. We are at elevated levels. People are afraid of all the building. We haven’t seen this many permits since 2006. The builders may not build all the houses they have permits for.

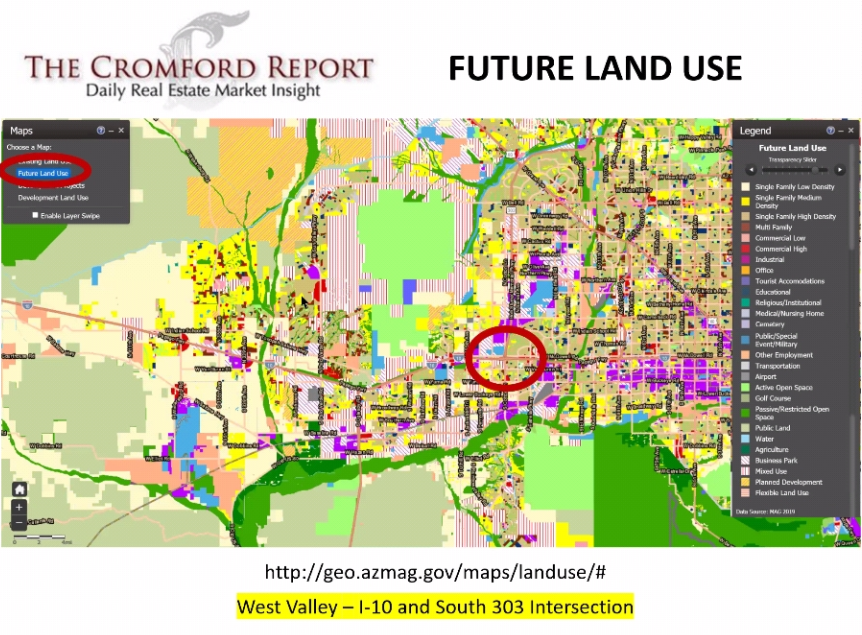
    To see the existing and future planned developments visit http://geo.azmag.gov/maps/landuse/

    Blue is vacant land, which there is a lot of in the northwest valley by the I-17 and 303. The future land use shows upcoming development. A lot is going in around the Taiwan Semiconductor Manufacturing Company.

    Yellow is SFR. High density is tan. Pale yellow is low density, yellow is medium density. Affordable housing to come in the NW valley also. Green is agricultural land, light green is passive land use. Tons of SFR building on the west side. Lots of industrial, which brings lots of jobs.

    Many people are worried about water. The future plans show development in place of agriculture. Agriculture uses far more water than developments do.

    DR Horton is buying large quantities of land as far south as Eloy and that huge Superstition Vistas area just south of Apache Junction.

    Employment:

    US unemployment rate: 6.1%

    AZ unemployment rate: 6.7%

    The labor force increased. Our base has recovered for people who are already working. The numbers don’t look great but we are improving. A lot of service sector jobs are coming back and restaurants and hotels are hiring.

    • Month over month, Arizona nonfarm employment increased by 16,000 jobs.
      • Nine of the eleven major sectors gained jobs.
    • Year over year, Arizona nonfarm employment declined by 2.9%, while US nonfarm employment declined by 4.4% YoY.
    • Year over year, ten major sectors lost jobs; one major sector gained jobs.
    • The Arizona unemployment rate decreased to 6.7% in March 2021 from 6.9% in February 2021.
    • Month over month, the Arizona labor force increased by 6,749 individuals
    • As of March 2021, the Arizona labor force is larger than it was prior to the COVID-19 pandemic.

    Population:

    US population grew by 0.4% we grew by 1.8%. Losing population slows housing growth because fewer people are in houses and buying houses. Our growth came from domestic migration with the largest populations coming from CA, IL, WA.

    Forbearance:

    When forbearance ends it will not rain houses.  There are about 2.2 million mortgages or about 4.2% in an active forbearance plan. There have been huge improvements in forbearance counts. 54% have successfully exited the plan. If all states are equal, each would have about 46,000 properties in forbearance.

    Lots of people are exiting and are current, about 47% are ok. The struggling amount is about 16.4% and that leaves us 7,128 new listings for all of them if they are all struggling and need to sell right away. That is not enough to cause a problem.

    Greater Phoenix economic council has diversified employment over the past 10 years. NV, TX, LA, FL, NJ are going to have more issues with forbearance exits because of the business. We will probably not even have as many as 7,000.

    For more information on forbearance, check out my latest AZ Forbearance Update, here. Properties that are late and in forbearance are still counted in the delinquency numbers. For more info on delinquencies, check out my AZ Forbearance Update from the end of April, here.

    Inflation:

    Overall including gas is 2.6%. (April came out Wednesday) People are stressed, gas has seen an impact. The overall long-term inflation rate is 3%. We are within range. We were at 2.9% right before the pandemic. We have been under 2% and have gotten spoiled. We like low inflation. Low inflation usually follows not-so-great times in our lives. There is no real correlation between inflation and appreciation. When we are in a balanced market appreciation matches the rate of inflation, when it is low, things are not good. Probably won’t have an impact on housing.

    Luxury Market:

    The luxury market and Bitcoin have spiked in 2021. Luxury increased in 2020, but this year it is crazy. It is not just from the CA buyers. The $2 million market is booming! Only Bitcoin and luxury real estate have exploded to this extent. No supporting data, only circumstantial.

    Recording only tells us whether or not they have a loan. Not how they paid for it, with USD or crypto

    Bitcoin is the only thing that has gone up as fast as real estate, if it drops off, will we see a drop off?

    Bitcoin in real estate has been a big headliner for a year. People are buying with crypto. Who are we attracting to Phoenix? A lot of tech companies from CA. Again based on circumstantial info.

    Cromford Market Index:

    Available on the main page of the Cromford Report: https://cromfordreport.com/ (without a subscription)

    • 100 is balanced and prices rise at the rate of inflation, below 100 is a buyer’s market, above 100 is a seller’s market, prices drop below 90, prices rise at 110.
    • On 2/5/2020 we were at 215.1
    • On 3/20/2020 we were at 241
    • On 5/15/2020 we were at 145.2
    • Yesterday we were at 461.2
    • We peaked on 3/14/2021 at 514.9
    • Prior to this run, the previous peak was 312.9 in the spring of 2005.
    • CMI is the predictor, it moves first and then appreciation follows. Cannot predict the CMI.

    The CMI is declining. This is where we see the shift taking shape. Demand is not falling as fast as it was earlier in the year. Since December demand has been dropping but inventory was dropping faster, keeping the CMI high. When the CMI started declining it was at a rate of about 8 points a month, then 5 points and now we are at 2.3 points a month. Demand has stopped dropping and actually increased yesterday, supply has actually risen which is great news. When demand goes below normal is when we see fewer transactions. Homes are still appreciating. It is good to see demand level off. Under 90 is low demand.

    There are still multiple offers and many sales over asking. Measure the temperature 514.9 degrees to 461.2 degrees; the market is still super-hot.

    How long will it take us to get to balance? It took 8 months to drop in 2005. If we stay at this rate, we are looking at 11.5 months to get to balance, which is May of 2022. It is measuring like 2005 which only means that prices are going up at a slower rate.

    Appreciation rates respond to markets. Appreciation rates will continue rising for the next 3-6 months. Annual appreciation rates rise when CMI drops. Price is a lagging indicator. It shows us where we were. CMI is a leading indicator, it tells us will happen.

    Yes, it is still a good time to buy because you always want to buy in a seller’s market, it is a winner’s market. Watch the equity grow. If it drops, it is ok because you have a down payment. Buyer’s markets are losers markets, everyone loses in a buyer’s market, and prices keep dropping during a buyer’s market.

    Just because it goes up does not mean that it will go down. The worst case is going down to balance. Nothing is indicating a decline in prices and no one is predicting one. If supply and demand come together and demand is below balance, the market will be slow and boring with fewer transactions. If supply and demand come together with demand above balance, then the market will be fast-moving, exciting, and have lots of transactions.

    There are 5 cities with increasing CMIs: Fountain Hills, Glendale, Goodyear, Paradise Valley, and Surprise. The factor for downward trend is affordability and pent up demand that created a surge, and buyer fatigue.

    Affordability:

    Affordability in Q1 2021 did not drop below 60, which is the bottom of the unaffordable range. The median family income is $79,000 a year. The national affordability score is 63.1 and for Phoenix, it is 62.8.

    Rentals are not affordable, mortgages are but not rents year over year. Affordability will be tough on rentals. With FHFA 7% portfolio limits for 2nd homes, any added expense will be pushed to the renter, further challenging renters.

    Supply:

    Inventory is rising. It doesn’t usually rise in May, going against the local seasonality trends. This is something to watch. People aren’t going to notice it yet. When you are supposed to be going down and are going up instead it shows a shift in the marketplace.

    Demand:

    • Restrained by lack of supply, not so much by demand.
    • 57.1% of sales closed over asking in April.
    • $16,100 median over asking amount.
    • Larger homes are appreciating more and faster. This is not normal for us or really anywhere.
    • The median sales price for single-family homes has reached $418,500, which is a 33% year over year appreciation rate.

    Summary:

    • The seller’s market is weakening. Sellers won’t notice but we do.
    • Supply: 77% below normal but increasing.
    • Demand: 7.6% above normal, leveling off.
    • 57% of April sales closed over asking for a median amount of $16,000.
    • The median days on market is 6 (hasn’t changed in 7 weeks)
  • Greater Phoenix Real Estate Update 12/11/2020

    Today is all about the AZ market. Yesterday, Lawyers Title hosted a presentation with Tina Tamboer with the Cromford Report. She always has incredible information to share. Below I have combined most of her information from her presentation, along with some additional information from my research.

    Employment.

    The national unemployment rate through November is 6.7%. The Arizona unemployment rate through November is 8%. After running lower than the rest of the country through October, we had some slight gains in unemployment. Tina called it a stutter step.

    There was a short recovery for some and then a long, slow recovery for the large group remaining unemployed. Early on it was about the age of the unemployed, that has changed and now there is one significant indicator in regards to unemployment. It is education level. The largest group of unemployed Americans, at 64%, have only a high school education. The unemployment rate for those with at least 4 years of college is 11%. It is only 2% for those with a graduate degree. This could be a large factor for housing and why it has not been impacted by the high unemployment rates.

    Forbearance.

    Most forbearance plans are 3, 6, or 9 months long. Unless the borrower requests an extension; once the plan has run its course the borrower is removed from the plan. This is why we often see the biggest drops at the end of the month. (Tina Tamboer)

    After two weeks in a row of slight forbearance count increases, the first increases in 25 weeks, I closely watched the numbers released this week, three weeks make an early trend. And they remained flat, unchanged from the previous week, 5.54% of loans and roughly 2.8 million loans in a forbearance plan. (MBA)

    Initial stage forbearance plans decreased. Like the 2 weeks prior, this past week had increases in forbearance plan extensions and re-entries. Nearly 78% of all loans in forbearance are on extension. (MBA)

    Click here to watch my 12 minute forbearance update video from Wednesday.

    Luxury Real Estate.

    Between corporate profits and a bullish stock market, the luxury real estate market is moving faster than ever.

    Increasing corporate profits is a significant indicator for luxury real estate. Q3 2020 had huge corporate profits with an increase of 27.5% over Q2 2020. Nationwide luxury real estate is booming and Arizona is no exception. In October, the largest residential sale in the state closed at just over $24 million in Silverleaf in Scottsdale.

    The stock market is on the rise. Wall Street does not like uncertainty. It improves after elections, regardless of who is elected because it likes to know who is in the White House and Congress. Political uncertainty is poison for the stock market. And we have not seen a recovery like this since 2009!

    Cromford Market Index.

    Available on the main page of the Cromford Report: http://cromfordreport.com/ (without a subscription)

    Cromford Market Index Continued.

    • 100 is balanced and prices rise at the rate of inflation, below 100 is a buyer’s market, above 100 is a seller’s market, prices drop below 90, prices rise at 110.
    • On 2/5/2020 we were at 215.1
    • On 3/20/2020 we were at 241
    • On 5/15/2020 we were at 145.2
    • Yesterday we were at 387.7, a new record and nearly double the May low.
    • Prior to this run, the previous peak was 312.9 in the spring of 2005.
    • CMI is the predictor, it moves first and then appreciation follows.

    What is driving the CMI this time? We have had different drivers over throughout the past 9 months. At the beginning we had a flat supply line with rising demand. Then supply was remained stable while demand increased. Since Thanksgiving, supply started dropping and demand has been relatively stable, only declining very slightly. Demand remains 35% above normal while supply remains 65% below normal. Tina thinks that there might be a slight decrease in demand due to affordability challenges.

    The CMI has been moving at Ludacris speed. In the first 10 days of December we have gone from 375.6 to yesterday’s 387.7. When the market turns, which it has not done yet, how long is the journey back to balance and what does that look like?

    In 2005 it took 8 months from the turn to reach balance. In 2009 it took 4 months. In 2013 it took 6 months. Based on where we are now, even at a very fast clip, it will take at least 10-12 months to reach balance. Because it is still going up today, it will be even longer. As long as you are in a seller’s market prices rise. Prices may rise more slowly, but they still rise. We are nowhere near a crash, we are very far above normal.

    Affordability.

    Wages did not increase from Q2 2020 to Q3 2020 but affordability dropped. Here is a chart from HousingWire illustrating price increases and wage increases. Wages are not keeping up with appreciation, putting pressure on buyers.

    Greater Phoenix is on the edge of no longer being affordable. At the end of Q3 2020 our affordability rate was 61.9, down 3 points from Q2 2020 while wages remained flat. Below 60 is considered unaffordable. We dropped below the affordable range in 2018 and demand dropped. Demand drops when affordability is challenged. Tina believes that we will drop below 60 by the end of Q4 2020. Even if demand would start to come down now, because we are above normal, prices will still rise. The movement takes a long time. It hasn’t started yet, the day isn’t today but at some point there will be a shift.

    When shifts start prices increase more slowly. That is the prediction for 2021 that prices will go up more slowly.

    Appreciation.

    Year over year appreciation through December is nearly 17%. Nearly all of that appreciation has come since May. With the speed of this increase it is no surprise people fear a bubble. This time is very different from 2005. For a more detailed explanation of the market differences, check out my market comparison here.

    Prices are not going to go down. Don’t wait. We haven’t seen a price decline in 9 years.

    Single family rental demand is through the roof. For today’s median home the full mortgage payment is $1,563. For the same house a renter is paying $1,850 and those prices go up each year, in Q4 2019 the rent was $1,595!

    2001 to 2005 rents dropped by 18%, not real housing demand. NYC and San Francisco have dropping rents and increasing rental vacancies. Tina doesn’t recommend buying in an area with dropping rentals rates.

    Supply.

    Available inventory is down 44.6% from 2019. Yikes! For most of the past several months our inventory levels stayed stable, just at very low levels. We were bringing them on the market very quickly but they were selling just as quickly. Since Thanksgiving supply has not been able to keep up with demand and inventory levels are dropping.

    The big question coming into the New Year is how many new listings will we get in January-March? If we do not get enough new listings in January-March we will have a struggle with supply for most of the year. The first half of the year sells more than then second half (in normal markets)

    Year to date through December 6, we have had a 1.9% increase in new listings year over year. The week after Thanksgiving brought fewer new listings than expected. Even with 28% more new listings, it is not enough to keep up with the 35% above normal demand.

    Builders.

    Last week, DR Horton bought 270 square miles of raw land called Superstition Vistas for $245.5 million. It is bigger than Mesa, Gilbert, Chandler, and Queen Creek combined!

    Builders are building in many areas throughout the valley around job expansion. Tons in Florence and Casa Grande. The Town of Maricopa is getting a hospital. Be sure to check out the Land Use Explorer http://geo.azmag.gov/maps/landuse/ on the Maricopa County Association of Governments website, https://www.azmag.gov/Programs/Maps-and-Data. The Land Use Explorer shows expansion, what is approved, proposed and pending. The yellow below shows single family developments.

    • Lots of jobs and future development coming to the area.
    • We have exceeded 2019 total permits through October by 3.5% and by 23% in single-family permits.
    • Multi-family is up 30% but mostly for apartment complexes to rent.
    • The cause of the housing shortage: 2000-2019 we had a population growth of 18% and an increase in total housing units of 9%.

    Demand.

    • A lot of our demand is coming from renters because rent has gone up so much. Lots of millennials buyers. (national, 32% of buyers are first time home buyers)
    • Typically we have around 9,100 listings in escrow at this time of year. Today we have 28% more pendings than normal.
    • December typically sees a decline in supply, lots of cancellations and expirations and, of course, lots of closings.
    • Under contract, regardless of when they went into escrow are up 27.9% year over year.
    • Every year we have a drop in listings under contract in the 2nd half of the year. This year we stayed stable, which never ever happens. Busiest December ever.
    • We had a slight slowdown in new contracts after Thanksgiving, better than last year but still weak.
    • Escrow fallouts are down, year over year.
    • 122% gain in sales from 600-800K, year over year.

    This is the best Q4 ever. More sales than ever before. We are up 25% year over year for the quarter. The week after Thanksgiving, listings over $1 million had an accepted contract rate 102% above this time last year. Year to date sales are up 2.5%, this is not higher because of the March slow down.

    Every year CA is the #1 state feeding buyers to AZ. #1 county is LA County, followed by San Diego County and Orange County.

    Who is buying what?

    • 77.3% of buyers are owner occupied, 12.2% are investor purchases, and 2% are iBuyer purchases.
    • Where did the ibuyers go? They are going into lending and they are going traditional and selling regularly on the market.
    • iBuyer purchases are down 56%.
    • FSBOs are being purchased by ibuyers and investors, a great way to approach FSBOs offering help

    Contract Ratio.

    • 50% of all contracts accepted were on the market for 13 days or less.
    • 35% closed over asking in November. Median over asking is $5,100.
    • For every 100 listings on the market there are 174 in escrow.

    Final Thoughts.

    2021 talking point: forbearance expiration, foreclosure moratorium expiration, and affordability. New listings are up 6% so far in Q4 2020. November new listings were up 2% year over year. November sales were up 26% year over year. Under contract up 28% year over year. Luxury is a huge part of the increase. 2020 has been a rollercoaster. Any stability in 2021 will be welcome.

    To sign up for a Cromford Report subscription visit http://cromfordreport.com/join-armls.html 

    Please share this with your colleagues and clients.

    Copyright 2020 by Sarah Perkins