Every Monday afternoon Amber Kovarik and I talk about what happened this week in our local and national real estate market in 15 minutes or less.
Today’s Takeaways:
Communication with your clients is key. Be sure to share what is going on in real estate. The real estate industry is the driving force in our economic recovery. Things are happening quickly, demand is high, inventory is low, prices are increasing. This is a great time to be a seller and get top dollar. It is also a great time to buy with mortgage interest rates at historic lows.
Lending:
Usually, there are about $2.5 trillion in loans being pushed through the pipeline, today it is $10 trillion. Four times more volume than usual!
Mortgages in forbearance declined again for the sixth week in a row. 7.74% of mortgages are in forbearance which is roughly 3.9 million loans. (MBA)
About 1.8 million loans in forbearance are seriously delinquent on their mortgage payments. (KCM)
77% of the past due owners have at least 20% equity and 90% have at least 10% equity. (KCM)
The AZ Market:
Cromford Market Index (CMI): The CMI is the best leading indicator available (balance is 100, above 100 is a seller’s market, below 100 is a buyer’s market, prices rise at 110, and drop at 90). Yesterday it was 312.9 (matching the CMI’s record high from the spring of 2005), higher than the pre-COVID peak of 241, and more than double bottom we hit on May 15 of 145.2. Despite the over 15 point increase in the past week, the increase is slowing, slightly, which is good.
Supply: The available inventory continues to stabilize; it just happens to be at an extremely low level. As of yesterday, our inventory is 62.5% below normal. Active listings excluding under contract accepting backups (UCB) are down 42% year over year and 11% month over month.
Typically, the second half of the year sells less than the first half. Starting in July we tend to see an increase in available listings and that increase remains through November. It is too early to tell if 2020 will fit the pattern.
Demand: Pending sales are up 17% year over year, which is significant given how much lower our inventory is today. Our demand is 17.2% above normal and continues to increase.
Sarah Perkins is an award winning account executive and has been in title sales since 2004. As the Director of Industry Research & Senior Account Executive, Sarah’s role is to bring real estate transactions to Navi Title. Sarah supports her clients by helping them navigate the ever-changing real estate space through thorough research and understanding of current trends impacting today’s home buyers and sellers.
Econ 101 taught us about supply and demand. To measure the health of the real estate market we look at new listings AKA supply, and new pendings AKA demand. When demand out paces supply, prices go up. This has been good news for a lot of sellers over the past several weeks. However, we are moving closer and closer to running out of houses to sell.
According to NAR before the pandemic, our housing supply was short by 5-6 million units. Housing starts are still down by 20% year over year. NAR’s Chief Economist, Dr. Lawrence Yun said, “Significant growth in new home construction, however, is required in the upcoming months and possibly even stretching into the next three years. Consequently, home prices will be pushed higher thereby making ownership opportunities for first-time buyers more difficult. More homes need to be built.” This national chart illustrates our decreasing supply. In Phoenix, our situation is magnified.
The AZ Market:
Cromford Market Index (CMI): The CMI is the best leading indicator available (balance is 100, above 100 is a seller’s market and below 100 is a buyer’s market. Prices rise at 110 and drop at 90). On March 20, the CMI peaked at 241, and yesterday it was at 194, up from the bottom of 145.2 we hit on May 15 and up over 17 points in the past seven days.
Supply: Our local inventory started dropping on May 12 and has continued to decrease every day since. As of yesterday, our inventory is 51.6% below normal. In the past seven days we have dropped just over 2%. New listings are down nearly 33% year over year. Nationally, according to Redfin for the week ending on June 14 new listing median asking price is nearly 12% higher year over year and 2% higher than only last week.
Demand: Pending sales are up 10.7% year over year. Our demand is 6.2% below normal and increased by nearly 5% in the past seven days. According to Showing Time, in AZ, physical requests peaked on February 22 and then immediately dropped by 63% through mid-April. As of Wednesday, we are up nearly 7% from the peak in February and up 5.4% year over year. Inventory continues to struggle to keep up with demand.
Sales & Prices: As of June 10, the median sales price increased 5.7% year over year. I expect this appreciation rate to increase especially given the increase in the median asking price. In the first 10 days of June 23% of the closings, closed over asking. Total closings were down nearly 31% year over year.
Southeast Valley New Listings, Pendings, and Closings: This week over week comparison for Tempe, Mesa, Chandler, Gilbert, Apache Junction, and Queen Creek since March 15 shows this week’s increased demand and decreased supply. Only time will tell if it is pent up demand or actual demand. Based on February’s demand it is likely to be actual. Closings always increase at the end of the month.
Other AZ News:
According to Yardi Matrix, Phoenix is the top western market for multi-family commercial investment. Despite the substantial year over year decline in investment, from $4.9B to $4.2B. This table shows investments from January through April 2020. These top markets represent nearly all of the transaction activity in the region.
Hines, Oaktree scheduled the ground-breaking for next month for their industrial project of building out nearly 1.2 million square feet. The project is located on the Loop 303 corridor.
Many area restaurants and bars are closing again due to COVID-19 which really hurts as we are only just starting to see improvements. This week’s visits to seated diners were down 58.3%, year over year, an improvement over the 64.2% year over year drop the previous week.
New business applications increased last week and are up 16.7% year over year.
Despite a slowing appreciation for single-family rents, Phoenix remains at the top with 6.6% year over year appreciation.
Emerging Trends:
According to the University of Michigan consumer sentiment index, in early June we saw our second month over month gain. May’s job gains moved the index to 78.9 in June versus 72.3 in May and 98.2 a year ago.
Bidding wars increased month over month across the country. Last weekend one listing in Phoenix received 70 offers.
91.2% of economists believe the recovery has already started and real estate is leading the way. These are the same economists that 60 days ago said real estate was dead.
Last week I mentioned the $88,000 economic impact of one new home sale and the $43,000 economic impact of a resale home sale. There are roughly 5 million real estate transactions a year, that pushes $325 billion into our economy.
Commercial real estate continues to work to figure out how to survive. A new “hub and spoke” office model is emerging. Downtown offices will get smaller as companies allow some to work from home and they will expand into smaller spaces in the suburbs, again keeping foot traffic down.
AirBnB, VRBO, and other vacation rental sites are all seeing an increase in traffic and bookings. AirBNB announced year over year growth in bookings from May 17 through June 6.
“Agrihoods” are gaining in popularity and are expected to go from a niche market to a mainstay. These are agricultural-based communities, like Agritopia in Gilbert, AZ.
The International WELL Building Institute created a new rating system that evaluates how a building protects/endangers the occupants against COVID-19. It will be used for nearly all property types including offices, retail, restaurants, schools, and hotels.
According to Redfin, searches for single-family residences are increasing and are at the highest levels in 4 years.
The “Resuburbanization” movement is pushing people further out and to larger homes. McMansions are once again garnering more attention as people are working from home and have multiple generations living there as well.
According to a Realtor.com report released this week, 54% of the largest cities in the country had a 13% increase in listing views in suburban ZIP codes in May, 6% ahead of listings in urban ZIP codes.
According to the National Association of Homebuilders, they are seeing an increase in demand for larger homes and expect this demand will continue over the coming years.
According to a recent Harvard study, wealthier households are spending 17% less than they were in January, while lower-income households are spending only 4% less than they were in January. The study further suggests that the wealthiest 25% of Americans are responsible for 66% of the decline in spending since the beginning of the year.
Other Real Estate News:
According to a recent Gallup poll they found, “Real estate, at 35%, remains the most favored investment for Americans, as has been the case since 2013 when the housing market was on the rebound. More than one-third of Americans have named real estate as the top investment since 2016.”
According to CNBC the job growth in May was the largest single-month increase in jobs since 1939.
Fed will keep interest rates where they are until we are back to full employment, which is a 5% unemployment rate.
According to Tom Ferry, 60% of Realtors have “ghosted” themselves and believe the market is not moving. 45% of that 60% went over 9 weeks without even looking at the MLS.
According to the Real Deal, EasyKnock raised another $20M this week. This start-up, launched in 2016, buys the property and then leases the property back to the owner-turned-tenant allowing access to the earned equity.
The owner of the Mall of America, Canadian Triple Five, a privately owned company is in trouble. They have about $5B in debt on their properties and have missed mortgage payments, according to a Bloomberg report.
New York City has been hit the hardest, they are still down 76% in new listings. In May new lease signings were down 62% year over year but did see an increase over April. The local real estate board is cutting pay and laying off employees due to a decrease in membership dues coming in.
Mortgage purchase applications increased for a 9th straight week, leading to a 75% increase since mid-April, a 20% increase year over year, and putting us at an 11 year high.
There was a slight increase in forbearance requests this week. 8.55% of all residential mortgages are currently in forbearance. According to the Mortgage Banker’s Association’s Chief Economist, Michael Fratantoni, “The level of forbearance requests is still quite low, but there was a noticeable increase in call volume over the course of the week.”
The good news is that nearly 60% of Americans have at least 50% of equity in their homes. The average is $177,000 in equity. With that said only 9% of the homeowners currently in forbearance have 10% or less equity; meaning that it is unlikely we will see a massive wave of foreclosures based on the current level of mortgages in forbearance.
In a joint effort the Consumer Finance Protection Bureau (CFPB), Federal Housing Finance Agency (FHFA) and U.S. Department Housing and Urban Development (HUD) created a website that outlines the housing relief options created by the CARES Act: https://www.consumerfinance.gov/coronavirus/mortgage-and-housing-assistance/
The National Association of Home Builders and Wells Fargo’s Housing Market Index increased by 21 points in May to 58 bringing us back into a positive outlook. The recent report stated, “Inventory is tight, mortgage applications are increasing, interest rates are low and confidence is rising. And buyer traffic more than doubled in one month even as builders report growing online and phone inquiries stemming from the outbreak.”
Housing starts in May were up 4.3% from April but were down 23.2% year over year.
Final Thoughts:
MIT did a study on how news is shared via Twitter. The study stated, “The results were stark. False information was retweeted by more people than the true stuff, and faster to boot. True stories took, on average, six times longer than falsehoods to reach at least 1,500 people. Only about 0.1% of true stories were shared by more than 1,000 people, but 1% of false stories managed between 1,000 and 100,000 shares.” Tom Ferry said, “Flight to quality has never been more important than ever before. Be the knowledge broker.” It is up to you to share accurate information.
If you have buyers and sellers on the fence, the time to act is now. With the low inventory, sellers are competing against fewer listings. With prices rising and low rates, now is a great time to buy. There is no guarantee that any of this will remain in the future.
Sarah Perkins is an award winning account executive and has been in title sales since 2004. As the Director of Industry Research & Senior Account Executive, Sarah’s role is to bring real estate transactions to Navi Title. Sarah supports her clients by helping them navigate the ever-changing real estate space through thorough research and understanding of current trends impacting today’s home buyers and sellers.
https://exitnest.com/ offers transparency to sellers. Is connected to iBuyers and walks the seller/Realtor through offer submission. Provides real numbers in side by side layout. Often pushes sellers back to the Realtor. Request a snapshot for all your listing presentations.
Right now Opendoor is winning the iBuyer game. Their goal is to get to 7% profit, but are currently not profitable
All work within a similar buy-box. Offerpad has the most flexible buy-box
The following slide does not include BINSR items and seller paid repairs
This is for Q2 2019, Phoenix metro area
Offerpad, Opendoor, Knock offer referral fees to Realtors, Zillow does not.
He points out the only profitable public real estate companies are RE/MAX and Realogy
“Red is the new black.”
Venture Capital Money in Real Estate:
Residential real estate is 13% of the US GDP
$66B in commissions are earned each year
FINTECH (financial tech) and PROPTECH (property tech)
$12,200,000,000 invested in 2018 in real estate tech
$2.2B in 2011
$12.6B invested in the first half of 2019
Broker Tech (main place for VC funding)
CRMs and productivity systems
automating the transaction = a huge market opportunity
End to end platform includes?
search listings to work with Realtor
home viewing to financing to close & title
signing
recording
and more
Who is working on this?
Realogy (zap end to end platform)
RE/MAX (booj end to end platform) booj: be original or jealous
KW (command end to end platform)
end to end platforms are not one size fits all
Newcomers:
Homie (FSBO help, cheap)
Reali (low fee, uses tech)
Reasi (built on blockchain, uses smart contracts, handles transactions electronically without escrow)
Compass
Claims to be a tech company but operates like a traditional brokerage
now valued at $6.4B, more than Zillow
Showing massive valuation increase due to “hockey stick” growth
Has spent $300M on purchasing brokerages and recruiting agents
they are spending on average of $200,000 per agent
using newly acquired Realtor’s stats to show growth in market share
Compass is valued as a tech company, but is it?
Roadblocks for big tech during expansion across the country
data access & congruence (biggest hindrance for these companies)
state laws and regulations (title vs title/escrow states/dual agency)
multiple vendors (security issues)
complexity of deals
Many MLSs cost more than ARMLS and they aren’t as big so companies love coming here.
we are a lot further away from this working because there are so many moving parts
Vertical Integration:
employees
they have to build to make money across platforms
W2 employees to incentivize them to use internal companies: mortgage/title
tech is integrating with own companies
Last 15 years (without vertical integration) big tech had $2-3B in revenue, with a $10B market cap
Next 15 years:
adding Mortgage origination $17B revenue
Title $16B revenue
leading to big opportunity $100B in market cap
What will we be talking about in 2020? Adam Contos, CEO of RE/MAX: “I think in 2020 we will find out what end to end platforms really means.”
End to End Platform:
Law in AZ is changing on 1/20/20 allowing documents to be notarized via streaming video camera
end to end platforms are being forced
what is the min viable product? it will come out in the next couple of years
we are in a waiting game. we can use tech but get too distracted by it. watching to see what is the best option? we need to see other experiences
Amazon referral partnership with Realogy. Amazon will likely not go into real estate, it’s too complicated
New brokerage models:
Rex: Real Estate Exchange, 2% only to company, does not pay co-broke. they do lots of marketing, they do not put listings on MLS
Knock.com: buy/sell same day. Cash offer with no contingency. knock pays for the buyer to move the house. Knock owns the new house, moves the sellers out, clean up the house. Owner old house and new house sell on the same day. includes all of the challenges of pre & post possession. (VC companies do not understand pre & post possession) lease backs and the 6% fee
all these companies care about is the consumer feels they want simple.
“if you cannot explain it simply then you don’t understand it” Einstein
these companies want to be simple and sell it.
old school Realtors made the transaction seem complicated to maintain the consumer’s reliance. Realtors have to change the marketing to show the simplicity
remember these companies do not need to make money, VC funding is funny money.
It took Zillow 12 years to cover their own costs, it took that time to get the eyeballs.
they want the mindshare, once they have it, they can sell it. must hit critical mass in order to sell
Homie
Purplebricks (left the Australian market in May 2019 and the US market in July 2019)
Side: brand new, new funding. all goes back to marketing. brokerage paid advertising as a white label technology solution. brokerage behind the scenes. they have a robust tech platform that is great for big teams, teams plugin and go with it. only in NYC
Roosted, https://roosted.io/, referral based model, for people who don’t sell houses
Vacation Homes #2 for all of VC spending
5.5-6M properties sell every year in the year
1.8M are investment properties
about 700K are used as short term rentals
that is about $7-$8M in commissions, every year
Scottsdale is the best place to buy a vacation rental. most expensive is $6,000 a night because of the experience
occupancy rate is 81% in our area
average daily rate in AZ is $301 a night (info from airDNA)
HOA can legally tell you what to do, city and state cannot regulate. there are new rules coming that allow flexibility. Many HOAs require at least 30 day rentals. Allowed to have houseguests, owner can live in one bedroom and rent out the rest of the house
about 20% of realtors have sold vacation rentals, it is a niche market
in order to thrive in this niche market, agents need:
show value in the transfer of business assets
valuations on vacation rentals/how income impacts sales price
landlords vs host mindset/options for owner-hosts who don’t live here. hospitality industry
business opportunity for Realtors. Have a host mindset and manage the AirBNB. Garner good reviews, all about educating owners/buyers
Judy Lowe said that if you manage an airbnb you have to have a real estate license
Emerging Companies:
Vacasa (www.vacasa.com): manages 14K rentals across the country. buy a bigger house and rent one bedroom, for 2 years. they keep the income. did well enough to buy their own properties, managing and owning
AirDNA (www.airdna.co): provides investor data for vacation rentals from AirBNB
Vrolio (https://www.vrolio.com/): vacation rental real estate marketplace. offers investor snapshot of portfolios in 1 minute. provides investor leads, place to buy and sell rental properties
Pillow (https://www.pillow.com/): added income for residents. housing more transient. (good for NYC) long term rentals and not actually subletting. building manager can allow unit visitors to stay in an house while renter is out of town
Swimply (https://www.swimply.com/), this company allows you to rent your pool out. pool party host, people traveling, people who want to relax by a pool. This is so new, they have no idea if it is legal or not.
Over the past 6 years people are moving way more often. Evidence shows people would move even more often if it were not such a hassle to do so. AI, Chatbots, Automation
Nurture your database and have better conversations with your clients, all about relationships
61% of conversations with clients is on the chat on websites (for bots)
Automation Tools:
Eva Bot, https://www.evabot.ai/, highly recognized at Inman. closing gifts, talks to them finds out what clients like and orders it and takes care of everything
Botsify, https://botsify.com/, teach it how to interact with clients. at any point you can come in and have conversation
Disclosures, https://disclosures.io/, helps with the disclosures required for each property. air pollution, traffic noise. packages the disclosure package and share the info. homes sell faster when the disclosures are provided up front. disclosing early is good. can email to other agent
Call Action, https://callaction.co/, ($200 monthly) great solution if you can’t answer the phone. routes the caller through a workflow, lots of different numbers
Bytegain, https://bytegain.com/: predictive analytics/AI plugin for home searches. watches search behavior. integrates with website, learning consumer behavior. figures out who is most likely to transact in the next 3 months
Shyft Moving, https://shyftmoving.com/: app. take a picture of room and creates quotes for moving services. allows you to hire what you need
KeyMe, https://www.key.me/: been around for a while but is making a comeback, app on phone to save key info. kiosks in Phoenix available, instant keys
Dash CMA, https://dashcma.com/: with a heatmap, lines up comps, very visual to see pricing, $20 monthly
What will we be talking about in 2020? Glenn Sanford, CEO of eXp Realty: “Blockchain.” Blockchain: “a safer place to store real estate transactional data”
it is millions and millions of independent computers all getting the same info.
cryptocurrency (anyone can verify transaction)
tokens (piece of code cannot be changed. cannot be hacked) title insurance, verifying ownership
company is creating tokens for every single residential property. currently already has done it for all vacant lots in the US
smart contracts (reasi) walk through steps and meets conditions. if this then that. stuff doesn’t happen unless requirements are all met
using smart contracts, once all terms are met, money is released. we as consumers are not comfortable with this yet.
this will change a lot of things about our culture, community, world, but we are nervous about it.
Propy, www.propy.com: handles financial transactions. Good for luxury, helps with marketing, global advertising
Commission Transparency
Bombshell Lawsuit: Realogy, KW, RE/MAX, NAR, ARMLS and others are being sued. alleging anti-trust laws were broken, steering based on co-broke offered
asks why seller pays for the buyer agent commission? seller is paying for own representation
Corelogic, FBS & other MLS data providers allows searches by co-broke offered.
Co-broke effects average days on market
home sits longer on the market when offered 2.5% co-broke vs 3%
lawsuit is scary because we know the evidence is damning
Federal government doesn’t want to destroy 13% of GDP, they may require more data sharing
commission amounts disclosures
closed properties info
who paid what and how much will be shown
Northwest MLS are now publishing co-broke and publicly
iBuyer is 6% of our market, putting pressure on commissions
Consumers are demanding more transparency, agents can show their strengths
lawsuits in CA for 1099 vs W2
Realogy suing Compass for unethical recruiting practices
Nerdy Stuff
Restb, https://restb.ai/: sees home features and creates tags. takes 3 seconds using AI. Realscout is using this system. search very specific options without the fields in the MLS
MLS are moving from RETS to web API, rets is a download and send, web API is immediate, means info will be shared faster
Streetwire, https://www.streetwire.net/: heavily invested in blockchain. already tokenized vacant land, “real estate data owned by the data creator.” $1300 monthly paid to ARMLS to share the data provided. long way down the road, ownership in the hands of the people
Sarah Perkins is an award winning account executive and has been in title sales since 2004. As the Director of Industry Research & Senior Account Executive, Sarah’s role is to bring real estate transactions to Navi Title. Sarah supports her clients by helping them navigate the ever-changing real estate space through thorough research and understanding of current trends impacting today’s home buyers and sellers.
Tina Tamboer, with the Cromford Report, recently presented on the residential real estate market in the Phoenix metro area. To subscribe to the Cromford Report, click here: http://cromfordreport.com/join-armls.html. The complete presentation is available to subscribers. Here are my notes: Forget everything that Tina said at the beginning of 2019, even forget what she said last quarter. Everything is different. Again. Cromford Market Index (CMI):
100 is balanced, above 100 is a seller’s market, under 100 is a buyer’s market
Cromford Market Index 184.2 (strong seller’s market)
Supply 57.2 and dropping
Demand index 105.3
Every week the CMI has increased significantly
we are higher than we were last year
CMI hasn’t been this high since 2004
Currently tracking 2004 demand
From February through June of 2019, we went from the weakest seller’s market in 5 years to the strongest seller’s market in 14 years! This happened in a span of 5 months (long term chart)!! 2005 PTSD?
Despite the numbers tracking close to 2005, our market today is very different than in 2005
We have real demand today
2005 was false demand
we have today something we didn’t have in 2005, skepticism. We are not there now
We are not in bubble range but are watching it closely
Supply & Demand
When supply and demand move together, everything is great
When they move together above CMI of 100, there are lots of listings, lots of sales
When supply and demand move apart, things go crazy, everything becomes unstable
February 2019 supply and demand broke up, despite expectations of a flat, calm, easy market
2004 saw higher transaction volume than today due to our low inventory
Prices will continue to rise as long as supply and demand move apart
Prices are expected to continue to rise through 2019 and into 2020
Appreciation
We are not in a bubble but we are a bit high for regular appreciation
We moved above the regular appreciation level at the beginning of 2019
Properties asking $150-225K have the highest appreciation rate
Properties asking over $500K, 1-3% appreciation rate (balanced market, equals rate of inflation)
Properties asking $225-500K, 3-5% appreciation rate (above rate of inflation, seller’s market but not huge gains)
Properties asking $150-225K, 6-10% appreciation rate (lots of fix and flip investors, area with the most appreciation)
Properties asking under $150K, 2-5% appreciation rate
first half of 2019 was tracking behind 2018 for amount in escrow
turned in February, we are now tracking above 2018
tracking volume of 2017 but with higher price points
seasonally between May and December, we have a 30% drop of quantity of properties in escrow
best time to buy is the 2nd half of the year, the very best is the 4th quarter, buyers do not give up on the market, this is true for all price points
What Effects demand?
interest rates
2011-2014, 45% of purchases were for cash
mortgage rates have dropped, again
when rates went up slightly in March, buyers got off the fence. People thought rates hit the bottom.
appreciation/depreciation (affordability)
affordability index tracks affordability with the changes in wages
recent wage increases have put Phoenix back to being affordable
2004 we were affordable, 2005 with a 45% increase we were no longer affordable
relocation (inbound)
employment/income
2.2M people employed, largest it has ever been
Phoenix job growth is outpacing the rest of the country, by increasing 2-3%, nationally it is around 1%
3 continuous months of wage increases (April, May, June)
people will rent when it makes more financial sense to do so
2018 prices are up 8.1%, so far in 2019 prices are up 6.5%
people are thinking it is easier for them to rent
cost of sfr rent has increased 7.1%/ patio homes rent increased 7.8%
median rental $1700 monthly for 1802 square feet
Tina used the Zillow calculations to estimate equity over 5 years (60 months)
Using the median sales price of $288,000 for a 1805 square foot single family residence, here is the calculator: https://www.zillow.com/mortgage-calculator/ (schedule from Zillow, click full report, go to month 60)
If purchased for $246,452; after 5 years with no appreciation owners now have $41,500 in equity
Based on the current rate of inflation, with 5 years of payments adds $71,500 in equity
2005 purchase prices increased, rent prices did not, sign of false demand
Today rents and purchase prices are rising, sign of true demand
consumer sentiment (how you feel about the market, which could trump everything else)
we are at historically low rates and everyone is getting raises
consumer sentiment is going up when people get raises
now people have moreconfidence and feel better about buying
Fix & Flips
Biggest gains ($60,000 or 60% margins) in areas with cheap houses with up and coming employment centers
Luxury flippers are making up to 60% in Scottsdale on houses over $500,000
Headlines define flips as: a property purchased and sold within 2 years
2013 was the biggest year for flippers
Flippers love sellers markets and retreat in balanced or buyers markets
iBuyers are doing most of their business between $200K-$250K
iBuyer purchases are considered a FSBO, which is $127 per square foot for $200K-$250K
iBuyer sells, on average, 7% more than the contract price. average on mls sales 9% increase between $200K-$250K
What Effects Supply?
new home construction
appreciation/depreciation (equity)
foreclosures
relocation (outbound)
divorce/illness/death/job losses/tragedy
cost to renovate vs move up
consumer sentiment (feeling)
Supply
2019 brand new listings June-July 10.7% lower than in 2018. This is the first time this has happened since 2001
we had roughly half the number of employed people and half the number of houses in 2001
people don’t want to move
when we have sellers turning and buying again, then it is a wash on supply
2010 lots of outbound relocation, loss of employment
2014 was the year for Canadian buyers due to beneficial exchange rates
supply is plummeting, we are down 10.9% in supply, southeast valley 9.7% down inventory
new home construction eases up options but not a lot
properties over $2M inventory is up over 13%
Prices
SE valley average sold price is between $100-400K
South Tempe is the only place in the SE Valley with an average over $500K
seller asking price is up 6.8% from year over year
Pendings are up 12% through July year over year
SE valley pendings are up 16% year over year
decline in offering closing costs
Q3 2015 27.9% of closings included seller concessions
today it is way lower
30-40% of sales $150-250K have some sort of closing costs
24-28% of those houses are selling over asking (making up the concessions paid)
outskirts of town sellers can negotiate more
Tina suggests checking out renovation loans
19% sold over list price July 2019
correlates with June 2004
in May 2005 it was 38%
Short Term Rentals
Are today’s false demand
AZ recently adjusted the regulation to not regulate. now you get a tax id.
PV & Sedona started the regulation movement
#1 risk of airbnb: everything is wonderful all the time
#2. we don’t know if this is the beginning of regulation. will taxes go up?
Final Thoughts
interest rates dropped and everyone got a raise
Our market is still considered affordable
there is no end in sight for this seller’s market
prices have not come down and they are not projected to come down anytime soon. definitely not this year.
Next predicted recession is in 2020, will it effect real estate?
first thing to drop is tourism during a recession, will make an impact on Airbnb
10% drop is the new definition of a crash. Always ask how a “market crash” is defined when people talk about a crash. Many of us think of the 50-60% days.
Sarah Perkins is an award winning account executive and has been in title sales since 2004. As the Director of Industry Research & Senior Account Executive, Sarah’s role is to bring real estate transactions to Navi Title. Sarah supports her clients by helping them navigate the ever-changing real estate space through thorough research and understanding of current trends impacting today’s home buyers and sellers.
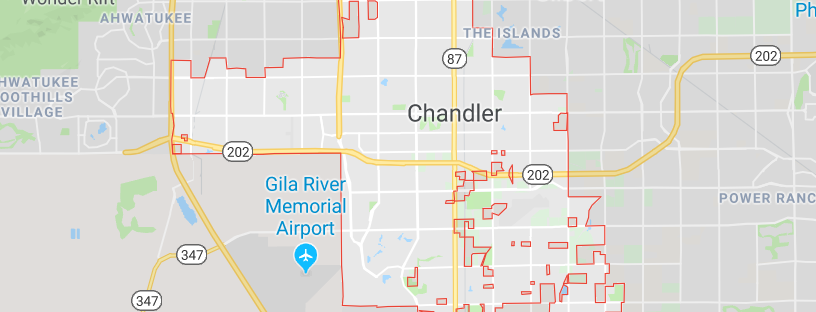
Fiscal Responsibility: AAA rating. lowest cost per service.
Water preservation & conservation: 100 years of water, they have made lots of arrangements. they do this for each project they do. They get it from the ground water from Gila reservation
Transportation
Infrastructure
Safe neighborhoods
Responsible development
Chandler Police Chief just won Police Chief of the year for entire USA
2018 lowest crime rate since 1986
National awards
AAA bond ratings which helps get loans without having to raise taxes.
Huge population growth
Fewer multifamily projects in 2019 than 2018 Increased single family projects in 2019 Majority of growth is in southeast Chandler
Housing
106,688 total housing units
73.5% single family homes
26.5% multi-family homes
141 new houses added a month, on average
K-12 Education
Chandler Unified School District (CUSD) just won #1 school district in AZ (niche.com) vision 2030 is to be the #1 school district in USA voters approve school spending nearly 100% of the time
Currently modernizing Chandler Municipal airport, moving towards jets to accommodate business travelers and making it quieter. The hobby prop planes are louder.
Employment
economic development is all about bringing in more bodies
Existing employers
New businesses
New Banner hospital coming soon to 202 and Alma School
working to build a bigger variety of employment, not just semiconductors
Recently won best economic development department in AZ
Mica Miranda, head of the department, travels to businesses across the country to recruit to Chandler
Chandler is competing with Dallas, Tampa, Austin for businesses
By bringing in more businesses and jobs, taxes are subsidized so increases are not needed to support growing population
Price Corridor job creation zone Airport job creation zone
Commercial building fill rate/vacancy rate (page 17)
office 14% flex 7% industrial 5% retail all time low
Downtown Updates
Tons of building, different feel from downtown Gilbert
Higher end for older community (average age in Chandler is 35 vs Gilbert’s 30)
Investment for both day and night activity, businesses and entertainment”
it will be a little less Gilbert and a little more Kierlandy”8 story height restriction
Sarah Perkins is an award winning account executive and has been in title sales since 2004. As the Director of Industry Research & Senior Account Executive, Sarah’s role is to bring real estate transactions to Navi Title. Sarah supports her clients by helping them navigate the ever-changing real estate space through thorough research and understanding of current trends impacting today’s home buyers and sellers.
#1 topic: Compass. A traditional brokerage spending huge amounts of money to advertise that they are a tech company. Goal is to have 20% market share in the top 20 metros nationwide by 2020. They are buying brokerages. Expect to see them in AZ by 2019.
#3 topic: Phoenix: all eyes are on us to see how our local industry responds to the marketplace shifts, emerging models, and iBuyers
Non-Real Estate Emerging Trends:
Privacy:
voice activation and identity verification
Data:
Who owns your data? How is it used? How can we protect it?
*Let me know if you
would like the steps to download the data Facebook has on you.
Uber
& AirBNB are not just platforms anymore. Uber is buying taxis and
AirBNB is buying houses and small hotels
Where We Were:
Buyers
agents emerged in the late 80s
2005/2006
Zillow asks NAR to share data
Realtors
moved from sales to customer service=Realtors help buyers buy homes not
find homes
*Let me know if you
would like the charts Amanda showed in class
Emerging Models:
Model
#1: Tech or templated. Online discount brokerage, call center, selling
through an app, limited support, W2 employees. Example: Homie
Model
#2: Hybrid: great technology and traditional agents, specific services
provided, lower costs, either 1099 or W2. Example: Redfin and Purplebricks
Model
#3: Traditional: high volume, high value, high cost, must include clear
value
Homesnap,
https://www.homesnap.com/pro
direct ARMLS & Showingtime integration. Client search and messaging
capabilities. Free.
Unison,
https://www.unison.com/, provides 1/2 of down payment, never paid back, owners
share ½ of the equity when property sells within 30 years. no limits.
Loftium,
https://www.loftium.com/, provides
funds for down payment, requires for first 2 years one room is rented on
Airbnb. They run their own data to figure out how much they will put down.
Propy,
https://propy.com/, Sell properties
through Blockchain (step by step logical process that executes a contract)
Propy handles the exchange and provide the seller in USD. Good for global
buyers. Agents does sales call with Propy to post listing. Charge for
currency conversion incurred by buyer.
Kleard,
https://www.kleard.com/, open house
sign-in that requires dual verification for everyone
*Let me know if you are
interested in our Lawyers Title discount to save 10%.
Revaluate,
https://revaluate.com/, similar to
First, scores on how likely your database is to move
All-In-One
Systems:
Evabot,
https://www.evabot.ai/,
conversational artificial intelligence that chats with consumer and
figures out gifts for closing. very conversational, all through text
Brivity,
https://www.brivity.com/, all in
one platform, integrates with ARMLS, Zipforms, Skyslope, CRM. starts at
$199 monthly
Realsynch,
https://www.realsynch.com/,
integrates as much as possible but not everything. it is useful while we
wait for a lower cost option
Boxbrownie,
https://www.boxbrownie.com/,
virtual staging ($32) and photo editing, item removal ($4), best virtual
staging. turn daytime photos to dusk photos $28. also do floorplans and 3D
plans
Proxypics,
https://proxypics.com/, stock photo
specific to location. photographers compete
Restb,
https://restb.ai/, looks at photos and is
able to decipher what is in the photos. Zillow is using this info for
their Zestimate to make the info more accurate. Allows people to search
based on what is in the photos. available to build integration through
website.
Gabbi,
https://www.gabbi.ai/, new robot,
currently beta testing. integrates with MLS and Showingtime and texts
answers. conversational messages. Everything is visible to you at all
times
Voice
Automation:
VoiceterPro,
https://www.voiceterpro.com/,
shares your skill on Alexa, downloadable through Amazon apps. Partnering
with restb.ai to use for searches, $349 monthly
Boomerang,
https://www.boomerangapp.com/,
use to email from phone. selects emails to respond to first. speed of
voice automation
Augmented
Reality:
Hutch,
https://www.hutch.com/, when showing
vacant homes select the type of room and style, place furniture to see how
they would look in the room. completely free. they make money by selling
products. Zillow has invested in this system.
Virtual
Reality:
Ogulu,
https://www.ogulo.com/, (Matterport
competitor) walk through the property. click on call out buttons and you
can label things. automatic floorplan. includes lead capture. Can be done
with a Ricoh Theta S
Zavvie,
https://zavvie.com/, hyper local
marketing company, neighborhood website, blog, Nextdoor, mailers, etc,
uses big data and scores likelihood of moving
Promo,
https://slide.ly/promo, make a short
video to use for online advertising. put on any advertisement.
Sarah Perkins is an award winning account executive and has been in title sales since 2004. As the Director of Industry Research & Senior Account Executive, Sarah’s role is to bring real estate transactions to Navi Title. Sarah supports her clients by helping them navigate the ever-changing real estate space through thorough research and understanding of current trends impacting today’s home buyers and sellers.