The relationship between supply and demand establishes pricing whether it is for toothpaste, a mani/pedi, Bitcoin, or a house. Demand moves based on consumer sentiment. This is true for Wall Street and Main Street and that is the extent of the similarities between the two.
Earnings:
Aside from Zillow’s, many of the Q3 2021 earnings calls were filled with optimism. There were clear winners like eXp and Fathom who both experienced massive growth. There were also companies pleased at losing less than in previous quarters. Redfin’s total revenue was up 128% year over year and its net loss improved from $34.2 million in Q3 2020 to only losing $18.9 million in Q3 2021.
Redfin’s iBuying revenue was up 1,000%. While Redfin is the country’s fourth largest iBuyer, CEO Glenn Kelman said iBuying is only part of what they do but is not the company’s primary focus. He went on to say that iBuying isn’t going away, despite Zillow’s challenges, nor will it be a huge part of the market, forecasting that iBuying will likely max out at about 10% of the market.
iBuying is not dead but it is still not profitable. It broke Zillow, who after $1 billion in losses in 3.5 years, expects to lose another $250 million in Q4 2021. Opendoor increased revenue by 91% to $2.3 billion from Q2 to Q3 2021 and decreased its losses from $144 million to $57 million over the same time frame. At $540.3 million, Offerpad’s revenue increased by 185% year over year, but still sustained a net loss of $15.3 million.
Other winners include 18 publicly traded homebuilders who successfully doubled their market caps since March 2020. Hovnanian Enterprises had the greatest market cap increase at 1,207%. The nation’s largest home builder, D.R. Horton had an increase of 176%. Despite the labor and supply chain shortages, homebuilders are turning substantial profits.
National Real Estate:
Demand is increasing, which is seasonally unusual. The rising interest rates and super high rents are possible culprits. Homes continue to sell quickly (in about 42 days on market, up from 21 in May, but well below the normal 70 expected this time of year) and with multiple offers, though declining. Single family year over year appreciation is high but slowing from 22.9% in Q2 2021 to 16% in Q3 2021.
“Home prices are continuing to move upward, but the rate at which they ascended slowed in the third quarter. I expect more homes to hit the market as early as next year, and that additional inventory, combined with higher mortgage rates, should markedly reduce the speed of price increases.”
-Dr. Lawrence Yun, NAR’s chief economist
The AZ Market:
Buyer demand is increasing, why? Zillow pulled out and yet demand is over 22% above normal. Inventory remains persistently low at 65% below normal. The iBuyer frenzy has settled down. The best thing for our market is to have a lot of owner occupied buyers. 18 months ago, 93% of buyers were owner occupied and in September it was only 74%.
BeachesMLS in Southeast Florida recently joined MLS Aligned as it gears up to release Aligned Showings, a new showing service. Created in 2018, MLS Aligned is a joint venture founded by ARMLS, Metro MLS in Wisconsin, MLSListings in Silicon Valley, RMLS in Oregon, and UtahRealEstate.com.
ARMLS policy states that a product vendor cannot also be a member, which means that ShowingTime (owned by Zillow, an ARMLS member) will not be able to extend its contract into 2022.
Scottsdale came in at number four for cities that have increased the most by both actual dollars and in percentage growth. In September 2019 the median sales price for a Scottsdale home was $477,000. By August of 2021 it was $715,000. Nearly a 50% increase!
According to a city analysis from 2020, Phoenix is short 163,067 housing units. Combine that with Phoenix’s average retail space per capita is 40.5 square feet, compared to 28 square feet nationwide, and city officials are creating a plan to convert vacant retail spaces into apartments and condos.
Real Estate News:
For 10 months, from October 2020 to August 2021, Fannie Mae and Freddie Mac applied the adverse market fee to refinances and collected nearly $5.3 billion, covering nearly 70% of the GSE’s Covid relief programs.
Pretium Partners has agreed to acquire 2,000 of Zillow’s homes to add to its portfolio of 70,000 single family rentals throughout the country. Zillow still has about 18,000 homes to sell before it can fully shut down its iBuying segment.
Created for long term sphere marketing, Navigate by Cryano is a conversation analysis tool that uses communication styles from Gmail and Zoom to develop follow up strategies for Realtors.
While the residential real estate market changes slowly, it has never before moved this quickly. Change is unnerving but not always bad. Remember, it was housing that pulled us out of the shortest recession in history.
If the COVID-19 crisis didn’t happen, we would still enjoy the most prolonged economic and job expansion in history. But the pandemic did happen, and we are more vital for having weathered that horrific storm. We now continue this journey together in this new expansion. Economic cycles come and go: My job is to guide you through this process and show you that boring economic models work. They may not be sexy, but they can be precious when you have a good one tested through time. Trust the data and keep moving forward.
Sarah Perkins is an award winning account executive and has been in title sales since 2004. As the Director of Industry Research & Senior Account Executive, Sarah’s role is to bring real estate transactions to Navi Title. Sarah supports her clients by helping them navigate the ever-changing real estate space through thorough research and understanding of current trends impacting today’s home buyers and sellers.
While the company that we love to hate is struggling, we are all left on the sidelines guessing what will happen next. This is not the end of iBuying, nor is it the end of Zillow, and this certainly does not mean the market is crashing (the price reductions are only bringing the asking price down to market value). It may mean that Wall Street investors decided profitability is important and it is time to stop buying high and selling low.
Zillow:
Zillow’s CEO, Rich Barton, described Tuesday as “a tough day at Zillow” following his announcement on Zillow’s earnings call that Zillow Offers is shutting down and they are laying off 25% of their workforce. After 3.5 years and $1 billion in losses, they have had enough. Barton’s comments state, “We’ve determined the unpredictability in forecasting home prices far exceeds what we anticipated…and would result in too many earnings and balance-sheet volatility.” This does not create confidence in the Zestimate, which was supposedly the foundation of their offers. It will take several months for Zillow to sell the giant inventory of homes it amassed in Q3.
60% of Zillow’s operating revenue and expenses are allotted for iBuying. The company currently owns 9800 homes and has another 8200 under contract to purchase, a total of 20,000. The company expects to lose 5%-7% on these properties. It is also currently looking for an institutional investor to purchase about 7,000 properties for $2.8 billion.
Here in Greater Phoenix, Zillow’s active listings are asking a median of $29,000 less than what they paid for the property. Zillow’s median buy-to-sale premium for October was a loss of $9,000 per home. (Opendoor’s was a loss of $2,400 and Offerpad actually made $6,400 per home) For more information on Zillow’s pricing struggles, check out Mike DelPrete’s recent article, here.
68% of its $1.73 billion in revenue came from Zillow Offers and yet the company still ended Q3 with $328 million in losses. Zillow’s shares have dropped nearly 20% in only a matter of days. And despite the drop, it still has a market cap of over $20 billion.
What is next for Zillow? Barton noted the recent $500 million ShowingTime acquisition as well as the 220 million unique monthly visitors and hinted at pivoting to being an “asset-light” company. I could see Zillow moving into power buying, like Knock.com and Orchard, rather than carrying the expense of real property. It would also take Zillow back to its roots, focusing on buyers.
After increasing by 8% in August, pending home sales declined by 2.3% in September. Locally we saw a slight dip in demand in August and September and oddly enough, demand is actually increasing right now. This is unusual given the timing, Q4 tends to see demand decline, and the recent news of a major buyer leaving the market as well.
“Contract transactions slowed a bit in September and are showing signs of a calmer home price trend, as the market is running comfortably ahead of pre-pandemic activity. It’s worth noting that there will be less inventory until the end of the year compared to the summer months, which happens nearly every year.”
-Dr. Lawrence Yun, NAR’s Chief Economist
Last year investors accounted for 11.5% of purchases, so far in 2021 that number has increased to 15% of all properties. In Arizona it is 21%. And 50% of the investor purchases were made with cash. Will this number change without Zillow’s purchases?
Real Estate News:
The Federal Reserve announced that it would begin tapering its monthly bond ($80B) and MBS ($40B) purchases this month. This news came as no surprise and rates did not jump as the announcement was made. This is the tentative tapering schedule with the goal of completion by June. Rates are expected to continue to rise slowly. Fannie Mae predicts we will be at 3.4% interest rates by the end of 2022 and the MBA predicts it will be up to 4%.
The Villa Aurora in Rome is the world’s most expensive listing with an asking price of $547 million. This 30,000 square foot estate includes the only mural painted by Caravaggio around 1597.
Final Thoughts:
After years of iBuying and a third quarter of purchasing over 9300 homes, Zillow pulling out of the market has caused quite a stir. Upon reflection, this is healthier for our market in the long run. While sellers were able to benefit from way above market offers, it is unhealthy for the market. Artificially inflating the market ultimately benefits very, very few. The market is going to do what the market is going to do and we just have to be prepared for whatever is thrown at us.
Sarah Perkins is an award winning account executive and has been in title sales since 2004. As the Director of Industry Research & Senior Account Executive, Sarah’s role is to bring real estate transactions to Navi Title. Sarah supports her clients by helping them navigate the ever-changing real estate space through thorough research and understanding of current trends impacting today’s home buyers and sellers.
Could it really be possible that we are overbuilding? But what about the extreme undersupply of housing stock? NAR said we have a national deficit of over 5 million units. Economist, Dr. Peter Linneman says have a 2-3 million unit shortage. Wall Street housing analyst, Ivy Zelman says the deficit is less than one million units. These are all credible sources so how do we make sense of this? Perspective is key, different data tells different stories.
Completed Housing Units:
Looking at the past five decades of homebuilding it is easy to conclude that building fell way behind in the last 10 years. As long as the population grows at the historic rates, consistent building is necessary to keep up and to replace the roughly one million homes lost each year due to condemnation, natural disaster, or fire.
Population Growth:
What if the population growth is not keeping up? According to the 2020 census, over the past 10 years, the US population increased by 22.7 million to 331.4 million. That is a 7.4% increase, lower than the 9.7% increase the previous decade and the lowest growth rate since the 1930s.
A challenge to a rising population is a declining birth rate. From 2007 to 2019 the birth rate decline was 1-2% a year. In 2020 the birth rate declined by 4%.
A household is one or more people living together (do not have to be related). If two people move into their own places while the third person remains, two households were created. Combining unsustainable home price appreciation and a declining household formation rate, the market will continue to moderate. Affordability matters.
Household formation is declining quickly, and population growth has stagnated. This will challenge what we know about how we use housing. Household formation has been falling for decades. With this rate of decline, using historic data is not beneficial, rather looking at the most current trends is what is more important. There is no benefit to building homes for a population that has enough homes.
Why is it declining? Urbanization. Populations are moving away from the country, suburban and urban areas are seeing the most population growth. Over 50% of the country’s counties had population decline over the past 10 years. Urban families tend to have fewer kids, more education, and live at home longer (later to get married and have kids).
The impact of overbuilding based on household formation will not be seen for many years.
National Real Estate:
Existing home sales increased 7% in September month over month, after a 2% decline in August. At this rate, 2021 will likely have the second-highest sales rate in history, behind 2005.
Appreciation is rapidly slowing. It has slowed from a year over year increase of 23.6% in May, to 23.4% in June, to 17.8% in July, to 14.9% in August, and now 13.3% in September. It is this speedy deceleration that likely caused the iBuyer challenges leading to Zillow’s pause on home purchases through the end of the year. Zillow, and to a lesser extent Opendoor, continued making offers as though the market was appreciating at this springs’ levels. An example is a Fountain Hills property which Zillow purchased for $566,000. Last week the asking price declined from $522,000 to $509,000. For more details on this “catastrophic failure on pricing” check out Mike DelPrete’s recent analysis (I helped him gather data), here.
There has been a small spike in property re-lists (properties that either canceled or removed to reset days) which is now 1.7% compared to last year’s 1.5%. We usually decline from now through the holidays and then a spike right after the holidays. In 2007 it was like 25% of the market. A climbing relist rate is a sign of a weakening market.
Goldman Sachs, not known for its residential real estate expertise, projects that housing will appreciate by 16% in 2022, much higher than many projections, and is a definite outlier. At 11%, Zillow’s most recent forecast is the closest to Goldman Sachs. CoreLogic forecasts only a 2.2% jump in U.S. home prices. Freddie Mac and John Burns Real Estate Consulting are forecasting home price growth of 5.3% and 4%, respectively. See chart below from Keeping Current Matters with the forecasts from MBA, Fannie Mae, and NAR. I expect that in 2022 we will have a 6-10% rate of appreciation locally.
The AZ Market:
Last week we had Tina Tamboer with the Cromford Report do a deep dive on the Greater Phoenix real estate market. Click here to see my notes from her presentation.
New Construction:
The new home market has stabilized and aside from its chronic labor and supply chain struggles is doing well. There is a 5.7 month inventory, at 6.5 months of inventory builders pull back, which is not the case today.
Despite single family permits declining in Greater Phoenix month over month in August, they are still up 27% year over year.
Nationwide there are currently 701,000 multifamily units under construction, the largest amount since July 1974, nearly 50 years ago!
New home sales increased by 14% in September month over month while remaining 17.6% below September 2020 new home sales. The median sales price reached a new record at $408,800 in September.
Real Estate News:
In New York City, CoStar launched platform that is in direct competition with Zillow’s platform, StreetEasy. StreetEasy currently has no competition and charges agents to post listings. CoStar’s product, CitySnap, does not charge to post. NYC agents are excited. It begs the question, is it too late in the game to create a meaningful competitor for Zillow?
The CFPB is hiring 20-30 more enforcement attorneys as it ramps up in enforcement. Under the Obama administration the CFPB had a lot of freedom and fined companies more than $11 billion. Under the Trump administration a lot of its power was reduced and the fines totaled about $1.5 billion. Now, under the Biden administration much of its original power from the Obama administration has been reinstated. The CFPB is tasked with enforcing lending laws and RESPA.
Next month at the NAR Conference in San Diego the board will discuss, among other things, a policy that would require public display of buyer broker commissions and Realogy’s request that portals clearly display the listing agent separately from the advertising agent for each property listing.
Howard Hughes Corporation purchased the proposed 37,000 acre master planned community, Douglas Ranch, in Buckeye AZ for $600 million. Plans include 100,000 homes; 300,000 residents; and 55 million square feet of commercial property.
Goldman Sachs announced it will back a new SFR platform, Entera, which will match investors with finance options and rental properties. Could this investment influence its appreciation forecast?
Opendoor will now make real-time offers on Realtor.com’s My Home dashboard.
Final Thoughts:
The market is changing quickly and in order to survive and compete in today’s environment, it is important to understand the subtleties of today’s challenges. Also, as Marc King, Keller Williams’ President, suggested, agents must choose whether they want to be a “tech-enabled fiduciary” or an “Uber driver who opens doors.” The choice is yours.
Sarah Perkins is an award winning account executive and has been in title sales since 2004. As the Director of Industry Research & Senior Account Executive, Sarah’s role is to bring real estate transactions to Navi Title. Sarah supports her clients by helping them navigate the ever-changing real estate space through thorough research and understanding of current trends impacting today’s home buyers and sellers.
Today is all about the AZ market. On Wednesday, Lawyers Title hosted a presentation with Tina Tamboer with the Cromford Report. She always shares pertinent and timely information. Below I have combined a lot of her information from her presentation, along with additional information from my research.
What Affects Demand?
Population Growth
Technically every human being is an element of demand for housing, whether as an owner or a renter
Relocation (Inbound)
Households relocating from outside the metro area bring one excess element of demand without adding to supply
Out of state buyers is the biggest source of new population in AZ
18% of buyers are coming from out of state. The biggest feeder cities are San Francisco, LA, and Chicago.
Household Formation (Growing)
When 1 household splits into 2 (growing), one excess element of demand is created
When 2 households merge into 1 (shrinking), one element of demand is removed
Work from home movement drove our market during the pandemic and now it is normalizing.
With prices going up, household formation is shrinking. It is responding to the affordability issues.
This formation rate is an indicator that means the lack of formations will not allow for a lot of price growth, it reduces demand. Do not assume we will have a giant year of appreciation next year.
Affordability
Employment/Income
Increases or decreases in employment and income levels will affect Household Formation and Affordability
Appreciation/Depreciation
Appreciating home prices decrease affordability and decrease demand
Depreciating home prices increase affordability and increase demand
Tina thinks affordability will be flat from Q2 to Q3. When affordability is on a free fall, it is not a good time to buy. That is not the case today.
Prices went up in Q3 but at a much slower rate than earlier in the year. Appreciation slowed, sped up, and has slowed again. We are up 28.3% year over year. (24%-30% is accurate ballpark for everyone)
Interest Rates (Can offset effects of Appreciation/Depreciation)
Lower rates increase affordability and increase borrower demand
Higher rates decrease affordability and decrease borrower demand
Rising interest rates are a concern. With the Fed’s tapering likely to be scheduled in a couple of weeks, the markets will likely respond to the news of scheduled start of the tapering.
When a mortgage rate increases from 2.99% to 3.05%, payments increase by $12 a month (for the median house).
Loosening up is when lenders go to more desktop approvals (which Fannie and Freddie made permanent for refinances). When lenders hire more people, they are tightening up.
Loose/Tight Lending Practices (Can offset effects of Interest Rates)
Loose lending practices increase approved borrowers, and increase demand
Tight lending practices reduce approved borrowers, and decrease demand
Loan limits just increased by the largest dollar amount in history. For details, check out my update from last week, here.
Affordability declined in Q2 2021 and the US as a whole and Greater Phoenix fell below the ideal affordable range of 60-75 for the first time since late 2018. Through Q2 2021 in Greater Phoenix a household earning the median income ($79,000 annually), can afford 56.4% of what is for sale. A year ago, it was 70%.
Consumer Sentiment
Emotions, such as euphoria or utter despair, based on speculative opinions or unreliable forecasts can cause some home buyers to make decisions that are not in line with market indicators.
What Affects Supply?
New Homes
New construction adds more homes to overall total housing supply
Most not counted in supply for sale because most are not listed in the local MLS
FSBOs
Not counted in supply for sale because they are sold outside of the local MLS
Appreciation/Depreciation (Equity)
Appreciation creates more equity and allows more homeowners to sell without out-of-pocket costs, adding to supply
Depreciation creates less equity and restricts more homeowners from selling without out-of-pocket costs, restricting supply
Foreclosures / Household Formation (Shrinking)
When 2 households merge into 1 (shrinking), one home is left vacant adding to available supply
When 1 household splits into 2 (growing), one excess element of demand consumes an available home, thus reducing supply
Relocation (Outbound)
When a household leaves the area entirely, one vacant home is added to available supply
Divorce/Illness/Death/Job Losses/Tragedy
Divorce increases Household Formation and reduces supply
Death leaves a vacant residence, thus increases supply
Illness, Job Losses and Tragedy can cause Household Formation to shrink due to financial distress, thus increasing supply
Consumer Sentiment
Emotions, such as euphoria or utter despair, based on speculative opinions or unreliable forecasts can cause some homeowners to make decisions that are not in line with market indicators.
Rents:
It is not a great time to rent. It is not reasonable to expect rents to continue increasing as they have. Expect less rental rate appreciation. Rents will likely go flat for a bit and then go back up again. That is normal. They often go flat in Q4. Will they rise in Q1 2022? Probably not too much because of the extreme increases. Median rental price in Q1 2020 was $1,600. In Q3 2021 the median rental price was $2,200. That is a 38% increase!
Forbearance:
80% of the forbearance exits have stayed in their homes. With over 3 million borrowers having stayed in their homes after exiting their plan, the forbearance program has been very successful. There are 1.1 million borrowers still in forbearance, if 80% of those stay in their homes which is 880,000 homeowners, then we may see as many as 220,000 new properties come to market, nationwide. That breaks down to 4400 per state. And that would be overtime. There is no flood of listings that will come as borrowers exit forbearance. They will sell and it will not hurt the market. It could be why household formation is shrinking. We have over 10,000 houses sold a month.
Foreclosures:
Foreclosure filings are up. There are always foreclosures. Even during normal times there are foreclosures. On average, there are about 40,000 per month nationwide. There is a backlog of foreclosures due to the moratorium so expect increases but when you look at the chart shown, even with the current increase in pre-foreclosures, we are still way below 2019 numbers. In 2019 we never talked about foreclosures having an impact on the market.
We may see a boost as everything gets caught up. We are still below 1998 foreclosure levels were higher, with fewer houses and fewer people. March 2009 was the peak for pre-foreclosure notices at 10,558. In September 2021 we had 109 filings.
SFR Permits:
Single family permits are up 27.6% year over year through August. Permits always scale back in Q4. Nothing to be concerned about. What is happening with all of the permits that were pulled earlier in the year. We should see more houses that are added to supply. We are not seeing any impact of the increased permits turn into actual supply. This is largely due to labor and supply chain challenges slowing the process.
Non-MLS Sales:
Non-MLS Sales are at an all-time high. We used to call them FSBOs but now there are more reasons.
Non-MLS sales often turn into flip sales. Flip activity works the best in a seller’s market. We will be in a seller’s market until at least the middle of next year.
Ibuyers:
Affordability declined and the ibuyers went crazy and started paying way over asking. Ibuyers came in super high, creating new risk. They are now trying to sell to the buyers that they just outbid. And those buyers cannot afford the property.
They are not exiting the market permanently. Zillow came in too hot and is having to do a lot of price reductions. Click here for a great explanation of the iBuyer price struggles in Phoenix.
Opendoor is scaling back. They did not announce a pullback. They announced that they are still buying after Zillow’s announcement.
Flip sales are up 76% year over year in August. Opendoor’s flip sales are up 892% year over year in August. Zillow’s flip sales are up 638%. And Offerpad’s flip sales are up 86%.
The Market Cycle:
Lots of investors and sellers are at euphoria and buyers are at unease. Homebuilders are concerned about affordability and lenders will be concerned about it too. Appraisers cannot use a comp that is way off. They may throw them out if they are too far off. Often the highest and lowest comps are thrown out.
Supply:
Today’s supply movement is not seasonal. We are seeing a shifting market and not a seasonal market. Supply continues to increase and is up 78% since the end of February. Only down 11.2% from last year. In February inventory stopped dropping and started increasing. In May household formations started dropping.
Demand:
This is the time of year that buyer demand declines. Best time to be a buyer is in Q4 because supply is rising and less competition. Less ibuyer demand. Not a lot of seasonal supply for low end, insane market. The $400-800K market has been stable and there are 44.5% more listings under contract than in 2020 and 190% up from 2019. $800-1M supply is low and demand is high. $1M+ starting seasonal demand dip and Q4 rally. Q1 2022 will see more buyers. Comparing year over year demand for the second half of the year will come in negative because of the spike in demand late last year. Currently listings under contract are down 12.5% year over year but we are ahead of 2019 by 13.3%.
Closed Sales:
MLS closed sales through September is up 9.2% over 2020. A little less than closed through September 2005. October 2021 is following the activity of October 2020. By the end of the month, we may exceed closings through October 2005.
Cromford Market Index (CMI):
The best tool for predicting future price appreciation trends and is available on the main page of the Cromford Report: https://cromfordreport.com/ (without a subscription)
100 is balanced and prices rise at the rate of inflation (currently 5.4%), below 100 is a buyer’s market, above 100 is a seller’s market, prices drop below 90, prices rise at 110. 2014 was a balanced market.
On 3/20/2020 we were at 241
On 5/15/2020 we were at 145.2
Yesterday we were at 349.7
We peaked on 3/14/2021 at 514.9
Prior to this run, the previous peak was 312.9 in the spring of 2005.
CMI is the predictor, it moves first and then appreciation follows. Cannot predict the CMI. It tells us where we are.
When the CMI weakens we see other weakening follow, like sales prices, appreciation, over asking, etc. We are now averaging a decline of 1.6 points over 30 days. Previously it was dropping much faster over 30 days. It is slowing due to the increased demand, 4.3 points over the past 30 days while supply has only increased by 1.4 points over the same timeframe.
Ibuyers do not affect supply. Only demand. There is a slight slowdown in demand due to ibuyer pull back.
Prices are rising. Will continue rising through the end of the year. We will likely not see any prices decline anytime. They will go up at a slower rate.
Demand below supply = buyer market
Supply below demand = seller market
Always trying to come together. Currently, there is an extreme separation between supply and demand.
Contract ratio:
Only looks at what is active and what is under contract and nothing else. Contract ratios are very seasonal. Right now we have an extreme seasonal market. Some is seasonal, some isn’t. Despite the decline in contract ratio, the data shows we are still in an extreme seller’s market that is just starting to weaken.
Final Thoughts:
The extreme seller market is still in a frenzy. Demand is being driven more by investors than owner-occupants.
Annual Appreciation = 25.1% (down from 39%)
Sales Over Asking Price = 48.2% (down from 60%)
Median Over List = $10,500 (down from $20,000)
Average Sale Price per SF = 0.3% over List (down from 1.8%)
DOM Prior to Contract = 10 Days (up from 5 Days)
Median Sales Price = $415,000 to Date +24% from Last October
Demand Indicators:
Affordability Lower than Normal – projected to measure 56% again for Q3 when released in November
Household formation is down over past 3 months, corresponding with affordability indicators
3rd Quarter Sales down from Q3 2020, comparable to Q3 2019
Interest Rates Up to 3.05%
Lending Practices Loosening with Increased Loan Limits
Jobs Good
Corporate Profits Good
Inbound Relocation Good, Population Rising
Incomes (?) – To Come
Other Observations:
Ibuyers = Zillow on pause. Opendoor and Offerpad are scaling back.
Sarah Perkins is an award winning account executive and has been in title sales since 2004. As the Director of Industry Research & Senior Account Executive, Sarah’s role is to bring real estate transactions to Navi Title. Sarah supports her clients by helping them navigate the ever-changing real estate space through thorough research and understanding of current trends impacting today’s home buyers and sellers.
In this 21 minute video, Lydia Wietsma and I discuss the latest in forbearance, foreclosures, loan servicing, Zillow, and the market.
Forbearance:
80% of the forbearance exits have stayed in their homes. With over 3 million borrowers having stayed in their homes after exiting their plan, the forbearance program has been very successful. There are 1.1 million borrowers still in forbearance, if 80% of those stay in their homes which is 880,000 homeowners, then we may see as many as 220,000 new properties come to market, nationwide. That breaks down to 4400 per state. And that would be overtime. There is no flood of listings that will come as borrowers exit forbearance.
Foreclosures:
Foreclosure filings are up. There are always foreclosures. Even during normal times there are foreclosures. On average, there are about 40,000 per month nationwide. There is a backlog of foreclosures due to the moratorium so expect increases but when you look at the chart shown, even with the current increase in pre-foreclosures, we are still way below 2019 numbers. In 2019 we never talked about foreclosures having an impact on the market.
Zillow:
On Monday, Zillow announced that its iBuyer will pause all purchases through the end of the year. While yes, this does impact our market, the move does not define our market, nor will it cause sweeping changes. Given that the iBuyer market share is around 8% we will likely see a drop in demand. Zillow was the last iBuyer to rein in its purchases as the market shifts.
Final Thoughts:
Loan servicers are shifting back towards BPOs from iBuyer inspections. Sellers cannot expect the market of March and April. Buyers are educated and they see more and more homes coming to market and staying. Inventory is up and days on market have gone from 5 in April to 11 now. This is good for buyers. As the market slowly moves towards seasonality and balance, it will feel strange, and after being used to a market frenzy, a normal market will seem very slow. Everyone will benefit from a slow and steady market, whenever it arrives.
Sarah Perkins is an award winning account executive and has been in title sales since 2004. As the Director of Industry Research & Senior Account Executive, Sarah’s role is to bring real estate transactions to Navi Title. Sarah supports her clients by helping them navigate the ever-changing real estate space through thorough research and understanding of current trends impacting today’s home buyers and sellers.
Emotions have the ability to cloud our judgment. We are taught to be rational and to only use the facts when making decisions. That sounds good in theory, but when a human is devoid of emotion they cannot make even the simplest of decisions.
Do you have clients still worrying about when the housing market will crash? The intensity of late 2020 and early 2021 felt like the market frenzy of 2005. As the market normalizes it may feel weird or uncomfortable as we pivot again. While those emotions are important and we have to have emotion to make decisions, we have to look at the facts. And the facts point towards stabilization and continued appreciation, just at a slower rate.
National Real Estate:
Nationwide equity increased by $2.9 trillion since Q2 2020. This translates to an additional $51,500 in equity per borrower over the same time period. Another way to look at it is national negative equity share dropped to 2.3%, the lowest level in 12 years.
While the extreme price appreciation has benefitted sellers for nearly a year, it is unsustainable. The decline in the rate of appreciation will be noticeable and will feel uncomfortable, however, it is necessary to rebalance the market. Fannie Mae recently released its forecast for the rest of this year and next. I expect to see a 4% to 8% rate of appreciation, year over year in 2022 and Fannie Mae agrees!
According to Fannie Mae’s most recent Home Purchase Sentiment Index survey, those who said that it is a good time to buy increased by 7 points, month over month, the first improvement in four months. Those who said it was a good time to sell declined by 1 point, month over month in August. Consumers are starting to realize the shifting market.
Zillow sponsored a recent survey of real estate experts and economists projecting the source of future inventory. The panelists expect to see 40% of listings to come from existing homeowners who are relocating. 23% from home builders. 10% from sellers who plan to rent. And 5% from foreclosed properties. Based on the data above 5% could be a reach.
“Rising inventory and moderating price conditions are bringing buyers back to the market. Affordability, however, remains challenging as home price gains are roughly three times wage growth.”
-Dr. Lawrence Yun, NAR’s chief economist
After two months of gains, existing home sales declined 2% in August, month over month, dropping the seasonally adjusted annual rate of sales to 5.88 million. In 2020 there were 5.64 million home sales.
National rentals rates are at a 16 year high and up 8.5% year over year in July. In Greater Phoenix rental rates are up 18.9%.
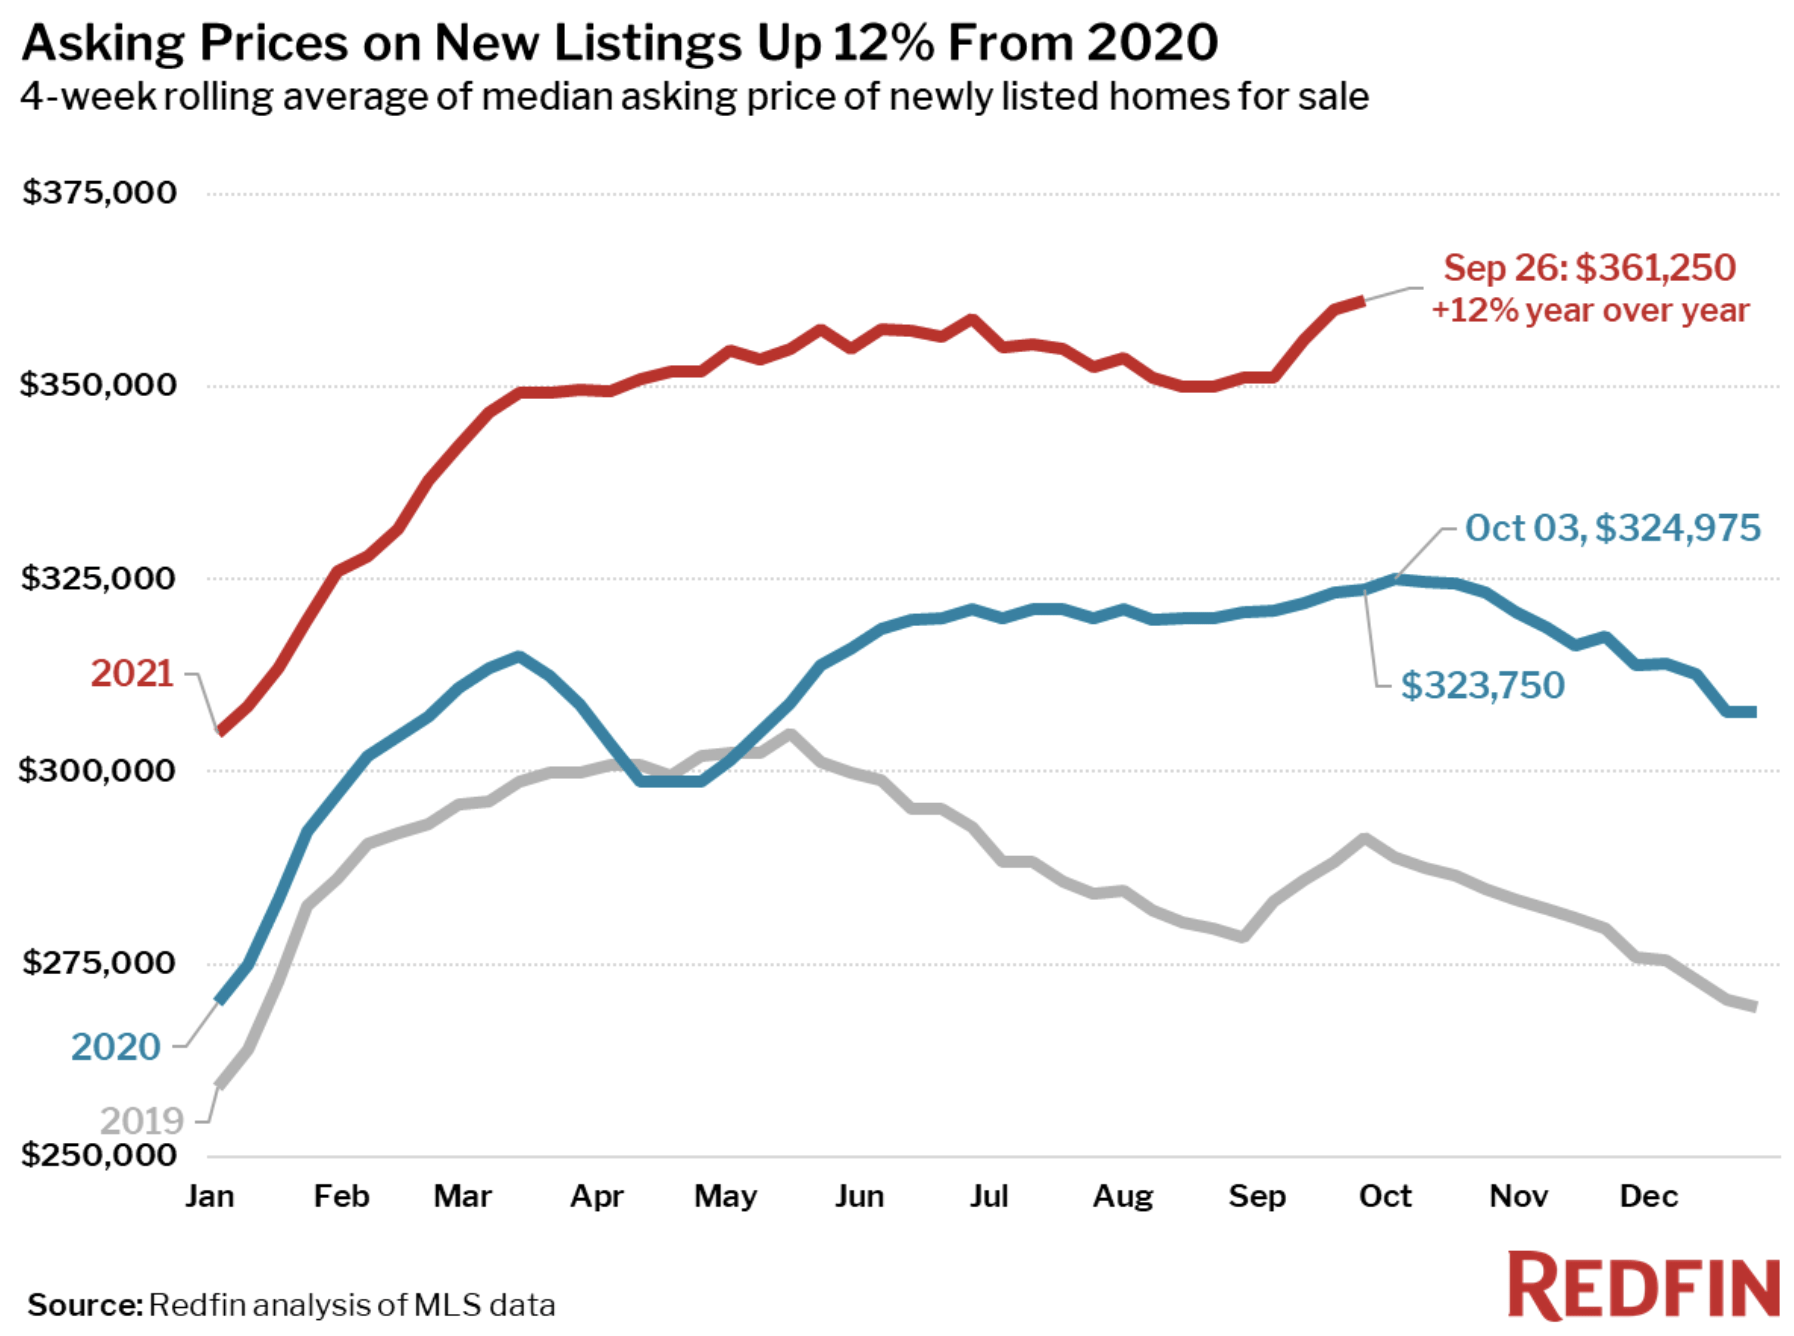
The median new listing asking price is up 12% year over year and reached a record high of $361,250 for the four-week period ending September 26. For single family only it is $389,900.
The AZ Market:
Demand increased by 11.4% from July 20 to September 30. That is unusual. Demand usually declines in August and September and begins to increase into October as the weather cools. Supply is up 19.6% over the same time period, this is also unusual as inventory tends to decline in the late summer.
Since 2016 developers have added 36,000 multi-family units, including leased and build-to-rent properties. 2021 will add 11,000 units, the most since 2009’s 9,315.
Pinal County is growing. In the first half of the year, Coolidge saw a 258% year over year increase in homebuilding permits. In the Town of Maricopa, permits are up 237% year over year.
New home permits are up 25% year over year in August, meanwhile, permits and closings for new single family homes declined for the second month in a row.
Nationally, upwards of 10% of new builds are for build to rent. Phoenix is the third-largest build-to-rent market.
Federal Reserve:
Mortgage rates are increasing. Higher rates = higher monthly payments = decreased affordability. Additional affordability pressure hurts demand. Rule of thumb: one percentage point = $50,000 of buying power.
Whether is it persistent inflationary fears, a strengthening economy, or reaching the debt ceiling, the Federal Reserve announced on September 22 that it expects to begin tapering its $120 billion in monthly purchasing of bonds ($80 billion) and mortgage-backed securities ($40 billion) before the end of the year. The tapering will be complete by Q3 2022.
“Though it may be due to uncertainty arising from brinkmanship on U.S. debt default, I believe it is from the greater recognition of higher inflation. The Federal Reserve has been revising up its inflation forecast and the Fed chairman Powell has changed his narrative to imply as such.”
-Dr. Lawrence Yun, NAR’s chief economist
These monthly purchases that started at the onset of the pandemic to stabilize mortgage rates have grown the Federal Reserve’s debt holdings up to nearly $8 trillion. Remember in April 2020 when jumbo loans all but vanished? It was this action that brought stability and extremely low rates to lending.
The Fed’s hopes to avoid another “Taper Tantrum.” In 2013, when the Fed began tapering its purchases, it only took 8 weeks for interest rates to go from 3.35% on May 2 to 4.46% on June 27 and finally peaking on August 22 at 4.53%. The quick spike in rates caused home sales to decline by 10% and price appreciation slowed but did not go negative.
The Fed’s next meeting is on November 2 and it is expected that the tapering start date will be selected then and could start as early as November. Markets often respond to news and interest rates have been slowly increasing since the September 22 announcement. Once the start date is established expect interest rates to jump as much as a quarter to half a percent. For more, check out my recent discussion from Monday, here.
New Construction:
New home completions were up 4% from July to August. At the same time, single family starts declined for the second month in a row by nearly 3% in August, month over month. New construction will not be the answer to low inventory.
In August, about 80% of new construction sales were either under construction or yet to be built.
Despite that single family construction has been increasing since it bottomed out during the Great Recession, home building is running at the slowest pace since 1995. With a housing unit deficit of 3 to 5 million (depending on the on the data source) it will take many years to close the gap.
Commercial Real Estate:
Sales prices in all four of the commercial real estate sectors are up year over year. 1.) apartments are 14.7%, 2.) industrial is up 13.6%, 3.) retail is up 12.5%, and 4.) office is up 11.2%.
Real Estate News:
In October 2020 when Opendoor filed it S-4 form with the SEC to go public, it revealed an August 2019 FTC civil investigative demand regarding advertising claims Opendoor made on its website. In its September 15, 2021filing the company warned investors that the deal currently in negotiation may “negatively affect the company’s ability to operate its business” and went on to say, “there are no assurances that we will be successful in negotiating a favorable settlement.”
Opendoor partnered with new home search platform, NewHomeSource.com, consumers browsing the site may request a trade-in offer from Opendoor without leaving the search portal.
According to Case-Shiller, at 19.7% July had the largest year over year gain since 1987 when Case-Shiller was created. Prices are up 43.7% since the 2006 peak. Phoenix remains the city with the largest year over year appreciation at 32.4% in July.
Final Thoughts:
While we still face obstacles, uphill battles, and constant change; remember residential real estate just pulled us out of the shortest recession in history. The strength of the real estate market is what gave it the ability to save the economy. That strength was created by real demand, not loose credit, and seemingly limitless speculation.
Sarah Perkins is an award winning account executive and has been in title sales since 2004. As the Director of Industry Research & Senior Account Executive, Sarah’s role is to bring real estate transactions to Navi Title. Sarah supports her clients by helping them navigate the ever-changing real estate space through thorough research and understanding of current trends impacting today’s home buyers and sellers.
In this 10 minute video, Amber Kovarik and I discuss the Federal Reserve’s September 22nd announcement stating the start of the bond and mortgage backed security purchase tapering will likely start this year and the expected impact it will have on mortgage interest rates. Click to watch or read my notes below.
This is an urgent message for any buyer that is on the fence about a refinance or purchase. Mortgage rates are going up, SOON.
Affordability is already being challenged. Rents are increasing, sales prices are increasing, and soon, without the benefit of low interest rates, homes will get even more expensive.
Rents are expected to continue increasing. Greater Phoenix rental occupancy is at its highest rate in over 40 years! Occupancy rates are 97.1%, the highest since 1978.
The $120 billion spent monthly on BMS and bond purchases have grown the Federal Reserve’s debt holdings up to nearly $8 trillion.
When interest rates rise, inflation slows. The Fed may be attempting to slow the rate of appreciation, which has slowed some over the past few months. The supply chain challenges continue to put pressure on the existing supply and thus increasing prices.
Despite inventory being up 42% from its lows in April, it is still incredibly low and demand continues to exceed supply.
Ivy Zelman said that 54% of American borrowers have a rate at or below 3.75%. If rates exceed 3.75% we could see more people opting to stay in their current property, which would only continue the low inventory challenges of today’s market.
Sarah Perkins is an award winning account executive and has been in title sales since 2004. As the Director of Industry Research & Senior Account Executive, Sarah’s role is to bring real estate transactions to Navi Title. Sarah supports her clients by helping them navigate the ever-changing real estate space through thorough research and understanding of current trends impacting today’s home buyers and sellers.
At some point, nearly everyone who was in the real estate business in 2008 says, “I wish I bought one/some/many houses when they went on sale from 2009-2011.” Then they go on and say, “Next time, I will be ready.” This sentiment is why prices won’t crash.
We will buy the houses (demand for the supply).
We can buy the houses (today’s market is very liquid, wages are up, savings are up, people have more money).
There is someone to live in the houses (population growth is greater than the housing stock growth).
Forbearance, Delinquencies, and Foreclosures:
In order to recognize why we will not see a market crash; we need to understand the extent of the distressed situation. Lydia Wietsma and I regularly discuss forbearance, delinquencies, foreclosures, equity, and loan servicing. Check out our 30-minute conversation and/or see my notes below for the content.
Forbearance Numbers:
Since 8/23/21, the number of borrowers in forbearance declined by 8.3% which means that about 100,000 borrowers exited their plan. Now about 3% of loans are in forbearance which translates to roughly 1.5 million borrowers.
“The share of loans in forbearance decreased by 8 basis points last week, as forbearance exits remained elevated, and new forbearance requests and re-entries were unchanged. 20% of loans in forbearance are either new forbearance requests or re-entries. At this point, borrowers in forbearance extensions are exiting at a faster rate as they near – or reach – the expiration of their maximum forbearance term.”
-MIKE FRATANTONI, MBA’S SENIOR VICE PRESIDENT AND CHIEF ECONOMIST
Forbearance by Stage:
11.3% of total loans in forbearance are in the initial stage, which is a 13% increase over the past month.
80.2% are on extension, a 2.6% decrease in a month.
8.5% are re-entries, an increase of just over 10% since August 23.
Forbearance Exits from June 1, 2020 through September 12, 2021:
42% of borrowers continued making their payments (21.9%), got caught up upon exiting (12.7%), or paid off the loan with a refinance or sale (7.4%).
The segment to be most concerned for is the one that exited their forbearance plan, still behind on their payments, and without a loss mitigation plan in place. This group increased to 16.4% up nearly 2% from last month.
If forbearance ended today and 16.4% of the 1.5 million borrowers exited their plan at the same time, we are looking at 246,000 borrowers nationwide. Divide that up evenly across all 50 states and we are looking at 4,920 per state. If we had 4,920 new listings hit the market tomorrow, they would all be absorbed quickly.
Equity:
In Greater Phoenix, home values have appreciated by 35% since March 2020. This appreciation rate gives many options to struggling borrowers. The vast majority of borrowers have at least 10% equity in their home, enough to sell through a normal sale.
“In just the last year, increasing home prices have translated into a substantial wealth gain of $45,000 for a typical homeowner. These gains are expected to moderate to around $10,000 to $20,000 over the next year.”
-DR. LAWRENCE YUN, NAR’S CHIEF ECONOMIST
Depending on the extent of the deferment, equity levels may decrease. Borrowers may include escrow shortages in their loss mitigation plans.
Seven percent of 1.5M is 105,000 total borrowers that may not have 10% equity. That breaks down to 2,100 per state.
Serious delinquencies, those 90 days or more behind, dropped by 108,000 from July to August and is over 1 million fewer than a year ago. There are still about 930,000 more seriously delinquent borrowers than there were in February 2020.
Foreclosures:
Be very mindful of scary foreclosure headlines. I just saw one that stated, “Foreclosures are Up 49%” While that is the truth, it is only because there have been so few. With the expiration of the foreclosure moratorium at the end of July, August brought about 7,100 foreclosure starts. The majority of these foreclosure starts were on properties that had started the foreclosure process right before the moratorium was put in place. It is also 80% below August 2019 foreclosure starts.
For context, from 2017 to 2019, there was an average of about 24,200 foreclosures a month, nationwide.
Jobs:
Greater Phoenix has recovered all of the jobs lost due to the pandemic and now has an unemployment rate of 4.8%. The entire state of Arizona has only 9,600 jobs to make up to reach February 2020 employment numbers. There are 10.9 million job openings nationwide.
Additional Items Discussed:
Servicing, everyone is asking about when the fire-sale of homes is coming. Drive by inspections for iBuyers have dropped off a cliff. Drive by BPOs are way up.
iBuyer purchases and slowing appreciation rate. Prices are not declining, they are not appreciating as quickly as they were.
iBuyer service fees are increasing.
Corporate buyers purchasing homes to rent. Removing the property from regular inventory. Rental rate increases.
Stock market shifts based on the news, fears of potential Evergrande, a giant Chinese real estate developer, defaults moved the markets earlier this week.
Final Thoughts:
While we do not know what the future may bring and there are many moving parts that impact housing, it is unlikely that we will have any form of a market crash. We will see prices continue to moderate and the 2022 appreciation rates will look nothing like 2021’s, and that is a good thing.
Sarah Perkins is an award winning account executive and has been in title sales since 2004. As the Director of Industry Research & Senior Account Executive, Sarah’s role is to bring real estate transactions to Navi Title. Sarah supports her clients by helping them navigate the ever-changing real estate space through thorough research and understanding of current trends impacting today’s home buyers and sellers.
Looking at housing, things look good and the market is attempting to normalize, but we do not see the whole picture. Wall Street, federal policy, a worldwide pandemic, labor and supply chain shortages also impact housing. But there is still more to consider: the intense and seemingly ever-increasing battle between the Department of Justice (DOJ) and the National Association of Realtors (NAR).
NAR & DOJ:
On Monday, NAR submitted a petition to prevent the DOJ from pulling out of their agreed upon settlement. Despite the lack of precedence and ongoing efforts, on July 1 the DOJ announced that it was pulling out of the November 2020 settlement. The DOJ stated that the settlement was not sufficient and that the DOJ wanted the freedom to investigate and pursue NAR further than the five items covered in the settlement, which include publicly sharing buyer agent commission, no longer calling a buyer agent’s services free, and lockbox access. Five days after pulling out the DOJ requested more data from NAR specifically regarding pocket listings and buyer agent commissions.
The Clear Cooperation Policy, also known as the pocket listing ban, requires all listings to be entered into the MLS within one business day of public listing marketing. And is one of the items that the DOJ plans to further research. A number of opinion pieces promote the removal of the “Coming Soon” status as it is inconsistent and unfair to smaller companies. Real estate analysts are not able to use Coming Soon status data which ultimately skews the numbers as listings often go from Coming Soon to Pending, skipping Active status completely, thus confusing true inventory counts. The DOJ is researching the size and scope of the policy as it is very far reaching with few exceptions. TAN and PLS sued NAR for implementing this policy. Both cases are ongoing.
The DOJ is also researching NAR’s rule that requires MLS and non-MLS listings to be displayed separately, steering based on commission offered, buyer/seller rebates, and the several class action, antitrust commission lawsuits. Given the size and scope of the requests, experts wonder if the DOJ has a game plan for execution.
Andrea Brambila of Inman News wrote an extensive article outlining the four years of on-going strife between NAR and the DOJ which can be found here.
National Real Estate:
Last week single family inventory declined by 1.4% to 431,000 from the previous week’s 437,000. Declines are typical over holiday weekends. With nearly 400,000 forbearance exits expected this month, inventory is expected to increase slightly, not decrease. The majority of forbearance exits either restructured their loan or continued paying throughout the forbearance period.
Home sales dropped by 1.4% from July to August and are down 6% year over year. Year over year comparisons are not useful because the pent up demand drove an end of the year purchasing frenzy that is unlike anything real estate has ever seen before.
Builder costs declined by 1% in August. Lumber and other costs have been slowly declining in recent months and last month was the first time that builders saw any benefit to the declines in prices. It is unlikely that consumers will feel any savings for some time.
The AZ Market:
As previously mentioned, we do everything faster and bigger here, at least in regards to real estate. The shifts hit us first and usually with a greater magnitude. From 2008-2011 homes lost roughly 45% of their value while the country as a whole lost about 25%. While the rest of the country started seeing inventory levels flattening and even declining by 0.2% from July to August, our inventory has started to grow again after a few weeks or staying flat.
Absorption rate is a great way to monitor supply and demand. It is very seasonal and from the chart below you can see the four-year trend and see that August 2021 is an outlier. Absorption rate actually increased from July to August versus decrease.
Tom Ruff of the Information Market wrote, “In August of 2020 nearly 91% of all homes purchased were by traditional buyers, for this analysis, we define a traditional buyer as individuals or married couples. In 2021 this number fell to 75%. We saw a significant increase in the number of properties purchased by iBuyers, large institutional investors as well as small investors.”
Despite our recent affordability decline, for details see my update from 8/20 here, Greater Phoenix remains among the most affordable big cities in the country. According to a recent report by Roofstock, the cost of living in Greater Phoenix is 1.3% below the national average. About 56% of households can afford the median priced home which is lower than the ideal 60-75% range but is significantly better than California, Washington state, and New York who range from 13% to 41%.
“On the business-attraction front, there really never has been more interest than greater Phoenix is seeing right now from firms across the globe looking to make investments and expanding and relocating to the region.” – Josh Reed with the Greater Phoenix Economic Council
According to Realtor.com’s Best Time to Buy Report, nationally the best time to buy is from September 12 to October 17. In Greater Phoenix it is from January 10 to January 16. Buyers have, on average 31% more listings to choose from and sales prices are about $10,000 below seasonal highs.
These are the first 10 markets in chronological order of the Best Time to Buy weeks.
Lending:
The Treasury and FHFA announced on Tuesday that they are suspending the 7% rule which limited Fannie Mae and Freddie Mac’s loan portfolio to allowing only 7% of their total loans to be secured by investment properties and second homes. This is good news!
Next week the FOMC meets and many expect Fed Chairman Powell to announce bond and MBS tapering starting in Q4 2021. The tapering will increase mortgage interest rates anywhere from a quarter of a percent to a full percentage point. 54% of mortgage holders have an interest rate of 3.75% or less. If rates go above this amount, affordability will be pushed further. Remember in Q2 2021 housing affordability decreased below the healthy affordability range. Further pressure on affordability will push more buyers out of the purchase market. And this is challenging given that rents are up over 20% year over year. The pressure is not only on perspective buyers, but higher interest rates also prevent potential sellers from selling.
Joel Kan, MBA’s Associate Vice President of Economic and Industry Forecasting said, “Purchase applications – after adjusting for the impact of Labor Day – increased over 7 percent last week to their highest level since April 2021. Compared to the same week last September, which was right in the middle of a significant upswing in home purchases, applications were down 11 percent – the smallest year-over-year decline in 14 weeks.” The long term growth is consistent and doesn’t look like the bubble of 2005.
Real Estate News:
High profile sellers are being exposed by high resolution images, tours, and video used to market listings. Identifying home décor, awards, plaques, etc. are readable. Several celebrities with listed homes have been identified through marketing.
HUD does not have to disclose flood risk on properties. HUD REO homes that sold from 2017-2020 were 75 times more likely to be in a flood zone than other homes sold during the same timeframe.
Final Thoughts:
This business is anything but boring (no matter what my brother says)!
Sarah Perkins is an award winning account executive and has been in title sales since 2004. As the Director of Industry Research & Senior Account Executive, Sarah’s role is to bring real estate transactions to Navi Title. Sarah supports her clients by helping them navigate the ever-changing real estate space through thorough research and understanding of current trends impacting today’s home buyers and sellers.
Real estate creates wealth. It has created long-lasting, multi-generational wealth, and it has done the opposite. Why? Appreciation. Home price appreciation, overtime, benefits everyone.
There is a lot of talk about softening, normalization, moderating, weakening, etc. They all mean the same thing; the real estate market is calming down. But before you exhale a sigh of relief, the market remains very, very hot.
“We are seeing some signs of softening in the housing market, but context is important here… We’re still very much in a sellers’ market, but we are seeing some early signs of softening.”
-ODETA KUSHI, DEPUTY CHIEF ECONOMIST, FIRST AMERICAN
National Real Estate:
The average American tenure in a home has increased substantially over the past 30 years and is now up to 10 years. A recent report stated that by 2037 we will be up to 15 years. At the rate we are going, we will reach that long before 2037. Less turn over = less available inventory = greater rate of appreciation (provided demand remains consistent).
According to Fannie Mae’s August survey of homebuyer sentiment, consumers think it is a good time to sell a home but a bad time to buy a home due to high prices and low supply. Without the buyers, who do the sellers sell to?
“The housing market has clearly become slightly more favorable to buyers. Homes are taking longer to sell, which gives buyers more time to make thoughtful decisions about whether to make offers. Home prices have plateaued, so buyers shouldn’t feel rushed to buy before prices rise further. And the fact that more sellers are dropping their list price is a sign that sellers have to be realistic about their price expectations.”
-DARYL FAIRWEATHER, REDFIN’S CHIEF ECONOMIST
While the market is normalizing, it is doing so from a very high level, so despite the recent declines in pending listings, we are still significantly above historic norms.
Commercial real estate is also benefitting from the demand for real estate. In July, commercial property sales prices were up 1.2% month over month and 11.8% year over year. Unsurprisingly, multifamily has seen the highest rate of appreciation at 1.6% month over month and 13.5% year over year, the highest annual appreciation rate in 15 years.
Prior to the pandemic, 60-75% of Zillow searches were for suburban homes, today it is 90%. At the same time, the number of suburban listings has declined 72% more than the urban listings.
The AZ Market:
Context truly is key. When the temperature cools from 514 degrees in March to yesterday’s 347, it is still super-duper hot (Cromford Market Index reference). The CMI measures the relationship between supply and demand and is the best leading indicator available. Anything over 100 is a seller’s market and prices rise at 110. Prices drop at 90. In order for prices to drop demand needs to be below supply. Demand is nearly 13% above balance while supply is 67% below balance.
Despite the normalizing of the market, it is not normal. Demand has actually increased recently which is unusual because this is the time of year demand typically declines. After a 44% inventory increase over the past three months, inventory seems to be leveling out again and the increases have flattened. Leveling out at 7,400 listings is less than ideal. The size of the Greater Phoenix market calls for 25,000 listings and we haven’t seen 20,000 active listings since 2016.
Jim Belfiore of Zonda is predicting that 35,000 new houses will be built in 2021, the most since 2007. There are 32,700 apartments in process but only 11,000 are expected to be completed this year. Apartment vacancy rates are close to 3% which is the lowest rate since the 1970s.
iBuyers & Appreciation:
In Q2 2021 iBuyers had a premium of 9.6% on their sales. Much of that gain was due to home price appreciation. This appreciation rate gave Opendoor and Zillow the confidence to move forward with extremely high offers, often significantly above market value. Acquisitions boomed and in July, iBuyers accounted for 8.1% of all home purchases in Maricopa County. This led to many flashy headlines about an upcoming giant Q3.
The iBuyers must have missed my market update a couple of weeks ago when I wrote about the declining rate of appreciation. I wrote, “In January the Greater Phoenix median sales price was $340,000; now it is $405,000. That is over a 19% appreciation rate in this year alone. Most of those gains took place at the beginning of the year with 15.5% of the gain occurring from January to May. The median sales prices from May to August increased by 3.15% and from June to August the increase was 1.25%. The appreciation rate is slowing, and this is good for the overall health of the market.” You can find the full update here.
On Wednesday, Mike DelPrete (with a little help from me) detailed how the changing home price appreciation rates are impacting iBuyer premiums in a big way. He wrote, “Home price appreciation rates are beginning to cool in major markets across the U.S., including Phoenix, where the median iBuyer home price appreciation has fallen 50 percent since May. Opendoor’s median home price appreciation for homes sold in August is just 2.7 percent, down a massive 75 percent from 10.7 percent in May.” Click here for his article and supporting graphs.
Lending:
The average mortgage borrower has $173,000 in equity which means that Americans as a whole have $9.1 TRILLION in equity, a record high. Cash-out refinances are increasing, interest rates are low and it makes a great headline. Keep in mind, while the refis are up, they are not near record highs and borrowers today have nearly double the amount of equity they had in 2005.
Real Estate News:
Offerpad went public last week via merger with former Zillow CEO Spencer Rascoff’s SPAC. It launched with a $2.7 billion valuation and in recent days increased by 27% to its goal of $10 per share.
A Federal Judge denied NAR and Zillow’s motion to dismiss discount brokerage REX’s lawsuit stating that NAR’s “no-commingling rule” violates antitrust laws. NAR’s current rule states that MLS listed properties and non-MLS listed properties may not be “co-mingled” in the same section on a listing platform, like Zillow.
California Regional MLS, the nation’s largest MLS, is updating its requirements for the listing agent disclosure on online listing pages. Now, on all online CMLS listings the listing agent, contact info, and brokerage are required. Will this spread across the country?
Final Thoughts:
Today’s low levels of inventory created huge leaps in appreciation. As that calms, skittish buyers will return to the market and more sellers will list their homes. It will be a long time before we see 25,000 listings, but maybe we could get up to 10,000 in Q1 2022, and what a market that will be!
Sarah Perkins is an award winning account executive and has been in title sales since 2004. As the Director of Industry Research & Senior Account Executive, Sarah’s role is to bring real estate transactions to Navi Title. Sarah supports her clients by helping them navigate the ever-changing real estate space through thorough research and understanding of current trends impacting today’s home buyers and sellers.