Once again, today is all about the AZ market. Recently, Lawyers Title hosted a presentation with Tina Tamboer with the Cromford Report. She always shares pertinent and timely information. Below I have combined a lot of her information from her presentation, along with additional information from my research.
What affects supply?
- New Homes
- FSBOs
- Appreciation/Depreciation (equity)
- Foreclosures/Household Formation (shrinking)
- Relocation (Outbound)
- Divorce/Illness/Death/Job Losses/Tragedy
- Consumer Sentiment
What affects demand?
- Interest Rates
- Appreciation/Depreciation (affordability)
- Relocation (inbound)
- Employment/Income
- Loose/Tight Lending Practices
- Population Growth
- Household Formation (growing)
- Consumer Sentiment – this could be the most important of them all.
The recent announcement that Fannie Mae and Freddie Mac must restrict second home and investment property loans to only 7% of their total portfolio (far less than it is currently) may negatively impact demand. This move could force second home buyers to pay higher interest rates on their loans.
Employment:
- AZ is on track to see 11% job growth over the next 2 years.
- 519 new companies came to AZ in the past 5 years.
- The AZ job market has diversified a lot in the past 12 years. We have gone from the majority of our population working in hospitality and housing to also have an emphasis on tech, biotech, manufacturing, health care, etc.
- Arizona’s unemployment rate is 6.3% and the national rate is 6.7%. 5% is considered full employment.
- Initial claims were at 4,108 the first week of March, normal is 3,807.
- Continuing claims remain significantly heightened. We are running 65,000 continuing claims a week and normal is about 19,000.
- People will less education have been more negatively impacted than have those with a college degree or higher.

Renters:
Due to the high unemployment rates for younger workers and less-educated workers; renters are struggling more than homeowners. In addition to the additional renter’s assistance in the latest stimulus plan, Arizona has quite a few options for rental assistance. Landlords are able to register on behalf of their tenants. For more information visit: https://des.az.gov/ERAP

Forbearance:
There are people who think it will be raining homes when the forbearance period ends. This is not going to happen.
Every 3 months we see an improvement, as more borrowers exit their forbearance plans. But the past few months have been flat. Hovering around 2.6 million borrowers in a plan. The recovery continues making slow progress. At the end of March, we will likely see a lot of forbearance plan exits. There have been additional filing extensions. For more information on forbearance, delinquencies, and demand please see my forbearance update from Wednesday, here.

Foreclosures:
What happens with the moratoriums are lifted? We will see a wave of foreclosure filings but not of short sales. After 18 months of no foreclosures, there will be a backlog. But they will mostly be sold normally as owners have more equity today. According to KCM, on average nationwide there are about 69,000 foreclosure a month, during normal times.
Population:
- Population growth is creating demand.
- When you lose population, you have extra homes, when you gain it, you have insufficient supply.
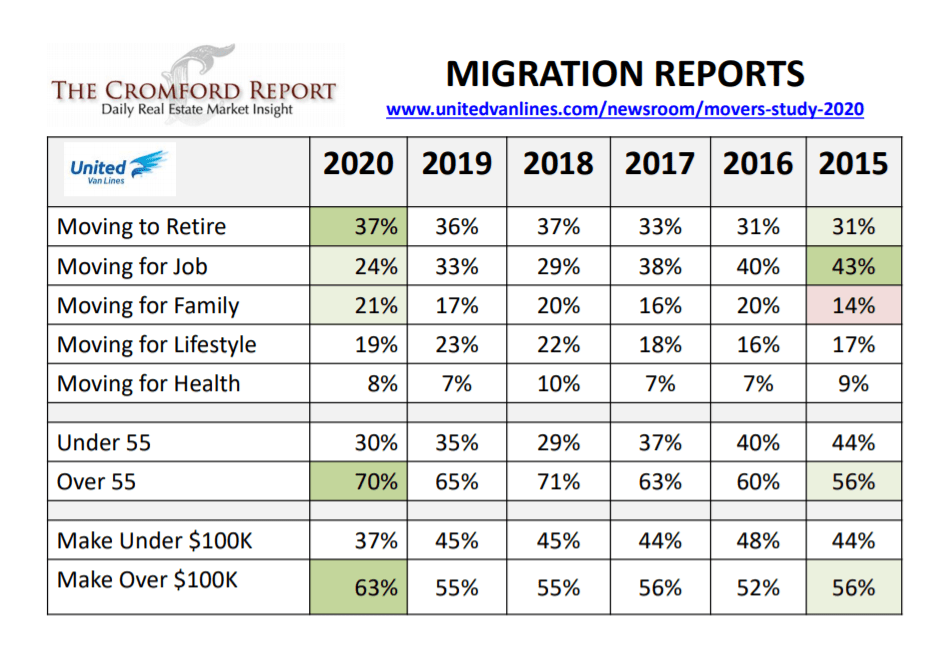
- AZ is #2 for incoming migration behind Idaho.
- All of the moving companies agree, people are leaving CA, NY, IL, WV and are moving out to AZ, ID, and TX.

The majority of AZ’s population growth is from people moving here domestically. It is not from lots of babies or international migration.
Most people started moving here to retire versus people moving here for a job in 2018. Look at the ages of the people moving here, their income, and retirement. Our domestic migration is older, wealthier, highly trained, more experienced population and finishing up their career and then retiring.
Affordability:
The ideal range for housing affordability is 60-75. Through Q4 2020 in Phoenix someone earning the median income, they can afford 60.6% of what is for sale. In LA it is 9.1% and San Francisco it is 11%.

Household Income:
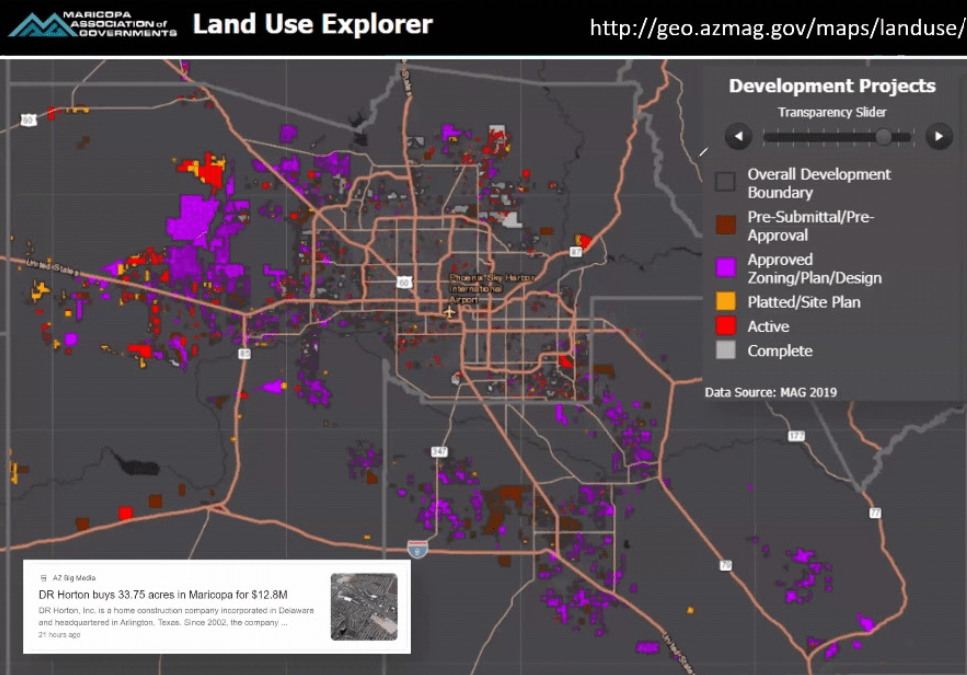
Maricopa county association of governments, shows demographics, click here for the demographics map. Density is increasing in new luxury areas. South Chandler, a lot of Gilbert, east Mesa, and South Mountain is getting bluer. Showing new emerging luxury markets.
Job Centers:
Jobs are created by freeways. The heavier the employment area the bluer. A lot of job growth, biomedical, and tech, fueling demand, bringing in people who make a lot of money. Click here for the interactive map.

The Cromford Market Index:
Available on the main page of the Cromford Report: http://cromfordreport.com/ (without a subscription)

- 100 is balanced and prices rise at the rate of inflation, below 100 is a buyer’s market, above 100 is a seller’s market, prices drop below 90, prices rise at 110.
- On 2/5/2020 we were at 215.1
- On 3/20/2020 we were at 241
- On 5/15/2020 we were at 145.2
- Yesterday we were at 512.6.
- We peaked on 3/11/2021 at 514.9
- Prior to this run, the previous peak was 312.9 in the spring of 2005.
- CMI is the predictor, it moves first and then appreciation follows. Cannot predict the CMI.
Demand is 14.5% above normal and supply is 77.7% below normal. Despite demand dropping by one percentage point a week and faster than supply is dropping, the market is still in a frenzy. As inventory stabilizes, which it will, this market is unsustainable, things will calm down. Buyers will once again be able to get a house without having to write 10+ offers before one is accepted.
With the CMI dropping, prices will not go down, they will increase more slowly, which is what we want. This appreciation rate is not sustainable. This doesn’t mean that we will crash. Indicators wants to be together. Markets want to be balanced. Buyer’s markets do not happen because it is time. There are reasons for buyer’s markets, there has to be a cause. Demand needs to be lower than supply in order for prices to drop.
Is it a good time to buy? Yes! It is best to buy and sell in a seller’s market. Sellers make money and buyers see appreciation right away.
What will slow it down? Affordability.
Affordability in Q1 2021 will likely drop below 60 which puts pressure on prices. the level of demand doesn’t start dropping until we are below 60. How long will it take to get to lower demand? It could take months, who knows. Demand, once it goes to the low side of normal and then we will see supply go up.
Number of Sales:
ADRE is adding 500 new licensees a month, not all in residential but it is increasing the amount of competition as more people will be fighting for a certain number of monthly sales.
Supply will come up when demand goes below normal, prices will continue to go up until demand is lower than supply.
As transaction counts decrease, it will impact all of our jobs. We need to position ourselves for the 2nd half of the year. Focus all efforts on listings. We have the demand but the competition will be increasing significantly in the 2nd half of the year.
Interest rates:
The recent big hike could be a reason for the drop-off in demand. Even though 3% is great, people get scared when it increases. It does limit options for some buyers.

Those who waited for prices to go down are now paying $20,000 more for the median sales priced home just since December due to rate increases. Since 2018 the median sales price has increased by $80,000 but monthly payments have only gone up by $133.

Rents:
Rents are more expensive than mortgages. Rents are rising quickly. The median house rents for $250 more a month than the going rate for a mortgage for the same house.
Rents are rising = not a bubble, rents decline due to false demand. Rents are declining in San Francisco while houses are still rising, equating to false demand. San Francisco could be considered over-valued. Prices only drop due to vacancies. The number one risk in housing is vacant houses.
Vacant Homes:
- 77% of sales in Q4 2020 were owner occupied purchases.
- The remaining 23% were iBuyer, investor buy & hold or flip, vacation rental, 2nd home properties.
- Second homes are always counted as vacant. The new Fannie and Freddie rules may impact this market.
- The new lending guidelines will not impact international buyers.
Supply:
- Supply stopped dropping for the first time in a year.
- It actually increased by 100 listings in one week.
- This is the worst year in the past 20 years for new supply, even with the slight increase and despite being the best quarter ever for sales.

Sales:
- Selling 2500 houses a week, listing 2000 a week.
- Pendings have been flat for 1.5 months, we can’t increase properties under contract when there isn’t enough supply.
- And still are having the best quarter ever.
- Appreciation is pushing 24% year over year, but most price ranges it is about 10%-15%.
These markets do not stay like this forever. We will not see then impact of the pullbacks for about a month. Then we may see a slow down in sales. Need more inventory under $500,000.
Sales Over Asking:
- 49% of sales closed over asking the first week of March.
- 40% of sales closed over asking in February.
- The median amount over asking is $10,000.
- 50% of all accepted contracts were on the market for only 6 days.
Population Growth and New Builds:
We overbuilt for 10 years before we started underbuilding for another 10 years and population growth outpaced building. In 2019 we ate up the last of the glut of housing.

Developments:
Without new listings we have to look at new construction which is a challenge due to labor shortages and lumber prices are up 200%, adding, on average an additional $24,000 in cost to the average new build.
Most developments are going into the south and west, due to cheaper available land. Very little in the north. Values are increasing the most in the north. Click here for the interactive map.
Contract Ratio:
On March 1 the contract ratio was 300. That means for every 100 active listings there are 300 pending listings.

Final Thoughts:
- Supply is down 77.7% below normal.
- Demand is 14.5% above normal.
- Year over year appreciation is pushing 24%.
- Sales prices are not going to decline this year.
- There will likely be fewer sales in 2021 than in 2020 due to the low inventory levels.

Sarah Perkins is an award winning account executive and has been in title sales since 2004. As the Director of Industry Research & Senior Account Executive, Sarah’s role is to bring real estate transactions to Navi Title. Sarah supports her clients by helping them navigate the ever-changing real estate space through thorough research and understanding of current trends impacting today’s home buyers and sellers.
Leave a Reply