Greater Phoenix Real Estate Market Update 7/31/2024
You know when you have a million things on your mind and you want to talk about all of them at the same time? We went to the Jersey Shore, my kids started school (thank God!), we renovated our house, the August 1st deadline is looming, Angela Gonzales just quoted me in the Phoenix Business Journal (see article here), and last week NAR stated that we are running 3.89M sales annually (YIKES).
These are my thoughts on a few topics.
Commission Changes:
August 1st will be the start of some chaos that will not last forever, although I expect disruption for a number of months. The industry is changing. Like a lot. Regardless of your opinion on what happened, it happened. On 10/31/2023 the Sitzer verdict came down and the jury found in favor of the plaintiffs and not the defendants. The bottom line of what that means is that how buyer’s agents are paid now changes permanently. No longer is a buyer’s agent compensation regulated by the MLS and shared, uniformly, by the listing agent. It is now based on the buyer broker’s agreement with the buyer and their buyer’s agent which still can be negotiated with the seller via the purchase contract and addendums. The Arizona Association of Realtors released 18 new documents that may be used by licensees in AZ at their broker’s discretion to assist with this change.
On Thursday, August 1, all mention of compensation to the buyer’s agent will be removed from the MLS that serves Greater Phoenix (ARMLS). This is the source of active/under contract/sold data for essentially everyone in the real estate industry. Needless to say, most industry players are bracing themselves for chaos, fear, change, and a new path forward.
Below illustrates the changes in co-broke offered to buyers agents in the 9 months since the Sitzer verdict. Commissions have been changing for many months and as of tomorrow we will no longer be able to track these changes.
New Construction:
While new construction is running about 20% market share for all closings in Maricopa County, it tells us a very clear story, one that is reflective of the overall market. Today’s buyers want to buy homes that are move-in ready. Historically speaking, new construction makes up only about 10%-14% market share for all closings.
These heat maps illustrate new construction supply (June’s permits) and demand (June’s closings). Unsurprisingly, both maps show new permits and new home closings are happening mostly in the southeast valley and northwest valley. I expect these areas to continue to grow and develop. It is where there is available land to build on and, particularly in the northwest valley, tons of new jobs.
2023 was a very good year for new home builders. The big public companies did very well on the stock market. Both the public builders and the regional builders did well due to lack of resale supply and the additional financing options many builders are able to offer. Several builders are now offering permanent mortgage rate buy downs for their buyers.
Year to date new permits are up 45% year over year, showing builders early 2024 enthusiasm. In June, permits were down about 1% year over year. Expect supply to continue to grow. Demand for new homes is a bit more muted than the coming supply. Year to date new home sales are up just shy of 2% year over year. While the June new home sales were down over 2% year over year.
Demand often moderates during the summer and July’s numbers will be interesting. The potential September Fed rate cut could stir some pent up demand into action. Meanwhile, the looming elections may create some headwinds against a Q4 bump.
Supply & Demand:
This is a snapshot of the overall market. Inventory is up over 50% year over year but it has flattened in the past few months. While new contracts still outpace the new listings, there is an above average rate of cancellations. Today’s market is stifled. There is pent up demand, waiting for lower mortgage rates. And price increases have moderated, and remain stable. Many analysts expect prices to soften through the rest of the year. Our current environment is a lot like the 2014 market. It was balanced with an above average amount of price reductions and cancellations. Both sides have negotiation power. The best houses are selling immediately. This is the time of making those updates and fixes prior to listing, versus offering a concession to the buyer. Buyers who are paying today’s prices at today’s interest rates are not looking for fixers, they want move in ready. This is another reason why new construction has seen so much growth. Buyers don’t want to fix anything.
Case Shiller Home Prices:
The Case Shiller Index for May’s home prices was released yesterday. As we have discussed in the past, this data is old so it isn’t great for anyone who is trying to buy or sell a home right now. They need to rely on more current comparables. However, for historic reflection and understanding long term trends, Case Shiller is great. The year over year changes are useful for gauging the overall market and its 12 month evolution. A lot can happen in 12 months. If interest rates dropped to 5.5% tomorrow everything would change, immediately. Anyway, I digress, the Greater Phoenix numbers are trending well below the national consensus. The May, year over year, appreciation rate is 4.4%. In May the CPI had a 3.4% year over year increase which means that homes effectively increased by 1% over the past 12 months. May was the high point in our spring market. The second half of the year tends to have a lag versus the first half for price appreciation. And the Q4 boost we often get when the temperatures cool tend not to happen during election years. Typically, we see Q4 slowness during election years. Consumers want certainty which means they want to know WHO will be in the White House. The ultimate winner has less impact than the uncertainty of the unknown. Those buyers typically defer from Q4 to Q1 the following year, because they have certainty.
I find the month over month data to be more compelling. Greater Phoenix is the only city in the seasonally adjusted 20 city composite to show a 2 month decline. Portland is the only other city to show a one month decline. Our local prices peaked around May 10th this year and have been under pressure since. While, overall, our prices have shown resilience, more so than some expected, they are flat. Today’s buyers have more options than they had a year ago and they are exercising those options. Sellers are not desperate and may or may not agree to buyer’s demands. This is why prices haven’t come down in any meaningful way. I am a bit more bearish on the market than many of my colleagues so I do anticipate more softening as we go later in the year.
The recent Q2 GDP report may extend the period of strength but what ultimately makes me skeptical of lasting growth is the American savings rate, which has declined precipitously over the recent months.
Final Thoughts:
They say when it rains, it pours. Indeed. These are times of big changes and a lot is at stake. The dust will settle, and a new path forward will emerge. And despite it all, I am optimistic about the future because we are resilient, creative, and tough.
Sarah Perkins is an award winning account executive and has been in title sales since 2004. As the Director of Industry Research & Senior Account Executive, Sarah’s role is to bring real estate transactions to Navi Title. Sarah supports her clients by helping them navigate the ever-changing real estate space through thorough research and understanding of current trends impacting today’s home buyers and sellers.
It has been a minute since my last post and I appreciate you for reading this now, after all of this time. It seems like millions of things have happened over these past few months. I celebrated my 20th year of being in title insurance sales in Greater Phoenix. That was exciting for me but the biggest news has been the commission lawsuits and the NAR settlement. This continues to be fluid and the DOJ has strong opinions. How things actually transpire remains to be seen. I have my suspicions and as an avid industry watcher, so far my predictions have come to fruition. NAR’s danger report, released in 2015 was the start of it all. It can be tough to find, and you can view or download it below.
The new listing and new contract numbers are running very close together. Inventory isn’t growing super quickly but if you compare it to where we were a year ago, it is up a lot, over 50% higher. Demand remains low. It was low last year and it is about 8% lower this year than it was. The relationship between supply and demand is no longer benefiting sellers. Arizona’s summer is here and the luxury buyers have left. Prices were flat from April to May with a median sales price of about $450,000. The expected median for June is $445,000. While it is typical for prices to moderate during the summer, it is early for them to already be declining. The persistently high mortgage rates are deterring today’s buyers. The demand is there, but they are sitting on the sidelines.
While the overall economy remains strong, the cracks are beginning to show. The COVID money has all been spent and American’s savings rates are at the lowest in years. People feel poor and are pulling back on spending. The easiest way to see this is by going to your favorite restaurant. Restaurants are less full. We no longer have to wait for a table. Unemployment ticked up last month, despite a stronger than expected jobs report. There were more separations than there were new jobs. The thing to watch now is the workforce participation rate. That is declining now, nationally. The benefit we have here in AZ is that our unemployment rate is extremely low, it is around 2.6% which is lower than the national 4% rate. This gives us a bigger buffer should we go into recession soon. I am a bit more bearish on this front than several of my colleagues.
The best thing we can do for today’s buyers and sellers is to tell them what is happening. Sellers MUST price their home right. This is not the time to push the market. Buyers are educated and watching everything that happens. A recent Redfin report stated that buyers view properties that have been on the market for 14 or more days as either overpriced or busted. Sellers have 14 days to put their VERY best foot forward. There are buyers in the market but they can be discerning. They have more options than they did last year and more often than not, they are flexing their negotiating muscles.
On a side note, ARMLS released a recent update addressing the upcoming changes due to the NAR settlement. Navi Title’s own Lance Billingsley contributed to writing this and creating the path forward. NAR Settlement – ARMLS
Roughly half of all listings on the market have taken at least ONE price reduction. This will likely increase in the coming weeks.
If you do not regularly read ARMLS’s STAT, created and written by my friend Tom Ruff, I suggest you do, the full report can be found at https://armls.com/statistics.
Properties priced well, sell faster and sell closer to their original asking price.
Sarah Perkins is an award winning account executive and has been in title sales since 2004. As the Director of Industry Research & Senior Account Executive, Sarah’s role is to bring real estate transactions to Navi Title. Sarah supports her clients by helping them navigate the ever-changing real estate space through thorough research and understanding of current trends impacting today’s home buyers and sellers.
Today is all about the AZ market. Recently, Clear Title hosted a Market Update with the Cromford Report’s Tina Tamboer. She always shares pertinent and timely information. Below I have combined a lot of her information from her presentation, along with additional information from my research.
To learn more about a Cromford Report membership, click here.
To register for our October 12th Cromford Market Update with Tina Tamboer, click here.
Mortgage Interest Rates:
Interest rates have been very volatile and while inflation remains persistent despite the Fed’s continued efforts it is unlikely rates will decline any time in the near term. We need rates to be stable and boring and not bounce around like they are. This constant fluctuation is hurting the already tight affordability.
In March when rates moved above 4.4% there was a measurable weakening in the market. When rates reached 5% in May, we saw a bigger dip. Then in May rates hit 5% and we saw a bigger dip. The rate movement directly influenced the number of listings going under contract. When rates went from 5.1% to 5.89% in June there was a 28% decline in contracts. When rates dropped back to 4.99% there was a 25% increase in contracts. While rates hovered around 5.1% – 5.2% contracts stayed high. Then in the past few weeks, we have seen a substantial decline in contracts. Expect this decline to continue.
Rates have changed our perspective of what is a good rate. People are back to thinking that 5% is awesome. Low 5% are looking good to consumers now.
Accepted Contracts:
These accepted contracts include cash sales, which are up from previous years.
Emotional Cycle:
All of the volatility has created “FUD” standing for fear, uncertainty, and despair. Our contracts are at 2014 levels. Back in 2014 contracts were increasing and today they are decreasing which has put despair back into the market. This decline is much larger than seasonal shifts. There was hope and with rates creeping ever higher, the hope has evaporated.
This happened in 2009 when we had the first-time home buyer credit and we saw a pick up in contracts. But when the credit went away, so did those additional contracts. It gave us hope and then went back to despair.
Nothing lasts forever, the market changes always, so never expect anything in housing to last forever. That is true of mortgage rates too. They move up and down.
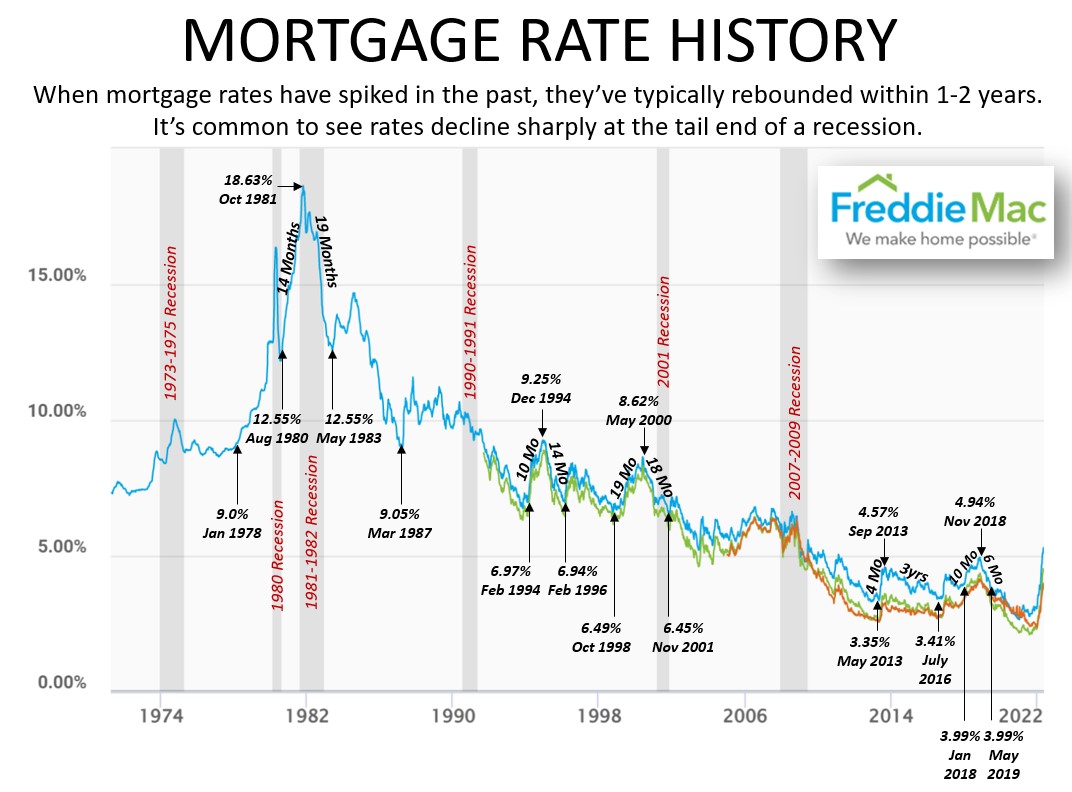
In every single recession since 1974 rates have declined. There is no declared recession right now. Many believe we are already in one or on the cusp of one. Recessions typically last anywhere from 6 months to 1.5 years. Based on the history it is reasonable to expect that at some point in the next 12 months rates will probably come down.
Fannie Mae’s latest forecast predicts a mild recession in Q1 2023 but they do not expect rates to decline as the Fed has made a commitment to taming inflation first.
Affordability:
In August the median sales price was $440,000. Based on a 10% down payment and basic assumptions, the estimated monthly payment was $2,616. But with September’s estimated median of $450,000 and increased interest rates the estimated payment (with the same assumptions) is around $2,844.
Buydowns are great but buyers still need to be approved at the higher payments.
Rents are up 2.2% over the past 12 months. Inflation is 40% housing and rentals carry a lot of weight. In the first 2 weeks of September rental rates declined. Would-be buyers are looking at rentals again. The median monthly rental payment for the median home is about $2,249. That $600 a month difference from a mortgage payment to a rental payment has played a role in the declining purchase demand. $2,249 is an affordable payment for households with an income of $96,000 annually.
Q2 22 affordability was 22%, which is terrible and with higher interest rates, this could get worse.
Investors:
With available rentals listed on ARMLS up 134% since September, a long-term hold strategy may be better on affordability for investors when offering their product (rental/flip) to consumers.
The 2005 crash looked similar in market movement to today but the fundamentals are very different. In 2005 many flip investors took advantage of very risky loan offerings which ultimately put the consumers on the hook when prices declined. Today, the stock market has taken on most of the risk. Due to the volume of cash purchases, investors may see less-than-expected returns. Today’s consumers are in good shape.
If the population cannot afford the prices, they will not buy. We are seeing the investors bringing prices down as inventory rises. Rental supply is up 134% in a year. Up 82% since January. Landlords are scaling back. Rents are only going up 2.2%. Expect rental rates to decline further.
Flip Investors are also struggling and left with more inventory and less demand. We are in a balanced market. iBuyers scaled way back in August. Acquisition to sales is down 60%. Of the flips, only 1/3 are iBuyers.
In 2012 – 2014 flips declined as the market normalized. iBuyers arrived in 2015 and didn’t really rock the market until 2021 when Opendoor and Zillow overheated the market.
Contract Ratio:
The contract ratio is not seasonally adjusted so shifts appear more quickly. It is a great gauge in a quickly changing market. Ratios above 60 illustrate a seller’s market and below 30 a buyer’s market. This shows we are in a balanced market but with low demand and few listings so we are in a low velocity balanced market.
In June we had measurements as high as 100. There are still some hot spots but they are fewer and further between. Luxury is doing very well.
The contract ratio has stopped dropping. We have been here for nearly 8 weeks. The ratio rises when listings decrease and under contract increases. When listings under contract rose and so did active listings so they balanced each other out. It doesn’t mean that our inventory will keep rising.
The slide below really shows seasonality. Buyers should not wait until the spring. Every single year the contract ratio goes up in the spring. Mostly from January to March. Buyers looking for a deal should buy now. It is impossible to time the market. The best time to buy is when you have sad sellers, not when you have hopeful sellers. Don’t wait for the spring. Buy now.
Who are the most desperate sellers? iBuyers and builders. Go bargain hunting. New homebuilders want to sell before the end of the year.
For the industry, it looks like 2014’s market. But 2014 was a better market for the industry with more contracts written. Now there are fewer contracts. The only thing that fuels our industry is when people write contracts. It is what keeps us fed, regardless of price point.
For the consumer, the 2014 market and 2022 markets are the same. They are not impacting the seller, they do not have to come to the table with money to sell. They are making money on their sales. Owners have equity and the means to weather the price reductions and still sell for a profit.
The majority of buyers who have owned for 18 to 24 months are fine. The flips are struggling more and they are impacting our industry the most.
Cromford Market Index (CMI):
The best tool for predicting future price appreciation trends available is on the main page of the Cromford Report: https://cromfordreport.com/ (without a subscription)
100 is balanced and prices rise at the rate of inflation (currently 8.3% nationally, 13% in Greater Phoenix), below 100 is a buyer’s market, above 100 is a seller’s market, prices drop below 90, and prices rise at 110.
Between 90 – 110 prices roughly follow the rate of inflation.
Yesterday we were at 104.7
All-time high: 3/14/2021 at 514.9
2022 High: 2/7/2022 at 474.6
3 months ago, 6/26/2022 it was 193.8
CMI is the predictor, it moves first and then appreciation follows. Cannot predict the CMI. It tells us where we are.
When CMI goes down that means it is dropping despite seasonality. When things are balanced homes appreciate at the rate of inflation which is now 8.3%.
It is a true supply and demand index and it shows that we are in balance. We have been here for nearly 2 months. This is why we keep talking about 2014, which was our last balanced market. Some say feels like a market crash. In 2007 we had a crash when there were 57,000 active listings and only 4,000 under contract. Today we are closer to 19,000 active listings and 7,800 under contract.
The demand index hasn’t been this low since 2008 which is where the stress of the market is coming from. This has everything to do with the industry fears. Expect the blue and green lines in the chart below to come together.
Demand increased when rates dropped to 5%. Expect demand to decline since rates are up again. The market is gliding downwards not falling off a cliff. Expect the glide to continue as things settle down. These numbers do not support prices getting back to 2020 numbers. The math does not support a crash but a correction. We are not crashing, we are on our way toward a regular buyer’s market.
There is a lot of evidence that the demand will come back. And it will likely come back strong when rates drop down to around 5%/5.5%. Sidelined demand emerged when rates touched 5%. This indicates that demand will likely come back quickly when rates are at an acceptable level. That acceptable level continues to change and move upwards.
We do not know when the market will turn but we know that it will turn.
Overall, we are in a balanced market. But it is not the same in all places. Paradise Valley has the strongest seller’s market. The strongest buyer’s markets have more to do with builders because they are adding more inventory. Strong builder activity means you will have a stronger buyer’s market.
Supply:
Supply is up 159% year over year. We normally see an uptick in supply this time of year. Interest rates are dampening demand which is allowing for increased supply, despite few new listings hitting the market. Expect listings under contract to bounce around as it follows the normal seasonal curve. Contracts are down 30% year over year.
The growth rate is impacted by supply and demand. Lots of new listings with lots of demand decreases inventory, like last year. Lots of new listings with not a lot of demand increases inventory, like in June and July. Now with less of everything the market is balancing out. This is why we are in a low-velocity balanced market. We were following the 2005 trajectory earlier in the summer and then stopped and dipped in August.
Many sellers are realizing that this isn’t the best time to sell. In 2007 we were adding 3500 to 4000 listings a week to the MLS. Now it is less than 200 a week. It is not the best time to sell if you don’t have to. The best way to stabilize the market is for sellers to hang on to their houses. Only serious sellers want to be in this market.
Both canceled and expired listings are normalizing to about where we were in 2014.
New home builders are scaling back on permits, from March to July permits declined by 49%. Preliminary data shows permits were lower than sales in August.
Seller Concessions:
Seller concessions are rising. In August 32% of new homes closed with seller concessions. During the same time period, resale homes closed with 11% seller concessions. Resales are competing with new homes. Builders are throwing a lot at buyers.
Expect seller concessions, both in new homes and resales, to continue to increase. It is typical to see about 25% of sales have concessions. The vast majority of seller concessions are in the $300,000-500,000 price range.
Days on Market:
In 2014 the average number of days on market before contract was 38-44 days. Today it is about 29. A buyer wants a tired, desperate seller, this fall is the great time to buy, we are seeing the most days on market in years. The best time to buy is October through December. We are adjusting back to a balanced market. Expect days on market to increase throughout the remainder of the year. This is the slower season and interest rates are slowing things down further and faster.
Price Reductions:
Price reductions are up 746% in the past 5 months. Historically speaking, we are seeing far more price reductions than usual. We have to get down to where the buyers are. The median amount of weekly price reductions is 1800-1900. Today it is about 3800 reductions a week.
Sale Price/List Price Ratio:
Lowest since 2019, which was a seller’s market. Things are getting more normal. 97% of the last list price is normal. Buyers are trained to offer list price. Now they are learning that they can go down. This is why we maintained 100% until about 1.5 months ago.
Price Appreciation:
Remember, the sales price of a property was agreed upon 30-60 days prior to closing. These sales prices reflect a past market. While they are a guide, they are a lagging indicator.
The median sales price through the middle of September is $450,000. That is up 9.5% year over year. That is also down 6.25% since May’s median reached $480,000. In May, the year over year appreciation rate was 22.3%. The rate of appreciation is slowing dramatically. With inflation at 8.3% any appreciation rate below 8.3% but is still positive is actually a loss. In a flat market, homes appreciate at the rate of inflation.
If we have a drop of 10-15% decline in prices that is a correction, not a crash.
Employment Report:
We do have some good news. Employment remains very strong. When employment is strong, there is demand for housing. Unemployment may be increasing but we are starting at a very low level of 3.3% in AZ in August. The labor force grew by 5.7% or nearly 192,000 which is good and more people are working. Hourly earnings are up 6.7% in AZ, ahead of the national increase of 5.3%.
In 2009 we had an employment crash. The majority of our local jobs were in hospitality or real estate, both of which were devasted by the Great Recession. Today our employment is very diverse, we have more of everything. Great diversity not only saved us during the pandemic because it was spread out, but it also actually grew. Despite the continued headwinds, the economy and employment are strong. And more jobs are on the way.
Final Thoughts:
Sales are down a lot. Expect low sales counts as long as we have low demand and low inventory.
This is a good time to buy for those not-so-perfect buyers. Don’t wait for better conditions, then there will be more competition, likely in Q1 2023.
The Greater Phoenix economy is doing great.
Expect to see more concessions and it will likely reach 25%. Prep sellers that it will take about 2 months to sell their houses. Sales over list will continue to decline. Sales per month are declining quickly. Prices will likely decline slowly. We do not have an oversupply of homes right now. The best (not needing a lot of work) homes are still selling quickly.
This too shall pass. It is always darkest before dawn.
Sarah Perkins is an award winning account executive and has been in title sales since 2004. As the Director of Industry Research & Senior Account Executive, Sarah’s role is to bring real estate transactions to Navi Title. Sarah supports her clients by helping them navigate the ever-changing real estate space through thorough research and understanding of current trends impacting today’s home buyers and sellers.
Today is all about the AZ market. Recently, Clear Title hosted a Market Update with the Cromford Report’s Tina Tamboer. She always shares pertinent and timely information. Below I have combined a lot of her information from her presentation, along with additional information from my research.
Before diving in, our first episode of Beyond the Transaction Podcast is available now. Our first guest was the illustrious Tina Tamboer! To listen and subscribe, click here.
To learn more about a Cromford Report membership, click here. To register for our September 14th Cromford Market Update with Tina Tamboer, click here.
July was rough, but…
Nothing lasts forever and things are getting better. There is good news we have seen a week of improvements. Remember, it takes 3 weeks to make a trend so fingers crossed this is not an anomaly. Contracts are up. Cancellations are down. New listings are not coming to market as quickly. Demand is declining at a slower rate. The increase in activity is likely due to the few rate drops we have seen lately and shows us that the demand is there waiting for the right price.
The stock market overall actually had a great July despite builders not feeling as optimistic as they were only a few months ago.
Affordability:
Affordability remains a major issue. Sellers can only sell to people who can afford to purchase the property. The same goes for landlords who can only rent to people who can afford the monthly payments. If sellers sell for less than anticipated or landlords rent for less than anticipated, they are not losing money they are experiencing a less than expected return, not a loss. The challenge to affordability has slowed the market to a crawl and it has caused fear that the situation is similar to drops we have seen in the past. The majority of the liability is held by Wall Street and private venture capital firms and not individuals.
The US Census data we have to use for income is terrible (self-admitted). Bad data leaves a lot of wiggle room for variation. The data used in the affordability index is only released annually so take this with a grain of salt. In the past, Greater Phoenix was always more affordable than the country as a whole. We used to be the cheapest big city in the country. Not anymore. In Q2 2022 our affordability index dropped from 43.9 to 22.3. The normal range is 60-75. The national level for Q2 2022 was 42.8.
Intended Use:
Primary residence transactions provide market stability, which is why real estate is less stable than it used to be. Redfin’s CEO, Glenn Kelman explained why changes are speeding up in real estate, “I just think as Wall Street owns more of Main Street, the housing market will look more like the stock market, which is extremely volatile.” He went on to explain that investors are more likely to make drastic price drops to move inventory, which complicates selling for regular homeowners competing with institutions – which represent one-third of the available national market.
Q2 2021 was the first time we saw a huge decline in primary residence home ownership in Greater Phoenix. Many were pushed out of the market by cash investors who accelerated price appreciation.
From 2015-2019 owner occupied purchases averaged 70%-76% of the market.
In 2020, owner occupied purchases averaged 80%-83% of the market.
In Q4 2021 that number dropped to 64%.
Q2 2022, through June, the number declined to 62%.
Q2 2022, through June, saw 36% of sales going to investor buyers.
Second home buyers peaked in Q4 2021 at 13.5% and declined to 12.2% in Q2 2022.
Second homes are scaling back at a normal seasonal rate. In Q2 2021 iBuyers and institutional buyers went on a purchasing rampage leaving the consumers behind. The only way to make money from consumer spending is to stay within the general confines of affordability. Essentially saying, if no one can afford to buy the product, no one will buy the product. The group that is in the best position, owner occupied buyers. Anyone who purchased 12+ months ago remains in good shape in their ability to resell. Remember, prior to the pandemic, the rule of thumb for purchasing a property is that it takes two years to recoup the investment.
Investor Flips:
A property is considered a flip if it is acquired and sold within a 6 month period. It is tougher to turn a profit on a flip property in a balanced market. The savvy local investors know how to operate in shifting markets. Flip sales peaked in March and by June dropped by over 39%.
The iBuyer model has only ever operated in seller’s markets. Launched in late 2014, Opendoor, the first iBuyer, has only ever operated in seller’s markets and is struggling to manage today’s market. Opendoor currently has 10% – 12% of today’s active listings while it only has about 3% of the current sales. Opendoor seems to be slashing prices in order to get more under contract. Offerpad is not aggressively slashing prices and therefore continues to have far more active listings than pending listings. iBuyers are still acquiring property, offers are now coming in about $100,000 under what seller expectations.
The FTC’s $62M fine against Opendoor is about 2018 and 2019 advertising. Not for today’s current acquisition and sale environment.
Contract Ratio:
The overall market is in balance now. There are some lingering hot markets but those are cooling quickly as well. There are only 3 areas with cold markets, one in Gilbert, one in Avondale, and one in south Scottsdale. These are changing quickly.
The good news is that the contract ratio is no longer dramatically plunging, it has slowed into more of a glide down. The increase in contract activity offset the inventory coming to market. Hopefully, this is the beginning of a trend! We need more data to be sure.
The dramatic rate of change is slowing. The contract ratio is a bit colder than it was in 2014, the last time we had a balanced market. There is a difference between normal and balanced markets. Normal is based on long term averages. For example, normal supply (long-term average) is about 20,000 to 25,000 available properties. Normal under contract is about 9,000. Balance is when supply and demand meet. The under-contract count matters the most. The $1M+ is still a warm market. The contract ratio for the luxury market is around 38 when it normally is around 10-15. This is likely due to the extremely low inventory count in this segment. There are currently over 700 $1M+ properties in escrow.
Emotions & the Market Cycle:
The market is moving through the regular market cycle. Sellers are going through the stages of grief and are currently in denial. The sellers need to understand this market is different. They have to fix up their properties. They missed the peak of prices, and that is ok. Once sellers arrive at acceptance then they will be able to sell their home. The severity of each part of the cycle depends on the market. If we see a continued increase in contracts then despair may be short-lived.
Days on Market:
There are 3 stages in a market shift. The first is price reductions which have increased, further details are below. The second is an increase in days on market. That has definitely increased. On May 1 the median days on market prior to contract was 7. It is now up to 25. People are upset about it. When you see an increase like that it is unnerving but historically speaking it is great. In 2007 the median days on market prior to contract reached 130 days. And that was before prices crashed! The third stage is an increase in seller concessions, which we are seeing. More details on that are below also.
Price Reductions:
Weekly price reductions have increased 746% over the past 5 months. About 23% to 26% of active supply is dropping prices weekly. The median reduction is $13,000. This does not mean prices are crashing. These are list prices coming down significantly which are down 18% since the market began shifting 5 months ago.
Sales prices are down about 4% since May. List prices are coming down which is bringing the prices down to where the buyers are. It is not crashing the market. Sales prices are not as far down as list prices.
Mortgage rates declined and even dropped down below 5% which stirred buyer interest. When rates go down monthly costs go down. Combined with declining prices, payments fell 5.7% since June.
Payments:
Our market is still not affordable. The median monthly payment for the median home selling at $450,000, with 10% down is $2,674. For that to be within the affordable range, household income needs to be at $115,000 a year. Based on the estimated Greater Phoenix median household income of $88,800, in order for payments to be affordable, they have to be $2,072 a month. The median monthly rental payment is $2,250 which is affordable for a household income of $96,000 a year.
Interest Rate Buy Down:
A great way to bring down the monthly costs for a buyer is to do an interest rate buy-down. A seller can buy down the buyer’s interest rate. There are different options for these and be sure to discuss the details with your lender as there are a lot of conditions. There is a permanent buy-down option or a 2-1 buy-down which drops the buyer’s interest rate by 2 points for the first year of the loan and 1 point for the second year of the loan. By year 3 there is the potential for more desirable interest rates. Market the monthly payment, not the asking price. Be sure to note that some of these concessions could actually be cheaper than a price reduction.
These are estimates only, talk with your lender for actual costs and details:
Seller Concessions:
In August 9.6% of all closings included a seller concession, up from 7.1% in July. The long-term average is 25%. Expect this number to increase. Offers are not as clean as they were but this is also allowing sellers to make fewer price reductions.
Weekly accepted contracts are up week over week but remain down 24.1% year over year. The percentage of seller concessions is increasing weekly. This is an unseasonal increase in weekly accepted contracts. It is likely due to interest rates and increased seller concessions. This tells us that the demand is there, but it is right below the surface, and likely will emerge when rates drop down below 5%. That is not a trend yet, but it is exciting.
Supply & Demand:
Active listings are not increasing as quickly. In July there were 1000 new active listings added a week and in August it dropped to 500 new active listings being added in a week. The decline in new listings help stabilize the market and will help the existing sellers. Not on the 2005 track anymore. During 2006-2007 there were about 3500 new active listings added a week. We are nowhere close to that. We could be reaching a normal realm though.
Demand has stopped dropping and the luxury market is showing signs of normal seasonality. WOOHOO!
Cromford Market Index (CMI):
The best tool for predicting future price appreciation trends and is available on the main page of the Cromford Report: https://cromfordreport.com/ (without a subscription)
100 is balanced and prices rise at the rate of inflation (currently 9.1% nationally, 12.3% in Greater Phoenix), below 100 is a buyer’s market, above 100 is a seller’s market, prices drop below 90, prices rise at 110.
Between 90 – 110 prices roughly follow the rate of inflation.
Yesterday we were at 107.4
All-time high: 3/14/2021 at 514.9
2022 High: 2/7/2022 at 474.6
One month ago, 7/25/2022 it was 131.6
CMI is the predictor, it moves first and then appreciation follows. Cannot predict the CMI. It tells us where we are.
Our market is officially in balance. When we are in balance homes appreciate at the rate of inflation. The math does not support a crash or lots of price declines. We could see a short buyers market. We won’t see a price crash but a price correction could be 10-15%. Right now, we are looking at a 4% decline so far since June.
In 2007 we had 57,000 active listings with only 4,000 under contract. That was a crash. Today we have about 19,000 active listings and 8,800 under contract, not a crash but yes to a correction.
The CMI’s decline is slowing and the curve is turning into a balanced market. Demand is declining more slowly and supply is being added more slowly, together this is creating some stabilization.
Broken down by city, the top seller markets are Fountain Hills, Paradise Valley, Scottsdale, Cave Creek, and Goodyear. The cities in balanced markets are Avondale, Phoenix, Mesa, Glendale, Peoria, and Chandler. The cities in a buyer’s market are Surprise, Tempe, Gilbert, Maricopa, Queen Creek, and Buckeye. New home communities add supply which brings them into a buyer’s market faster than the areas without new construction.
Prices:
The sale price to list price ratio is now 97.9% (from the last list price, not original) Sellers are getting about 98% of asking. A normal, balanced market is about 97%. In May it was 101.7%.
The median sales price in May was $480,000. August to date is $450,000 which is a 6.25% decline. Year over year prices are still up 11%. It is still higher than the rate of inflation. We are looking at about a 2% decline a month, not a crash.
Today the average price per square foot is ($293.79) up from July ($289.86) but down from May ($306.01). Sellers are getting more for each square foot. Year over year average price per square foot is up 17.3%. Averages change when there are fewer luxury sales. Overall we have seen a 4% drop since the peak in May, which is a 1.3% drop a month. If we stay on this trajectory, we could see another 4% decline by the end of the year. We could see a total decline of 8% this year. That is a correction, not a crash.
2005-2008 Bubble Vs. 2022
The biggest risk to all housing markets is vacant homes.
2005: HIGH VACANCY & HIGH FORECLOSURE RISK:
False demand leads to vacant properties and vacant properties lose value.
Bad financing: 100% (or more) loans, interest-only loans, no equity
Lots of speculation: no intention of occupying the property
Overbuilt for 10 years, no labor or supply shortages, built quickly
2022: HIGH EQUITY, LOW FORECLOSURE RISK, LOW VACANCY RISK
Good loans with significant down payments
Cash does not foreclose
Stable buyers
Intent to occupy
New home development struggles to keep up with demand
Wall Street’s returns may be lower than expected, rentals/short term: moderate risk of vacancy due to potential pull back on rentals
Lack of water creates a high risk of vacancy
The common denominator between the 2005 and 2022 markets = Wall Street. People always take more risk when spending other people’s money. A flood of capital in any sector often creates chaos. In 2005 investors put all of their money in lending and mortgage-backed securities (MBS). The Dodd-Frank Act prevents that from happening again. The risk for today’s investors is a lower than expected return, not a flood of foreclosures.
We do have to watch water, the outskirts are impacted the most. People will not be as interested in buying or renting if there is a water shortage. Expansion will be restricted in areas with stressed water resources. It will likely push more density in areas with a solid water supply. Water supply could impact future housing demand in shortage areas.
Distress?
Today’s desperate sellers are ibuyers. A balanced market is tough on iBuyers. Both Opendoor and Offerpad purchased far more houses than they are selling. And their model requires continuous purchasing. Both companies are seeing huge inventory increases and few sales.
Investors pushed the market further than it could bare so they are pulling back and that is why the market is crumbling now. Most price declines are leading to lower than expected prices but owners are not losing money.
In July there were 238 notices of trustee sale (pre-foreclosure) recorded. In July 2019 there were 465. In 1996 there were 515. In 1996 there were more than double today’s amount and back then Gilbert was a farm. Kierland and the 101 didn’t exist. The population of Greater Phoenix was significantly lower. Foreclosures are not currently posing a big threat to the market.
Final Thoughts:
Welcome to a balanced market. We are currently in stage 3 of the market shift, an increase in seller concessions. We will likely stay here for a while. It is important to set clear expectations with your home buyers and sellers. While the days of the runaway seller’s market are long gone, today’s sellers are not desperate (aside from iBuyers) and will not sell if they do not have to. We are working our way through the chaos and a stable market may actually be in sight.
Sarah Perkins is an award winning account executive and has been in title sales since 2004. As the Director of Industry Research & Senior Account Executive, Sarah’s role is to bring real estate transactions to Navi Title. Sarah supports her clients by helping them navigate the ever-changing real estate space through thorough research and understanding of current trends impacting today’s home buyers and sellers.
Today is all about the AZ market. Recently, Clear Title hosted a Market Update with the Cromford Report’s Tina Tamboer. She always shares pertinent and timely information. Below I have combined a lot of her information from her presentation, along with additional information from my research.
To learn more about a Cromford Report membership, click here.
To register for our August 17th Cromford Market Update with Tina Tamboer, click here.
OMG so much change!
Despite knowing that the market was going to normalize – no market lasts forever, especially not savagely unbalanced, unsustainable markets – but the speed of this change has been surprising, to say the least.
The Greater Phoenix residential real estate market has seen 15 weeks of change but in the past 4-5 weeks that change has been amplified by a lot.
What affects demand?
Population growth
Every person, whether a renter or owner, is an element of demand.
We still have population growth, but it is slowing, it is possible for population growth to happen without increasing demand, when there is household consolidation. That increases vacancies and roommates.
Relocation (inbound)
Households relocating from outside Greater Phoenix brings one excess element of demand without adding to supply.
Household formation
Population doesn’t need to grow for demand to grow if new households are forming. You can increase demand without population growth. Household formation is mostly related to affordability.
When 1 household splits into 2 (growing), one excess element of demand is created.
When 2 households merge into 1 (shrinking), one element of demand is removed.
The latest household formation data is from March. It is expected to fall in the next release.
Affordability
Employment/income – impacts household formation and affordability
Appreciation/depreciation
Appreciating home prices decrease affordability and decrease demand.
Depreciating home prices increase affordability and increase demand (eventually but not immediately)
Interest rates (can offset effects of Appreciation/Depreciation)
Lower rates increase affordability and increase borrower demand
Higher rates decrease affordability and decrease borrower demand
Over the past 4-5 weeks interest rates have been very volatile, moving from 5.3% to 5.8% and back to 5.2% in only a week. It makes it very difficult for buyers to lock in. Buyers will freeze because they are waiting for some stability, so they feel more confident locking in a rate.
Loose/tight lending practices (can offset effects of interest rates)
Loose lending practices increase demand.
Tight lending practices decrease demand.
The affordability rate was awesome right when the pandemic hit. 70% affordability. Then we dropped below normal within a year.
Many investors are only now learning that they cannot continue to push the prices up forever. Eventually, the population will need to be able to afford these prices. Not everyone can afford the properties that were flipped.
36% of homes that are currently active were bought in the past year.
25% of homes that are currently active were purchased in 2022.
Those who bought homes in 2020 or earlier are fine.
Consumer Sentiment – could the most important factor
Emotions, such as euphoria or utter despair, based on speculative opinions or unreliable forecasts can cause some home buyers to make decisions that are not in line with market indicators.
This is bringing out a lot of emotions. A lot of wealthy people are thinking about selling off their property. When people start to panic sell, more people will panic sell and create a self-fulfilling prophecy. If homeowners think the market is tanking, so they may sell at a discount because they think that is what is what they have to do so then it creates exactly what they are afraid of.
Intended Use:
Q2 2021 was the first time we saw owner occupied affidavits dipping below 70%. As of May, it was 62%. From 2015 through 2019, owner occupied purchases ranged from 70% to 76%. In May, 13% of buyers were second homeowners (slightly above normal), 20% were investors, and 5% iBuyers. The majority of the elevation is investor and iBuyer purchases.
Cash Purchases:
Not a crash. The vast majority of purchases in 2005 – 2008 included loans; only 10% of purchases were cash. Lots of risky loans. Foreclosure crises come from too many bad loans. Now investors own the properties free and clear.
Cash purchases have been growing. 30% of buyers pay cash. Cash doesn’t foreclose. We are not looking at a looming foreclosure crisis. News media is very far behind. The only way to keep up with the market is to follow exactly what is happening as it happens; ignore the noise.
Interest Rates:
By rapidly raising interest rates to tame inflation, the Fed pulled the emergency brake on real estate. Is Chairman Powell channeling inner his inner Chairman Volker? He was the Fed’s chairman in the 80s who rapidly increased rates. At the end of both of the 1980s recessions, mortgage rates declined. Many people already believe we are in a recession, or we are going into a recession very soon. Interest rates always tend to drop sharply at the end of a recession. The ability to refinance is likely if the recession happens soon or now.
The majority of owners have payments that are much lower than today’s rents. People are not going to walk away from fixed mortgage payments that are lower than rents. They won’t, even if property values decline by 10%. Predictions planning a mass foreclosure crisis are unfounded. No homeowner wants to walk away from their equity. It makes no pragmatic sense. Why walk away to pay more in rents because prices will come down from the peak?
Interest rates don’t stay high or low forever. They always change. Nothing is forever. None of our markets are forever. The only constant is change.
Buyers primarily focus on monthly payments. The only market that matters is the market we are in right now. We can’t know what will happen but we do need to understand how we got to where we are.
15 weeks ago, mortgage interest rates surpassed 4.4%. Supply started increasing slowly. It was a very subtle turn. By April, after rates increased above 5%. Supply shot through the roof. The rate volatility has created chaos for buyers. With the lack of stability buyers have sidelined themselves.
Also, about 15 weeks ago we saw a big stock market drop. Anything that is Wall Street based is impacted. Wall Street funded institutions started pulling out of escrows. Similar to what happened at the onset of Covid. Corporations act more slowly. They stopped writing contracts. How long will Wall Street stay on the sidelines? We do not know.
Contract Ratio:
Welcome to balance. Unfortunately, it comes with a high interest rate. Buyer’s markets are loser’s markets. Seller’s markets are winner’s markets. Buyer’s markets have fewer buyers.
Seller’s markets are a dump your junk market. Everything sells in extreme seller’s markets.
Buyer’s markets are great for buyers that need more help. We will see more down payment assistance, lower down payments, first time buyer programs, FHA loans, etc. This is great for buyers who need a little help getting into a home.
The contract ratio looks at how many homes are under contract relative to how many are on the market. And it moves faster than the Cromford Market Index (CMI). It is not seasonally adjusted, and the ups and downs are more visible. On June 2 the market was still in a frenzy. By July 11 the market was warm. A warm market is a balanced market.
15 weeks ago, the contract ratio was 249, last week it was 53.2. A contract ratio of 30 – 60 is considered balanced, above 60 is hot, above 100 is a frenzy. Below 20 is a cold market. We have been living in a frenzy for 1.5 years. It is not normal to have more under contract than what is available on the market.
Are we at normal supply yet? That is a very typical question that isn’t easy to answer. Inventory counts are not that far from 2018-2019 counts. 2014 was the last balanced market we had. There were 20-25K properties on the market in 2014. A balanced market is when the number of available listings and the number of properties under contract correlate.
With a contract ratio of 53 the market is in the warm stage, balance. The contract ratio is lower than 2018 and 2019. It isn’t about the supply number it is about how many are in escrow. We should have between 10-11K in escrow for July. But only 7700 are in escrow so we are moving towards a buyer’s are market.
Everything listed over $400K is in balance.
Days on market prior to contract is now at 17 days or 3-4 weeks. Expect it to continue to slow. For any new listings, prepare sellers for 4 weeks of active status. Expect price reductions and seller concessions. There are 143.9% more listings on the market this year than there were last year. The $400K-$1M price range has had the biggest increase in available supply.
The Market Cycle:
The market is cyclical. There are different emotions associated with the different stages of a cycle. Speed up the process and the emotions gain intensity. Capitulation is the action of surrendering or ceasing to resist an opponent or demand.
Price Reductions:
The first indicator of a balanced market is an increase in price reductions. The first wave of reductions makes a difference, but after multiple reductions the price drops don’t matter as much. Sellers have to do more to get their houses sold.
Price reductions have increased by 496% in 15 weeks. The overall median price reduction amount is $15,000.
Listings under $200K had a $10,000 median reduction
Listings at $200K – $400K had a $10,000 median reduction
Listings at $400K – $800K had a $15,000 median reduction
Listings at $800K – $1M had a $25,000 median reduction
Listings at $1M – $2M had a $50,000 median reduction
Listings at $2M – $3M had a $100,000 median reduction
Listings over $3M had a $152,500 median reduction
Interest Rate Buy-Downs:
As the institutions have pulled back sellers have to focus on traditional buyers. The median sales price is slightly down from $469,000 (May) to $459,000 (July). But the payments are about the same because the interst rates are keeping the payments high. Price reductions don’t have the same impact when rates are going up.
December’s interest rates and median price worked for the median annual household income of $88,000. They do not today with higher rates and higher sales prices.
The median monthly payment for the median house is $2,745. The median rental rate for the same median house is $2,295. We have to beat rent prices to make buying desirable. In order to do that we have to pull out an old tool that hasn’t been used in 10 years.
The interest rate buy-down. A seller can buy down the buyer’s interest rate. There are different options for these and be sure to discuss the details with your lender. There is a permanent buy down option or a 2-1 buy down which drops the buyer’s interest rate by 2 points for the first year of the loan and 1 point for the second year of the loan. By year 3 there is the potential of more desirable interest rates. Market the monthly payment, not the asking price. Explain what this means to buyers. Do something different than the competition. Advertise something different. Get creative.
This is an estimate only, talk with your lender for actual costs and details:
Scenario 1:
Based on the July 9 median price of $457,000 at a 5.3% interest rate the estimated PITI is $2,733, if a seller does the median price reduction of $15,000 it will save the buyer about $86 a month.
Scenario 2:
A permanent buy-down may cost around 3% of the loan amount, assuming a purchase price of $457,000 at 5.3% and a 10% down payment, a permanent buy-down of 1% could cost the seller $12,339. A 4.3% interest rate would save the buyer $248 a month.
Scenario 3:
A 2-1 buy down may cost around 2.2% of the loan. Assuming a purchase price of $457,000 at 5.3% and a 10% down payment, a 2-1 buy down could cost the seller $9,048. The 3.3% interest rate the first year would save the buyer $481 a month. A 4.3% interest rate the second year would save the buyer $248 a month.
If a seller is willing to give up the money in a price reduction, the seller may be willing to pay for the buy-down option instead.
Supply:
For sale and rental inventory is up!
The MLS rental supply is up 111% since September 2021.
The MLS rental supply is up 51% since January.
One investor increased the rental inventory by 12% in only 3 days.
Always check rental supply and rates. More people are renting, and we are seeing more roommate situations. So far in July, 37% of leases closed below asking. Last year it was only 22%.
Homes for sale on the MLS increased by 220% in 15 weeks.
Homes for sale on the MLS increased by 144% year over year.
Most price points have more competition.
Sellers are rushing to sell to get the peak price, but we are already past the peak. Weekly new listings are outpacing every year since 2000 except 2006 and 2007.
Investors and flip models are driving many of the newest listings. This is unusual.
25% of active listings were purchased since January.
11% of active listings were purchased in the second half of 2021.
36% of active listings were purchased in the past 12 months.
52% of all active listings are vacant. Not normal.
13% of active listings are new builds.
12% of active listings are iBuyer owned.
Owner occupied listings have an advantage. Showing a lived in house looks good. This is not your as-is market. This is the best of the best of the market. ibuyers are still buying homes right now. They are not positioned to hold properties.
Demand:
It is always important to watch new listings (supply) and new contracts (demand). When the market shifts there is always a change in either supply or demand. Buyer demand has fallen off a cliff, which ultimately was the intention of the Federal Reserve. 40% of inflation is housing.
5 weeks ago demand took a dive. Prior to that, in June, we were ok, hanging around normal-ish demand. And when the first institutional buyers not only stopped buying but cancelled existing contracts, demand tanked. Combine that with the interest rate fluctuations, most traditional buyers have been sidelined. We need to get more buyers into the market. Teach awareness of ways to make payments better.
15 weeks ago was a great market for sellers. And now there are fewer properties under contract than there were in 2014, our last balanced market. Based on the trends it is not going to get better before the end of the year.
Greater Phoenix’s weekly accepted contracts are trending lower than any week of 2021, aside from the very last week of the year. Listings under contract are down nearly 26% year over year.
The one sector that has not been crushed by fluctuating interest rates are homes listed at $3M and up. Typically, this market is not as rate sensitive, but it does tend to be impacted by stock market fluctuations. At this point, we haven’t seen the impact of the falling stock market, but we may still.
Properties falling out of escrow is increasing. It isn’t super high but is an important number to watch. Canceled listings is increasing rapidly, 2021 had very few cancellations. Despite the increase, the cancellations are not enough to significantly slow the increase of supply. Expired listings are also increasing rapidly.
Cromford Market Index (CMI):
The best tool for predicting future price appreciation trends and is available on the main page of the Cromford Report: https://cromfordreport.com/ (without a subscription)
100 is balanced and prices rise at the rate of inflation (currently 9.1% nationally, 12.3% in Greater Phoenix), below 100 is a buyer’s market, above 100 is a seller’s market, prices drop below 90, prices rise at 110.
Between 90 – 110 prices roughly follow the rate of inflation.
Yesterday we were at 139.1
All time high: 3/14/2021 at 514.9
2022 High: 2/7/2022 at 474.6
One month ago, 6/20/2022 it was 210.2
CMI is the predictor, it moves first and then appreciation follows. Cannot predict the CMI. It tells us where we are.
There is no number that defines normal. It is about the relationship between supply and demand. When the numbers for supply and demand are the same, the market is in balance.
Property value is declining while rate of appreciation is still positive. Values are declining but the seller (as long as they owned 1 year or more) won’t lose money. To lose money on a house a homeowner has to sell for less than they paid. Losing money if they are selling with in a 6 month period. Historically it took about 2 years of ownership before purchasing costs are recovered.
It is mostly buy and hold investors losing money. They are only getting slightly less than expected but a large scale. Regular owners are in really good shape. Watch what was actually invested in the property.
Supply is rising faster than demand is dropping. Month over month prices were flat from May to June and will decline from June to July. We are getting close to year over year declines but supply has to be bigger than demand for year over year prices to drop.
In 2007 it was builders and homeowners who couldn’t afford their payments who listed their homes and spiked inventory. Today’s homeowners are credit worthy, have great interest rates, and can afford their payments. They are not flooding the market with listings. Investors are listing property. Many investors paid cash, which does not foreclose.
Prices:
Sales prices represent what the market was like 4-6 weeks ago. In July there has been a sharp median sales price decline. The year over year appreciation rate in June was 19% up. So far the year over year appreciation rate is only 13% up. This is a bigger decline than normal. It usually drops off the second half of the year. Expect each month to have a smaller and smaller year over year appreciation rate.
Sale Price to List Price Ratio:
As of July 10, nearly 37% of listings closed over asking for a median of $10,000 above. Both the amount and percentage are dropping and will likely be down to 2%-3% of sales close for over asking in August.
June ended with a sale price to list price ratio of 100.0%. It is coming down now. Do not expect full price offers in July. Currently, the rate is 99.3% A decent seller’s market often sees a 98%-99% ratio. A balanced market has a ratio around 97%.
Seller Concessions:
25-28% of closings with concessions is normal. We are up to about 5.5% now. This is the third stage of a shift. First days on market increase, second price reductions increase. Third, seller concessions increase. Expect this number to continue to grow.
Distress? Nope!
Today’s desperate sellers are ibuyers. A balanced market is tough on iBuyers. Both Opendoor and Offerpad purchased far more houses than they are selling. And their model requires continuous purchasing. Both companies are seeing huge inventory increases and few sales.
Investors pushed the market further than it could bare so they are pulling back and that is why the market is crumbling now. Most price declines are leading to lower than expected prices but owners are not losing money.
Mortgage credit availability will not increase anytime soon. Most lenders believe that people will be refinancing in the next 3 years. It is tough for investors to want to increase credit because they make all of their money in the first 3 years and the lenders know people will refinance as soon as rates decline.
Not seeing a lot of pre-foreclosures or foreclosures, we are still running below 2019 numbers. A notice of trustee sale is a pre-foreclosure. A homeowner is given 90 days notice. The current median days on market before a contract is 17 days.
Final Thoughts:
Buying is fun again. All month over month metrics are down. This can be scary for the industry yet it is necessary for the market. The severity of the previous year’s imbalance is unsustainable.
Sarah Perkins is an award winning account executive and has been in title sales since 2004. As the Director of Industry Research & Senior Account Executive, Sarah’s role is to bring real estate transactions to Navi Title. Sarah supports her clients by helping them navigate the ever-changing real estate space through thorough research and understanding of current trends impacting today’s home buyers and sellers.
Sellers have less power than they did only 6 weeks ago. The market is very different than it was recently. It is not catastrophically bad, but it is far trickier than it was.
National Real Estate:
Available single family inventory increased to 491,000 or by 3.25% two weeks ago, a 31% year over year increase and 60% up from the bottom in early March. Based on the steepness of the increases, there are no signs of slowing.
There was an increase in new listings during the week of the 4th of July, a first in over seven years.
31.5% of active listings in the largest metros reduced their price in June. Boise had the highest rate of reductions at 62%. For the city specific price reductions, click here.
About 60,000 purchase contracts were canceled in June, or about 14.9% of all homes that went under contract during the month.
More than 50% of builders also saw an increase in contract cancellations in June.
Purchase loan rate locks (a way to measure demand) were down 10.8% from May to June and down 22.7% in Q2 2022.
81% said the economy is on the wrong track, an all-time high.
20% said it was a good time to buy, an increase from May’s all-time low of 17%.
26% said it was a bad time to sell, an increase from May’s 19%.
27% expect prices to decline in the next 12 months, an increase from May’s 24%.
Real Estate News:
One of the previously thrown out commission lawsuits against NAR and others, which seeks class action status, has been amended and is back in court. The suit alleges price fixing on commissions damages buyers.
Due to the 9.1% inflation rate (12.3% in Phoenix) the Fed could raise rates by up to one full percentage point.
Final Thoughts:
In Tom Ruff’s June STAT report, he wrote about a recent article that accurately describes our current situation. He wrote:
“As “affordability issues take their toll”, it has become much more difficult for traditional buyers, particularly first-time buyers, to purchase a home. In the link just provided, a report done by First American Financial Corporation lists Phoenix as the fifth city in the country where affordability has declined the most year-over-year at 56.1%. Charlotte, North Carolina, led the nation at 62.5%. In the report, Mark Fleming, Chief Economist at First American, reiterates what we already discussed, ‘The pandemic-driven supply and demand imbalance that fueled historically strong house price appreciation is coming to an end as the housing market rebalances to a new normal.’”
Sarah Perkins is an award winning account executive and has been in title sales since 2004. As the Director of Industry Research & Senior Account Executive, Sarah’s role is to bring real estate transactions to Navi Title. Sarah supports her clients by helping them navigate the ever-changing real estate space through thorough research and understanding of current trends impacting today’s home buyers and sellers.
Today is all about the AZ market. Recently, Clear Title hosted a Market Update with the Cromford Report’s Tina Tamboer. She always shares pertinent and timely information. Below I have combined a lot of her information from her presentation, along with additional information from my research.
To learn more about a Cromford Report membership, click here.
A lot is happening in housing and there is no reason to panic. The market of the past two years is unsustainable. In order to get to the calm of a more balanced market, we have to go through the chaos of change.
In order to really see what is going on in Greater Phoenix real estate, we have to take a granular look at exactly what is happening right now.
Interest Rates:
Interest rates are never low or high forever. Sometimes they come down as fast as they go up. In 2018, it took 10 months to go up and 6 months to come down.
The speed of movement hasn’t been like this since the 1980s. The speed is comparable to the 80s but the actual rates are very different.
Look at the changes during a recession. What do interest rates do during recessions? At the end of all of the past recessions, interest rates dropped. If we are going into a recession, then we will likely see rate drops towards the end. Aside from 2008, most recessions last only about a year.
In time rates will likely come down. Remember people buy payments. They are watching payments. Potential buyers should buy now, start building equity, and refinance later when rates drop. Homeownership is the greatest creator of wealth in the US, this is true regardless of interest rates.
Active Supply:
This is the chaos. Active inventory is up 86.2% year over year and up 108% in 10 weeks. Listings are rising and demand is down, causing inventory to grow even faster.
New listings are up 11.2% year over year. We are just coming in over 2021 but not higher than 2005. Before the crash of 2008, we had a ton of new listings. This does not mean the market will crash. We are at an inflection point though. Are the numbers turning seasonal or will there be an acceleration of new listings? It is important to watch these numbers.
Accepted Contracts:
There is always a drop in accepted contracts over Memorial Day weekend. Newly accepted contracts were down 11.3% year over year. There will be another drop off for the 4th of July weekend. Expect the decline to continue. The accepted contracts are matching the pace of 2019. This is another metric to track.
Pending listings have declined in each of the past four months. 10 weeks ago, listings under contract started coming in lower than in 2021. Now that count is 15.9% below last year’s count. About a year ago the market started normalizing when Zillow and Opendoor both went on a purchasing rampage, creating the frenzy of the second half of 2021. That will not happen again this year.
29% of buyers in April paid cash. Investors are not buying everything.
Supply & Demand Changes:
Overall, active supply is up 92.4% year over year and at the same time listings under contract is down 15.9% year over year. Buyers are seeing inventory rise after two years of rejection. Now is the time to prepare your sellers for what is happening right now. Today’s market is very different from the market of only a few months ago.
$300,000 – $400,000 listings
Active supply up 23% year over year
Active supply up 84% in 10 weeks
Listings under contract down 45% year over year
Listings under contract down 36% in 16 weeks
$400,000 – $1.5M listings
Active supply up 174% year over year
Active supply up 105% in 7 weeks
Listings under contract up 29% year over year
Demand is still quite high but there are way more listings coming on the market, many sellers do not want to miss the top of the market. If it were following seasonal patterns, demand will flatten.
$1.5 – $3M listings
Active supply is still low compared to previous years
Active supply up 38% year over year
Active supply up 112% in 10 weeks
Listings under contract up 6% year over year but on a steep decline, will fall below 2021’s numbers in the coming weeks. If following normal seasonality, this will decline through the end of the year.
Over $3M listings
Active supply up 20% year over year
Active supply up 34% in 12 weeks
Listings under contract up 19% year over year
Flip investors, private landlords, and first time home buyers tend to buy below the median. The current median is $480,000. There are not very many listings available below $480,000. This has impacted first time buyers and investors on a budget, there is both a lot of competition and profits are lower for flippers in the lower price ranges.
If this market slows down enough, down payment assistance programs will likely increase. There is aid available but only when demand is low enough will sellers accept offers from buyers utilizing the programs. This is not seasonal.
Price Reductions:
Price reductions are often the first indicator of a market shift. When buyers believe they can afford the asking price is when they will come into the market.
$300,000 – $400,000 listings
Price reductions are up 208% in 10 weeks
Median amount reduced: $10,000
$400,000 – $1.5M listings
Price reductions are up 302% in 10 weeks. In the same 10 week period listings under contract are down and inventory is up. Sellers need to adjust accordingly.
Median amount reduced
$400K – $500K: $10,000
$500K – $600K: $10,000
$600K – $800K: $12,000
$800K – $1M: $25,000
$1M – $1.5M: $50,000
Over $1.5M listings
Price reductions are up 172% in 10 weeks.
Median amount reduced
$1.5M – $2M: $77,500
$2M – $3M: $136,000
Over $3M: $187,500
Days on Market:
Behind price reductions, the second indicator of a market shift is an increase in average days on market prior to contract. For most of the year, listings were on the market for 7 days prior to accepting a contract. In May, that number hit 9 days and by the end of May it was up to 11 days. May’s increases were quick and with more inventory coming to market, this number will continue to increase. Sellers will need to adjust their expectations from an offer coming in one week to two weeks.
Contract Ratio:
Housing is no longer in a frenzy. A frenzied market is when there are more properties under contract than there are on the market. The contract ratio for a frenzy market is over 100. A month ago listings up to $2M were still in a frenzy. Each week another price range dips below frenzy level. With a contract ratio of 98.3, we are still in a very hot seller’s market. A year ago the contract ratio was 224.8. A normal contract ratio is around 85.
The decline in contract ratio is more about increased inventory than it is about decreased demand. Inventory has grown faster than demand has declined. The recent drastic declines in the contract ratio represent the chaos before the calm.
Cromford Market Index (CMI):
The best tool for predicting future price appreciation trends and is available on the main page of the Cromford Report: https://cromfordreport.com/ (without a subscription)
100 is balanced and prices rise at the rate of inflation (currently 8.6%), below 100 is a buyer’s market, above 100 is a seller’s market, prices drop below 90, prices rise at 110.
Between 90 – 110 prices roughly follow the rate of inflation.
Yesterday we were at 227.6
All time high: 3/14/2021 at 514.9
2022 High: 2/7/2022 at 474.6
CMI is the predictor, it moves first and then appreciation follows. Cannot predict the CMI. It tells us where we are.
There is no number that defines normal. It is about the relationship between supply and demand. When the numbers for supply and demand are the same, the market is in balance.
In 2005, the CMI dropped for 4 months before prices flattened. In the next 3 months, we will likely see a slowing in appreciation rates. Cash investors are still very strong buyers in our market. Less competition so they are offering less.
Supply is 60% below normal. Demand recently fell below normal and is now 7.5% below normal. Supply is increasing faster than demand is decreasing. When demand falls below 100, the number of transactions declines. The closer demand is to 100 or higher keeps transaction counts high. It is better for the industry and overall economy for supply to come up to meet demand versus demand dropping to meet supply.
The CMI declined at record rates over the past 8 weeks. CMI data goes back to 2000 and the last month had the fastest CMI drop on record. With this many outside influences impacting the market, it is impossible to know what will happen next. The CMI can change on a dime. There is no indication that prices will decline anytime soon but this does show weekly declines in the seller’s advantage. Now is not the time to over price a listing. We don’t have desperate sellers. They can wait and not panic sell. Worst case they keep their home and an awesome interest rate for a little longer than planned.
Sales Measures:
Sales measures tell us what happened in the past, not what is happening in the future. The media is using closed sales, past activity, to explain the market. Things are shifting so quickly right now it is impossible to predict the future past 3-4 months from now. The sales measures for the month of May are still very good. But that is not the future, it explains what the market did 30-60 days ago.
May ended with a median sales price of $480,000 and year over year annual appreciation rate of 22%. The sales price to list price ratio was 101.7% (expect this to drop in the next 4 weeks) and 54.6% of homes closed over list price. The third indicator of a shifting market is increased seller concessions (when a seller pays some of the buyer’s closing costs). Currently, seller concessions are low at 4.1% but are just starting to increase.
Flips:
Flips dropped off in April, likely due to the increased interest rates and declining demand.
Opendoor Activity:
Opendoor made its first profit in Q1 2022.
May through November 2021 Opendoor acquired 3,609 properties and sold 1,861. They acquired 94% more homes than they sold.
December 2021 through March 2022 Opendoor acquired 1,408 properties and sold 2,149. They sold 53% more than they acquired.
April 2022 Opendoor acquired 510 properties and sold 494. They acquired 3% more than they sold.
Offerpad Activity:
June through December 2021 Offerpad acquired 1,050 properties and sold 742. They acquired 29% more than they sold.
January through March 2022 Offerpad acquired 201 properties and sold 546. They sold 172% more than they acquired.
April 2022 Offerpad acquired 94 properties and sold 93. They acquired 1 more than they sold.
The iBuyers struggled to turn a profit during the largest resale year in history. The rest of the flip investors did very well. Regular, private flip investors hold properties for shorter timeframes than do the iBuyers.
Rentals:
Available rentals in the MLS is up 26% since the beginning of the year. This indicates that there are more vacant homes. Vacant homes are bad for a housing market.
4.9% of May’s closed rentals closed over list price. 53.5% closed at list price. And 41.6% closed under list price. There are no bidding wars for rentals.
Crash Versus Correction:
A crash is a big drop. A correction is a slight fix. Correction is getting back to where we would be anyway. We are experiencing a disruption. We do not know how long it will last. After the disruption, we will experience a correction. Do not expect foreclosures.
2005-2008 Bubble Vs. 2022
The biggest risk to all housing markets is vacant homes.
2005: HIGH VACANCY & HIGH FORECLOSURE RISK:
False demand leads to vacant properties and vacant properties lose value.
Bad financing: 100% (or more) loans, interest-only loans, no equity
Lots of speculation: no intention of occupying the property
Overbuilt for 10 years, no labor or supply shortages, built quickly
2022: HIGH EQUITY, LOW FORECLOSURE RISK, LOW VACANCY RISK
Good loans with significant down payments
Cash does not foreclose
Stable buyers
Intent to occupy
New home development struggles to keep up with demand
Wall Street’s returns may be lower than expected, rentals/short term: moderate risk of vacancy due to potential pull back on rentals
Lack of water creates a high risk of vacancy
The common denominator between the 2005 and 2022 markets is Wall Street. People always take more risk when spending other people’s money. A flood of capital in any sector often creates chaos. In 2005 investors put all of their money in lending and mortgage-backed securities (MBS). The Dodd-Frank Act prevents that from happening again. The risk for today’s investors is a lower than expected return, not a flood of foreclosures.
There is risk with short-term rentals and second homes. If the investors cannot rent the property, they will sell. If short-term rental owners can’t rent to vacationers, they will go to long-term rentals.
We do have to watch water, the outskirts are impacted the most. People will not be as interested in buying or renting if there is a water shortage. Expansion will be restricted in areas with stressed water resources. It will likely push more density in areas with a solid water supply. Water supply could impact future housing demand in shortage areas.
Final Thoughts:
We are early in the shift. Start bracing sellers for market prices, increased days on market, and potential concessions. Do not expect to see more of the 2% month over month appreciation rates, expect to see an appreciation rate of less than 1% month over month.
The market is attempting to normalize and is doing so quickly. We have to move through the chaos to get to the calm.
Sarah Perkins is an award winning account executive and has been in title sales since 2004. As the Director of Industry Research & Senior Account Executive, Sarah’s role is to bring real estate transactions to Navi Title. Sarah supports her clients by helping them navigate the ever-changing real estate space through thorough research and understanding of current trends impacting today’s home buyers and sellers.
Today is all about the AZ market. On Wednesday, Clear Title hosted a Market Update with the Cromford Report’s Tina Tamboer. She always shares pertinent and timely information. Below I have combined a lot of her information from her presentation, along with additional information from my research.
To learn more about a Cromford Report membership, click here.
Mike DelPrete often says that the real estate industry moves very slowly, and it has never moved this fast before.
Tina agrees, she said, “The market moves very slowly. Once you see a price change, the party is over.” Prices are the last thing to move. This is why prices continue to rise (our median sales price will reach $475,000 in the coming weeks) and yet demand is declining.
There is no need to panic. In order for the market to stabilize, it needs to cool. And while the market is cooling, demand continues to outpace supply.
What affects demand?
Population growth
Relocation (inbound)
Household formation (growing)
The population doesn’t need to grow for demand to grow if new households are forming. You can increase demand without population growth. Household formation is mostly related to affordability.
Affordability (based on the worst census data ever)
Employment/income
Appreciation/depreciation
Interest rates (can offset effects of Appreciation/Depreciation)
Because rates are going up demand may decrease, but prices will not decline. There is still too much demand for the supply, prices are still increasing, quickly.
Loose/tight lending practices (can offset effects of interest rates)
Consumer Sentiment
Emotions, such as euphoria or utter despair, based on speculative opinions or unreliable forecasts can cause some home buyers to make decisions that are not in line with market indicators.
All eyes are on interest rates right now. Nothing moves as quickly as interest rates, right now they are fluctuating wildly. We haven’t seen interest rates move this fast and go this high since the 1980s. Rising rates create more challenges for owner-occupied buyers and not the cash buyers who are usually investors. The higher rates hurt the demand of the people who need to get a loan in order to buy. Owner-occupied purchases declined slightly from Q4 2021 (64.2%) to Q1 2022 (64%). The majority of owner-occupied buyers purchased between $500,000 and $1,000,000.
Absentee owners are buying more houses and paying cash more often. Luxury buyers are competing with second-home buyers for properties. 27.3% of buyers paid cash in February, up from January’s 26.2%. While 72.5% of buyers purchased with a new loan in February, a decline from January’s 73.3%.
Affordability:
The median sales price for the median home sold (1,500-2,000 square feet) is up $92,075 year over year or 25.2%. When you add in the increased mortgage rates (3.06% to 4.72%), payments are up $817 year over year which is a payment increase of 46%.
Using the baseline that housing costs should be about 28% of gross household income, the median household would need to be making $111,000 a year to afford the median house.
Maricopa County has a median income of $80,161 according to the latest from the Census. Now you have to have 2-3 earners to afford a house.52% of families can afford the median house in Maricopa County.
Homeownership Rates:
There are a lot of comments and fear-mongering on social media saying that we are moving towards a renter society. The highest homeownership rate we ever reached was in 2005 when it reached 71%. Homeownership began declining in 2006 until it bottomed out in 2016 at 60% and has been growing since 2016 and in 2020 we reached a rate of 64.3%.
Today’s Borrowers:
At 714, the average credit score in the US is at the strongest point since 2011. Subprime borrowers are nearly nonexistent. Credit scores are high, and today’s borrowers are the strongest ever but they still cannot compete with cash buyers.
Who is going to lend to these people? Only jumbo lenders are doing a lot of loans. Many lenders are not offering a lot of credit. Credit availability is not yet up to pre-pandemic levels. Lenders are working on new loans products but can’t keep up with rising rates and new challenges that come with those rising rates.
With purchase appreciation rates surpassing rental appreciation, it is trickier to explain the benefits of buying but there are still substantial benefits to buying instead of renting. As long as a borrower can afford the payments, then over time, they can refinance out of higher rates and PMI. This is using February’s rate of inflation. March’s inflation rate reached 8.5%!
Rentals:
It is now about $300 cheaper per month to rent than it is to buy.
From 2002 through 2005, rental rates declined. When home prices are increasing and rental prices are decreasing, we have false demand. If there is going to be a crack in the market, we will see it in rentals first. Rental rates are rising at a slower rate than are sales prices. The population cannot afford to rent at prices that match sales price increases.
Rental Rates:
Rents stopped increasing in August 2021. From August to April, rents are about flat. The current monthly pattern is not following seasonal trends. We are watching this closely.
Why aren’t rental princes increasing? Because rental supply is increasing, it is up 58% in the past 6 months. When rental supply increases, it means that there are vacant rentals. Renters have more options and are able to negotiate their terms.
Jim Daniel, President of RL Brown tracks build-to-rent communities, for more information visit https://rlbrownreports.com/.
The median asking rental price is increasing but the dollar per square foot price is declining which means that bigger houses are staying on the market longer. 1700 square feet is the sweet spot, above 1700 square feet, and the price per square foot decreases.
The median asking rent in the MLS is $2,400, up 15% year over year. The median asking price per square foot has declined by 16% year over year, from $2.01 per square foot last year to year to $1.69 this year.
For 0-1 bedroom rentals, inventory is flat, at $1595, the median asking rent is down 10% and the median price per square foot is down 9%, since October 2021.
For 2 bedroom rentals, inventory is up 35% since October, at $2095, the median asking rent is up 5% and the median price per square foot is flat, since May 2021.
For 3 bedroom rentals, inventory is up 64%, at $2338 the median asking rent is up 6% and the median price per square foot is flat, since May 2021.
For 4 bedroom rentals, inventory is up 131%, at $2600, the median asking rent is down 7% and the median price per square foot is down 16%, since August 2021.
For 5 bedroom rentals, inventory is up 142%, at $3800, the median asking rent is down 31% and the median price per square foot is down 39%, since January 2021.
Affordability challenges are more apparent in larger rentals. When the market softens, short-term rentals become long-term rentals or are listed for sale. Due to the location of the increased inventory, it doesn’t appear to be short-term rentals driving the increases.
Active rental inventory is up across the valley.
Queen Creek and San Tan Valley combined are up 437% since May.
Gilbert is up 231% since May.
Pinal County is up 208% since September.
Litchfield Park is up 145% since October.
Buckeye is up 141% since October.
Tempe is up 118% since September.
Chandler is up 81% since May.
NE Valley is up 25% since September.
Vacancy Rates:
Arizona’s rental vacancy rate is 4.8% which is very low. The most expensive areas tend to have more rentals because fewer people can afford to own. Arizona is in the second-lowest vacancy rate area which means we are getting closer to states like CA.
Exuberance:
Euphoria is among the final stages in a growth market. The depth of euphoria is measured by the level of exuberance in the market. Exuberance indicator, meaning something else is driving the demand. That something else is Wall Street.
Is it about flip investors? Flips only work in seller markets. Opendoor launched in 2015, and Offerpad in 2016; these ibuyers have never seen a balanced or weak seller’s market. Flips decrease in softening markets. We are seeing record flip counts.
Who are the iBuyers selling to? They’re selling to Wall Street. Wall Street is too euphoric. iBuyers have scaled way back. Expect ibuyers closings to decline over the coming months. The scale-back is another indicator of softening.
Water:
Water is getting more media attention due to the huge decline in water levels in Lake Mead. Not a new issue, been dealing with it since 1999. We are starting to see areas struggle with water. For example, Rio Verde has to figure out where they will get water now that Scottsdale will no longer haul it. This is going to affect people in the outskirts of town. This is an issue in Pinal. This is a long-term challenge that will have to be addressed. Maricopa County is doing ok right now.
2005-2008 Bubble Vs. 2022
2005: HIGH VACANCY & HIGH FORECLOSURE RISK:
False demand leads to vacant properties and vacant properties lose value.
Bad financing: 100% (or more) loans, interest-only loans
Lots of speculation: no intention of occupying the property
Overbuilding for 10 years
2022: HIGH EQUITY, LOW FORECLOSURE RISK, LOW VACANCY RISK
Good loans with significant down payments
Stable buyers
Intent to occupy
New home development struggles to keep up with demand
Wall Street’s returns may be lower than expected, rentals/short term: moderate risk of vacancy due to potential pull back on rentals
Lack of water creates a high risk of vacancy
Unfortunately, Wall Street money often creates big messes for the housing market. This time around Wall Street has taken on nearly all of the risk. They are not leveraged but will likely have more risk of a lower or negative return.
Supply:
Whenever there is uncertainty, lean into the numbers. Lean into what you know. You can only advise on what is happening right now.
Weekly accepted contracts are falling into line with 2021 and slightly below. Seasonally, we normally peak right now for contracts in escrow. Currently running 1.2% above last year but not showing the typical increases we would normally see right now, instead, it is declining. Looking at years past we are on the low side of demand for what is under contract.
New listings are down 6.6% year over year but overall inventory is up 13.4% year over year. Active inventory increases are very specific to price range.
$500K – $600K is up 130% year over year
$800K – $1M is up 57% year over year
In these ranges investors and second homeowners are not picking up the slack. The sub-$500K market remains extremely tight as does the luxury market.
Cromford Market Index (CMI):
The best tool for predicting future price appreciation trends and is available on the main page of the Cromford Report: https://cromfordreport.com/ (without a subscription)
100 is balanced and prices rise at the rate of inflation (currently 8.5%), below 100 is a buyer’s market, above 100 is a seller’s market, prices drop below 90, prices rise at 110.
Yesterday we were at 420.7
All time high: 3/14/2021 at 514.9
2022 High: 2/7/2022 at 474.6
CMI is the predictor, it moves first and then appreciation follows. Cannot predict the CMI. It tells us where we are.
Sales Prices:
Annual appreciation rates will continue to rise. Price is a result; it is the last thing to move. It shows what already happened. We now can see that prices peaked about 6 weeks ago. Supply has been stable for about 30 days.
Demand is about normal. From 2015 to 2019 demand was higher than today. A month ago, it was 12% above normal and yesterday it was 4.6% above normal. The demand index is declining.
During week 6 in February, interest rates increased this is when we started seeing the decline in demand. Normally this indicator is a very slow-moving indicator. Last year demand declined quickly and then stopped and jumped up again towards the end of the year.
When the CMI reaches the 160-200 range is when prices will likely peak and will be the best time to sell. Currently, the supply/demand imbalance still benefits sellers. Today’s median sales price is $465,000 which is a 24% year over year increase. The average price per square foot, another growth measurement, is up 22% year over year. A normal seller’s market appreciates about 4%-10% annually.
Normal Market?
We haven’t had a normal market in 21 years. 2014 was the only balanced market.
For prices to drop, supply has to be above demand. Supply is 75% below normal and demand is about 5% above normal. Prices will continue rising.
When demand drops below normal, we have fewer transactions. It hurts the business. This is the time to stay in touch with your clients and to stay top of mind. Competition for all of us will rise and it will be tougher to get business.
Institutions are running the show.
Sales:
Still a very seasonal market. Listings under contract declined by 6.8% year over year moving the contract ratio from insane to a mere frenzy. Typically, we peak now but it happened in March this year. Buyers may get a little bit of a break. They may have a few extras houses to look at but nothing under asking price.
Seeing a shift in the market. The seasonality is looking sharper. It is normal seasonality and shifting due to interest rates spikes. Rates can shift down as quickly as they jumped up.
Before we see prices come down, sales over asking will decline. Currently, 57% of listings are selling over list price. The median amount over asking is $20K.
The average sales price per square foot is 2% higher than the average asking price. We are not on the cusp of a price decline.
When markets cool, days on market increase first. We are still holding strong at 7 days since early February. Then seller concessions increase. We are currently at 3.2% of homes sold with a seller concession. In March 2020 concessions increased from 17% to 22%. Then price reductions increase. While price reductions are up, they remain very low. During the first week of April in 2019 there were 2500 price reductions, the same week in 2022 there were 500 price reductions.
Final Thoughts:
Prices are expected to continue rising in the foreseeable future – the market is turning slowly, started around mid-February but may speed up given the interest rate increases.
64% of buyers = Owner Occupant (Normal 70-76%)
Vacant active rental supply is up 58% since September – we are watching this closely!
Market is not like 2005-2008 market, the risk is mostly shouldered by Wall Street and investors
Long term risk of vacancies: potential water shortages in outlying areas
For a great closing experience, send your next transaction to Clear Title.
Sarah Perkins is an award winning account executive and has been in title sales since 2004. As the Director of Industry Research & Senior Account Executive, Sarah’s role is to bring real estate transactions to Navi Title. Sarah supports her clients by helping them navigate the ever-changing real estate space through thorough research and understanding of current trends impacting today’s home buyers and sellers.
The relationship between supply and demand establishes pricing whether it is for toothpaste, a mani/pedi, Bitcoin, or a house. Demand moves based on consumer sentiment. This is true for Wall Street and Main Street and that is the extent of the similarities between the two.
Earnings:
Aside from Zillow’s, many of the Q3 2021 earnings calls were filled with optimism. There were clear winners like eXp and Fathom who both experienced massive growth. There were also companies pleased at losing less than in previous quarters. Redfin’s total revenue was up 128% year over year and its net loss improved from $34.2 million in Q3 2020 to only losing $18.9 million in Q3 2021.
Redfin’s iBuying revenue was up 1,000%. While Redfin is the country’s fourth largest iBuyer, CEO Glenn Kelman said iBuying is only part of what they do but is not the company’s primary focus. He went on to say that iBuying isn’t going away, despite Zillow’s challenges, nor will it be a huge part of the market, forecasting that iBuying will likely max out at about 10% of the market.
iBuying is not dead but it is still not profitable. It broke Zillow, who after $1 billion in losses in 3.5 years, expects to lose another $250 million in Q4 2021. Opendoor increased revenue by 91% to $2.3 billion from Q2 to Q3 2021 and decreased its losses from $144 million to $57 million over the same time frame. At $540.3 million, Offerpad’s revenue increased by 185% year over year, but still sustained a net loss of $15.3 million.
Other winners include 18 publicly traded homebuilders who successfully doubled their market caps since March 2020. Hovnanian Enterprises had the greatest market cap increase at 1,207%. The nation’s largest home builder, D.R. Horton had an increase of 176%. Despite the labor and supply chain shortages, homebuilders are turning substantial profits.
National Real Estate:
Demand is increasing, which is seasonally unusual. The rising interest rates and super high rents are possible culprits. Homes continue to sell quickly (in about 42 days on market, up from 21 in May, but well below the normal 70 expected this time of year) and with multiple offers, though declining. Single family year over year appreciation is high but slowing from 22.9% in Q2 2021 to 16% in Q3 2021.
“Home prices are continuing to move upward, but the rate at which they ascended slowed in the third quarter. I expect more homes to hit the market as early as next year, and that additional inventory, combined with higher mortgage rates, should markedly reduce the speed of price increases.”
-Dr. Lawrence Yun, NAR’s chief economist
The AZ Market:
Buyer demand is increasing, why? Zillow pulled out and yet demand is over 22% above normal. Inventory remains persistently low at 65% below normal. The iBuyer frenzy has settled down. The best thing for our market is to have a lot of owner occupied buyers. 18 months ago, 93% of buyers were owner occupied and in September it was only 74%.
BeachesMLS in Southeast Florida recently joined MLS Aligned as it gears up to release Aligned Showings, a new showing service. Created in 2018, MLS Aligned is a joint venture founded by ARMLS, Metro MLS in Wisconsin, MLSListings in Silicon Valley, RMLS in Oregon, and UtahRealEstate.com.
ARMLS policy states that a product vendor cannot also be a member, which means that ShowingTime (owned by Zillow, an ARMLS member) will not be able to extend its contract into 2022.
Scottsdale came in at number four for cities that have increased the most by both actual dollars and in percentage growth. In September 2019 the median sales price for a Scottsdale home was $477,000. By August of 2021 it was $715,000. Nearly a 50% increase!
According to a city analysis from 2020, Phoenix is short 163,067 housing units. Combine that with Phoenix’s average retail space per capita is 40.5 square feet, compared to 28 square feet nationwide, and city officials are creating a plan to convert vacant retail spaces into apartments and condos.
Real Estate News:
For 10 months, from October 2020 to August 2021, Fannie Mae and Freddie Mac applied the adverse market fee to refinances and collected nearly $5.3 billion, covering nearly 70% of the GSE’s Covid relief programs.
Pretium Partners has agreed to acquire 2,000 of Zillow’s homes to add to its portfolio of 70,000 single family rentals throughout the country. Zillow still has about 18,000 homes to sell before it can fully shut down its iBuying segment.
Created for long term sphere marketing, Navigate by Cryano is a conversation analysis tool that uses communication styles from Gmail and Zoom to develop follow up strategies for Realtors.
While the residential real estate market changes slowly, it has never before moved this quickly. Change is unnerving but not always bad. Remember, it was housing that pulled us out of the shortest recession in history.
If the COVID-19 crisis didn’t happen, we would still enjoy the most prolonged economic and job expansion in history. But the pandemic did happen, and we are more vital for having weathered that horrific storm. We now continue this journey together in this new expansion. Economic cycles come and go: My job is to guide you through this process and show you that boring economic models work. They may not be sexy, but they can be precious when you have a good one tested through time. Trust the data and keep moving forward.
Sarah Perkins is an award winning account executive and has been in title sales since 2004. As the Director of Industry Research & Senior Account Executive, Sarah’s role is to bring real estate transactions to Navi Title. Sarah supports her clients by helping them navigate the ever-changing real estate space through thorough research and understanding of current trends impacting today’s home buyers and sellers.
While the company that we love to hate is struggling, we are all left on the sidelines guessing what will happen next. This is not the end of iBuying, nor is it the end of Zillow, and this certainly does not mean the market is crashing (the price reductions are only bringing the asking price down to market value). It may mean that Wall Street investors decided profitability is important and it is time to stop buying high and selling low.
Zillow:
Zillow’s CEO, Rich Barton, described Tuesday as “a tough day at Zillow” following his announcement on Zillow’s earnings call that Zillow Offers is shutting down and they are laying off 25% of their workforce. After 3.5 years and $1 billion in losses, they have had enough. Barton’s comments state, “We’ve determined the unpredictability in forecasting home prices far exceeds what we anticipated…and would result in too many earnings and balance-sheet volatility.” This does not create confidence in the Zestimate, which was supposedly the foundation of their offers. It will take several months for Zillow to sell the giant inventory of homes it amassed in Q3.
60% of Zillow’s operating revenue and expenses are allotted for iBuying. The company currently owns 9800 homes and has another 8200 under contract to purchase, a total of 20,000. The company expects to lose 5%-7% on these properties. It is also currently looking for an institutional investor to purchase about 7,000 properties for $2.8 billion.
Here in Greater Phoenix, Zillow’s active listings are asking a median of $29,000 less than what they paid for the property. Zillow’s median buy-to-sale premium for October was a loss of $9,000 per home. (Opendoor’s was a loss of $2,400 and Offerpad actually made $6,400 per home) For more information on Zillow’s pricing struggles, check out Mike DelPrete’s recent article, here.
68% of its $1.73 billion in revenue came from Zillow Offers and yet the company still ended Q3 with $328 million in losses. Zillow’s shares have dropped nearly 20% in only a matter of days. And despite the drop, it still has a market cap of over $20 billion.
What is next for Zillow? Barton noted the recent $500 million ShowingTime acquisition as well as the 220 million unique monthly visitors and hinted at pivoting to being an “asset-light” company. I could see Zillow moving into power buying, like Knock.com and Orchard, rather than carrying the expense of real property. It would also take Zillow back to its roots, focusing on buyers.
After increasing by 8% in August, pending home sales declined by 2.3% in September. Locally we saw a slight dip in demand in August and September and oddly enough, demand is actually increasing right now. This is unusual given the timing, Q4 tends to see demand decline, and the recent news of a major buyer leaving the market as well.
“Contract transactions slowed a bit in September and are showing signs of a calmer home price trend, as the market is running comfortably ahead of pre-pandemic activity. It’s worth noting that there will be less inventory until the end of the year compared to the summer months, which happens nearly every year.”
-Dr. Lawrence Yun, NAR’s Chief Economist
Last year investors accounted for 11.5% of purchases, so far in 2021 that number has increased to 15% of all properties. In Arizona it is 21%. And 50% of the investor purchases were made with cash. Will this number change without Zillow’s purchases?
Real Estate News:
The Federal Reserve announced that it would begin tapering its monthly bond ($80B) and MBS ($40B) purchases this month. This news came as no surprise and rates did not jump as the announcement was made. This is the tentative tapering schedule with the goal of completion by June. Rates are expected to continue to rise slowly. Fannie Mae predicts we will be at 3.4% interest rates by the end of 2022 and the MBA predicts it will be up to 4%.
The Villa Aurora in Rome is the world’s most expensive listing with an asking price of $547 million. This 30,000 square foot estate includes the only mural painted by Caravaggio around 1597.
Final Thoughts:
After years of iBuying and a third quarter of purchasing over 9300 homes, Zillow pulling out of the market has caused quite a stir. Upon reflection, this is healthier for our market in the long run. While sellers were able to benefit from way above market offers, it is unhealthy for the market. Artificially inflating the market ultimately benefits very, very few. The market is going to do what the market is going to do and we just have to be prepared for whatever is thrown at us.
Sarah Perkins is an award winning account executive and has been in title sales since 2004. As the Director of Industry Research & Senior Account Executive, Sarah’s role is to bring real estate transactions to Navi Title. Sarah supports her clients by helping them navigate the ever-changing real estate space through thorough research and understanding of current trends impacting today’s home buyers and sellers.