Today is all about the AZ market. Recently, Clear Title hosted a Market Update with the Cromford Report’s Tina Tamboer. She always shares pertinent and timely information. Below I have combined a lot of her information from her presentation, along with additional information from my research.
To learn more about a Cromford Report membership, click here.
A lot is happening in housing and there is no reason to panic. The market of the past two years is unsustainable. In order to get to the calm of a more balanced market, we have to go through the chaos of change.
In order to really see what is going on in Greater Phoenix real estate, we have to take a granular look at exactly what is happening right now.
Interest Rates:
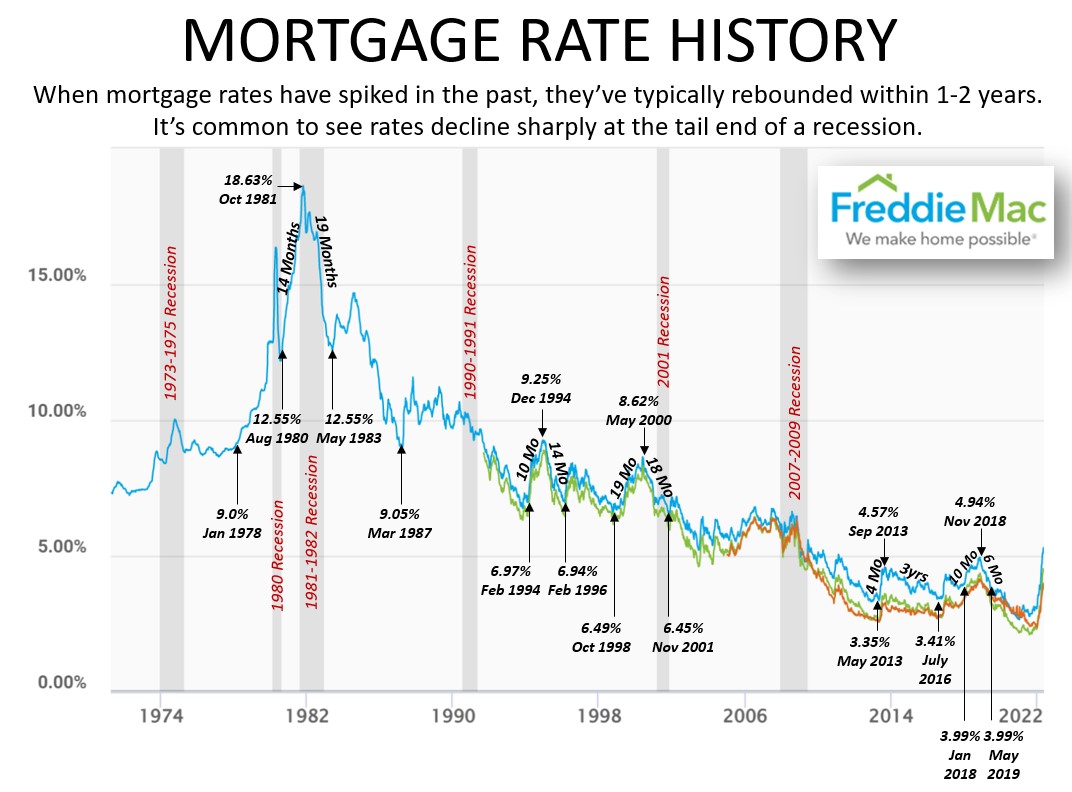
Interest rates are never low or high forever. Sometimes they come down as fast as they go up. In 2018, it took 10 months to go up and 6 months to come down.
The speed of movement hasn’t been like this since the 1980s. The speed is comparable to the 80s but the actual rates are very different.
Look at the changes during a recession. What do interest rates do during recessions? At the end of all of the past recessions, interest rates dropped. If we are going into a recession, then we will likely see rate drops towards the end. Aside from 2008, most recessions last only about a year.
In time rates will likely come down. Remember people buy payments. They are watching payments. Potential buyers should buy now, start building equity, and refinance later when rates drop. Homeownership is the greatest creator of wealth in the US, this is true regardless of interest rates.
Active Supply:
This is the chaos. Active inventory is up 86.2% year over year and up 108% in 10 weeks. Listings are rising and demand is down, causing inventory to grow even faster.
New listings are up 11.2% year over year. We are just coming in over 2021 but not higher than 2005. Before the crash of 2008, we had a ton of new listings. This does not mean the market will crash. We are at an inflection point though. Are the numbers turning seasonal or will there be an acceleration of new listings? It is important to watch these numbers.

Accepted Contracts:
There is always a drop in accepted contracts over Memorial Day weekend. Newly accepted contracts were down 11.3% year over year. There will be another drop off for the 4th of July weekend. Expect the decline to continue. The accepted contracts are matching the pace of 2019. This is another metric to track.
Pending listings have declined in each of the past four months. 10 weeks ago, listings under contract started coming in lower than in 2021. Now that count is 15.9% below last year’s count. About a year ago the market started normalizing when Zillow and Opendoor both went on a purchasing rampage, creating the frenzy of the second half of 2021. That will not happen again this year.
29% of buyers in April paid cash. Investors are not buying everything.
Supply & Demand Changes:
Overall, active supply is up 92.4% year over year and at the same time listings under contract is down 15.9% year over year. Buyers are seeing inventory rise after two years of rejection. Now is the time to prepare your sellers for what is happening right now. Today’s market is very different from the market of only a few months ago.
$300,000 – $400,000 listings
- Active supply up 23% year over year
- Active supply up 84% in 10 weeks
- Listings under contract down 45% year over year
- Listings under contract down 36% in 16 weeks
$400,000 – $1.5M listings
- Active supply up 174% year over year
- Active supply up 105% in 7 weeks
- Listings under contract up 29% year over year
- Demand is still quite high but there are way more listings coming on the market, many sellers do not want to miss the top of the market. If it were following seasonal patterns, demand will flatten.
$1.5 – $3M listings
- Active supply is still low compared to previous years
- Active supply up 38% year over year
- Active supply up 112% in 10 weeks
- Listings under contract up 6% year over year but on a steep decline, will fall below 2021’s numbers in the coming weeks. If following normal seasonality, this will decline through the end of the year.
Over $3M listings
- Active supply up 20% year over year
- Active supply up 34% in 12 weeks
- Listings under contract up 19% year over year
Flip investors, private landlords, and first time home buyers tend to buy below the median. The current median is $480,000. There are not very many listings available below $480,000. This has impacted first time buyers and investors on a budget, there is both a lot of competition and profits are lower for flippers in the lower price ranges.
If this market slows down enough, down payment assistance programs will likely increase. There is aid available but only when demand is low enough will sellers accept offers from buyers utilizing the programs. This is not seasonal.
Price Reductions:
Price reductions are often the first indicator of a market shift. When buyers believe they can afford the asking price is when they will come into the market.
$300,000 – $400,000 listings
- Price reductions are up 208% in 10 weeks
- Median amount reduced: $10,000
$400,000 – $1.5M listings
- Price reductions are up 302% in 10 weeks. In the same 10 week period listings under contract are down and inventory is up. Sellers need to adjust accordingly.
- Median amount reduced
- $400K – $500K: $10,000
- $500K – $600K: $10,000
- $600K – $800K: $12,000
- $800K – $1M: $25,000
- $1M – $1.5M: $50,000
Over $1.5M listings
- Price reductions are up 172% in 10 weeks.
- Median amount reduced
- $1.5M – $2M: $77,500
- $2M – $3M: $136,000
- Over $3M: $187,500
Days on Market:
Behind price reductions, the second indicator of a market shift is an increase in average days on market prior to contract. For most of the year, listings were on the market for 7 days prior to accepting a contract. In May, that number hit 9 days and by the end of May it was up to 11 days. May’s increases were quick and with more inventory coming to market, this number will continue to increase. Sellers will need to adjust their expectations from an offer coming in one week to two weeks.

Contract Ratio:
Housing is no longer in a frenzy. A frenzied market is when there are more properties under contract than there are on the market. The contract ratio for a frenzy market is over 100. A month ago listings up to $2M were still in a frenzy. Each week another price range dips below frenzy level. With a contract ratio of 98.3, we are still in a very hot seller’s market. A year ago the contract ratio was 224.8. A normal contract ratio is around 85.
The decline in contract ratio is more about increased inventory than it is about decreased demand. Inventory has grown faster than demand has declined. The recent drastic declines in the contract ratio represent the chaos before the calm.
Cromford Market Index (CMI):
The best tool for predicting future price appreciation trends and is available on the main page of the Cromford Report: https://cromfordreport.com/ (without a subscription)

- 100 is balanced and prices rise at the rate of inflation (currently 8.6%), below 100 is a buyer’s market, above 100 is a seller’s market, prices drop below 90, prices rise at 110.
- Between 90 – 110 prices roughly follow the rate of inflation.
- Yesterday we were at 227.6
- All time high: 3/14/2021 at 514.9
- 2022 High: 2/7/2022 at 474.6
- CMI is the predictor, it moves first and then appreciation follows. Cannot predict the CMI. It tells us where we are.
There is no number that defines normal. It is about the relationship between supply and demand. When the numbers for supply and demand are the same, the market is in balance.
In 2005, the CMI dropped for 4 months before prices flattened. In the next 3 months, we will likely see a slowing in appreciation rates. Cash investors are still very strong buyers in our market. Less competition so they are offering less.
Supply is 60% below normal. Demand recently fell below normal and is now 7.5% below normal. Supply is increasing faster than demand is decreasing. When demand falls below 100, the number of transactions declines. The closer demand is to 100 or higher keeps transaction counts high. It is better for the industry and overall economy for supply to come up to meet demand versus demand dropping to meet supply.
The CMI declined at record rates over the past 8 weeks. CMI data goes back to 2000 and the last month had the fastest CMI drop on record. With this many outside influences impacting the market, it is impossible to know what will happen next. The CMI can change on a dime. There is no indication that prices will decline anytime soon but this does show weekly declines in the seller’s advantage. Now is not the time to over price a listing. We don’t have desperate sellers. They can wait and not panic sell. Worst case they keep their home and an awesome interest rate for a little longer than planned.

Sales Measures:
Sales measures tell us what happened in the past, not what is happening in the future. The media is using closed sales, past activity, to explain the market. Things are shifting so quickly right now it is impossible to predict the future past 3-4 months from now. The sales measures for the month of May are still very good. But that is not the future, it explains what the market did 30-60 days ago.
May ended with a median sales price of $480,000 and year over year annual appreciation rate of 22%. The sales price to list price ratio was 101.7% (expect this to drop in the next 4 weeks) and 54.6% of homes closed over list price. The third indicator of a shifting market is increased seller concessions (when a seller pays some of the buyer’s closing costs). Currently, seller concessions are low at 4.1% but are just starting to increase.
Flips:
Flips dropped off in April, likely due to the increased interest rates and declining demand.
Opendoor Activity:
- Opendoor made its first profit in Q1 2022.
- May through November 2021 Opendoor acquired 3,609 properties and sold 1,861. They acquired 94% more homes than they sold.
- December 2021 through March 2022 Opendoor acquired 1,408 properties and sold 2,149. They sold 53% more than they acquired.
- April 2022 Opendoor acquired 510 properties and sold 494. They acquired 3% more than they sold.
Offerpad Activity:
- June through December 2021 Offerpad acquired 1,050 properties and sold 742. They acquired 29% more than they sold.
- January through March 2022 Offerpad acquired 201 properties and sold 546. They sold 172% more than they acquired.
- April 2022 Offerpad acquired 94 properties and sold 93. They acquired 1 more than they sold.
The iBuyers struggled to turn a profit during the largest resale year in history. The rest of the flip investors did very well. Regular, private flip investors hold properties for shorter timeframes than do the iBuyers.
Rentals:
Available rentals in the MLS is up 26% since the beginning of the year. This indicates that there are more vacant homes. Vacant homes are bad for a housing market.
4.9% of May’s closed rentals closed over list price. 53.5% closed at list price. And 41.6% closed under list price. There are no bidding wars for rentals.
Crash Versus Correction:
A crash is a big drop. A correction is a slight fix. Correction is getting back to where we would be anyway. We are experiencing a disruption. We do not know how long it will last. After the disruption, we will experience a correction. Do not expect foreclosures.

2005-2008 Bubble Vs. 2022
The biggest risk to all housing markets is vacant homes.
2005: HIGH VACANCY & HIGH FORECLOSURE RISK:
- False demand leads to vacant properties and vacant properties lose value.
- Bad financing: 100% (or more) loans, interest-only loans, no equity
- Lots of speculation: no intention of occupying the property
- Overbuilt for 10 years, no labor or supply shortages, built quickly
2022: HIGH EQUITY, LOW FORECLOSURE RISK, LOW VACANCY RISK
- Good loans with significant down payments
- Cash does not foreclose
- Stable buyers
- Intent to occupy
- New home development struggles to keep up with demand
- Wall Street’s returns may be lower than expected, rentals/short term: moderate risk of vacancy due to potential pull back on rentals
- Lack of water creates a high risk of vacancy
The common denominator between the 2005 and 2022 markets is Wall Street. People always take more risk when spending other people’s money. A flood of capital in any sector often creates chaos. In 2005 investors put all of their money in lending and mortgage-backed securities (MBS). The Dodd-Frank Act prevents that from happening again. The risk for today’s investors is a lower than expected return, not a flood of foreclosures.
There is risk with short-term rentals and second homes. If the investors cannot rent the property, they will sell. If short-term rental owners can’t rent to vacationers, they will go to long-term rentals.
We do have to watch water, the outskirts are impacted the most. People will not be as interested in buying or renting if there is a water shortage. Expansion will be restricted in areas with stressed water resources. It will likely push more density in areas with a solid water supply. Water supply could impact future housing demand in shortage areas.
Final Thoughts:
We are early in the shift. Start bracing sellers for market prices, increased days on market, and potential concessions. Do not expect to see more of the 2% month over month appreciation rates, expect to see an appreciation rate of less than 1% month over month.
The market is attempting to normalize and is doing so quickly. We have to move through the chaos to get to the calm.

Sarah Perkins is an award winning account executive and has been in title sales since 2004. As the Director of Industry Research & Senior Account Executive, Sarah’s role is to bring real estate transactions to Navi Title. Sarah supports her clients by helping them navigate the ever-changing real estate space through thorough research and understanding of current trends impacting today’s home buyers and sellers.