Tag: #marketupdate

  • Greater Phoenix Real Estate Update 10/1/2021

    Emotions have the ability to cloud our judgment. We are taught to be rational and to only use the facts when making decisions. That sounds good in theory, but when a human is devoid of emotion they cannot make even the simplest of decisions.

    Do you have clients still worrying about when the housing market will crash? The intensity of late 2020 and early 2021 felt like the market frenzy of 2005. As the market normalizes it may feel weird or uncomfortable as we pivot again. While those emotions are important and we have to have emotion to make decisions, we have to look at the facts. And the facts point towards stabilization and continued appreciation, just at a slower rate.

    National Real Estate:

    • Nationwide equity increased by $2.9 trillion since Q2 2020. This translates to an additional $51,500 in equity per borrower over the same time period. Another way to look at it is national negative equity share dropped to 2.3%, the lowest level in 12 years.
    • While the extreme price appreciation has benefitted sellers for nearly a year, it is unsustainable. The decline in the rate of appreciation will be noticeable and will feel uncomfortable, however, it is necessary to rebalance the market. Fannie Mae recently released its forecast for the rest of this year and next. I expect to see a 4% to 8% rate of appreciation, year over year in 2022 and Fannie Mae agrees!
    • According to Fannie Mae’s most recent Home Purchase Sentiment Index survey, those who said that it is a good time to buy increased by 7 points, month over month, the first improvement in four months. Those who said it was a good time to sell declined by 1 point, month over month in August. Consumers are starting to realize the shifting market.
    • Zillow sponsored a recent survey of real estate experts and economists projecting the source of future inventory. The panelists expect to see 40% of listings to come from existing homeowners who are relocating. 23% from home builders. 10% from sellers who plan to rent. And 5% from foreclosed properties. Based on the data above 5% could be a reach.
    • After two consecutive months of declines, in August, pending home sales increased 8.1% month over month.

    “Rising inventory and moderating price conditions are bringing buyers back to the market. Affordability, however, remains challenging as home price gains are roughly three times wage growth.”

    -Dr. Lawrence Yun, NAR’s chief economist

    • After two months of gains, existing home sales declined 2% in August, month over month, dropping the seasonally adjusted annual rate of sales to 5.88 million. In 2020 there were 5.64 million home sales.
    • National rentals rates are at a 16 year high and up 8.5% year over year in July. In Greater Phoenix rental rates are up 18.9%.
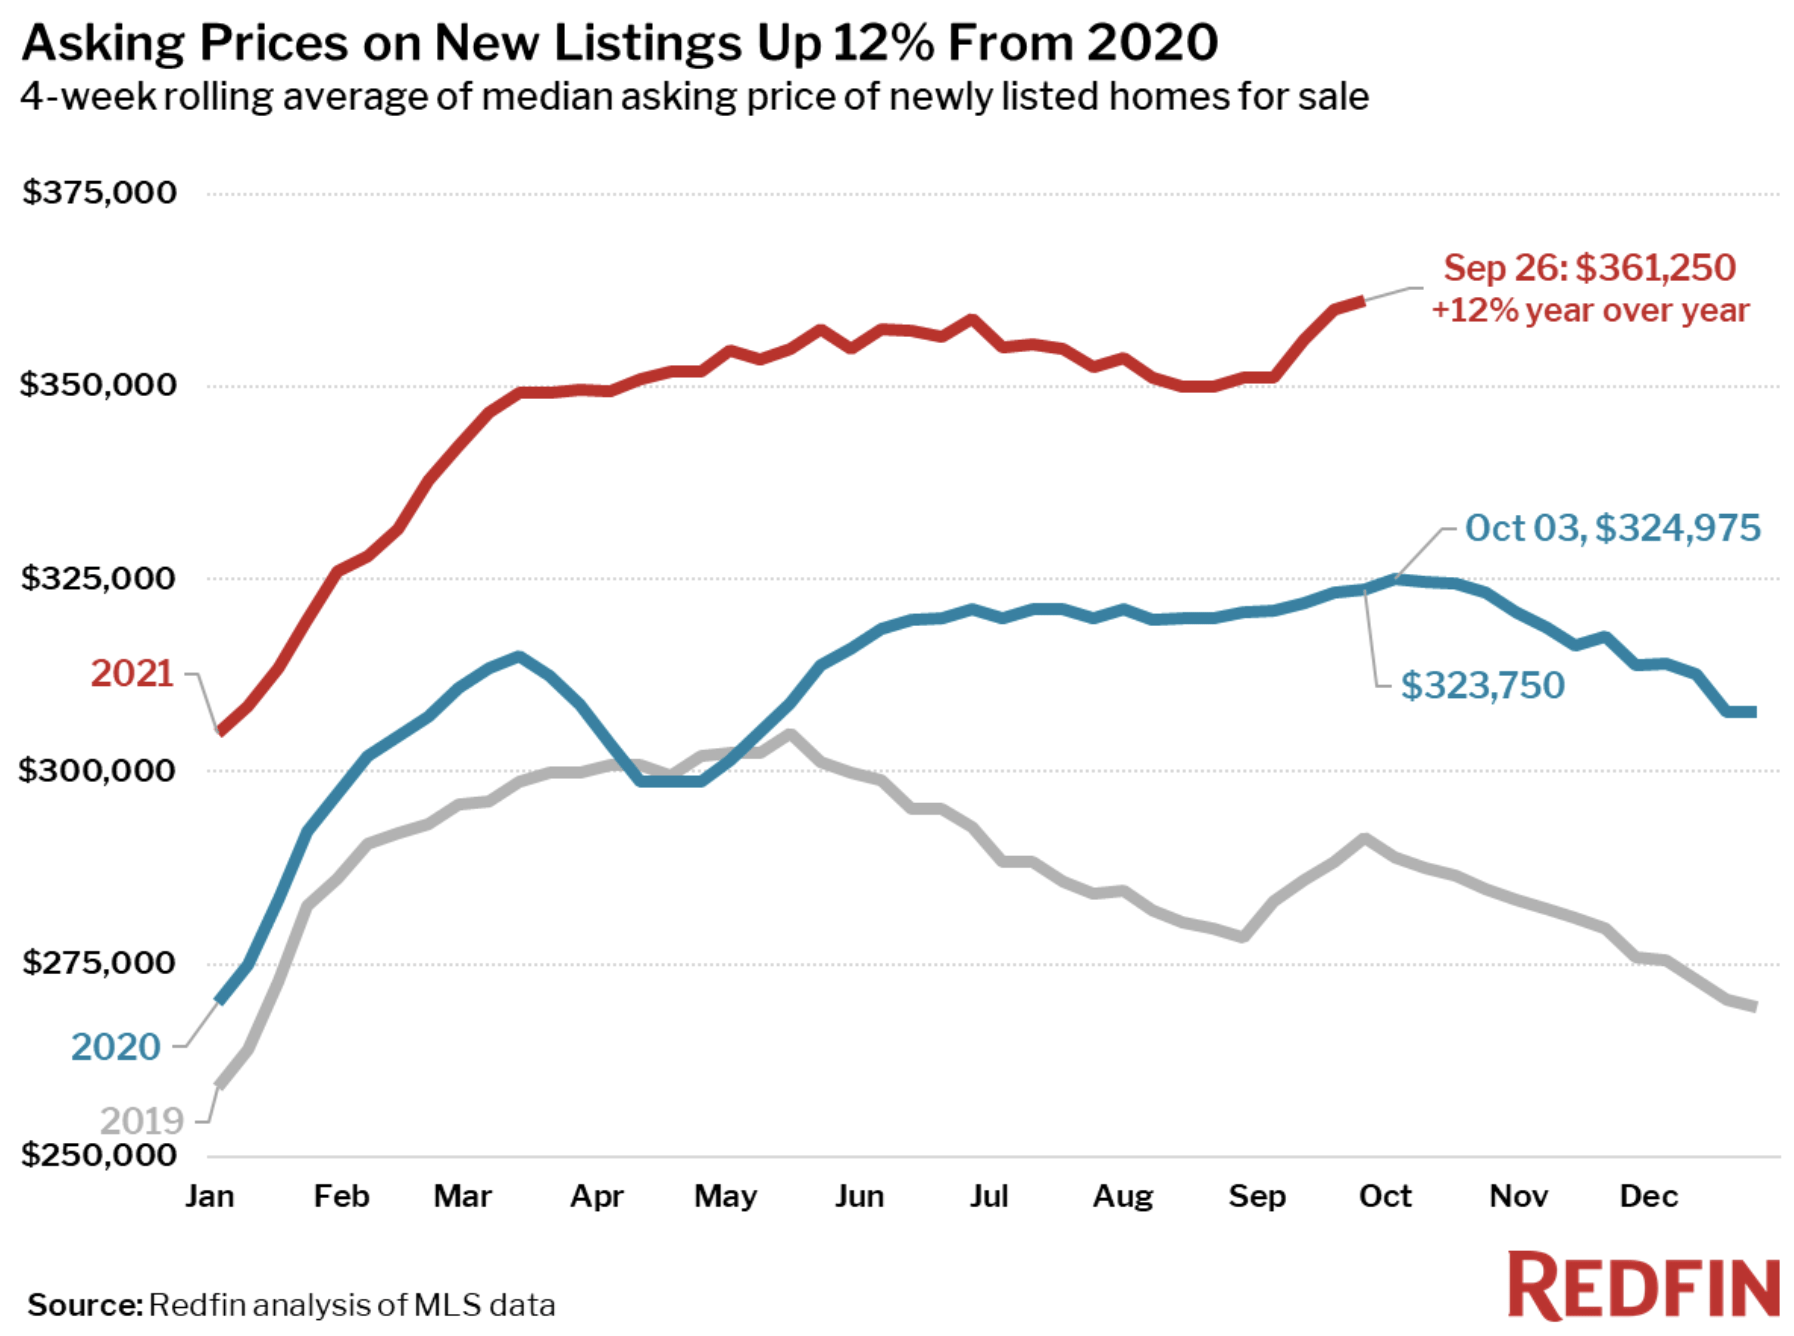
    • The median new listing asking price is up 12% year over year and reached a record high of $361,250 for the four-week period ending September 26. For single family only it is $389,900.
    The AZ Market:

    Demand increased by 11.4% from July 20 to September 30. That is unusual. Demand usually declines in August and September and begins to increase into October as the weather cools. Supply is up 19.6% over the same time period, this is also unusual as inventory tends to decline in the late summer.

    Rents are expected to continue increasing. Greater Phoenix rental occupancy is at its highest rate in over 40 years at 97.1%, the highest since 1978.

    Since 2016 developers have added 36,000 multi-family units, including leased and build-to-rent properties. 2021 will add 11,000 units, the most since 2009’s 9,315.

    Pinal County is growing. In the first half of the year, Coolidge saw a 258% year over year increase in homebuilding permits. In the Town of Maricopa, permits are up 237% year over year.

    New home permits are up 25% year over year in August, meanwhile, permits and closings for new single family homes declined for the second month in a row.

    Nationally, upwards of 10% of new builds are for build to rent. Phoenix is the third-largest build-to-rent market.

    Federal Reserve:

    Mortgage rates are increasing. Higher rates = higher monthly payments = decreased affordability. Additional affordability pressure hurts demand. Rule of thumb: one percentage point = $50,000 of buying power.

    Whether is it persistent inflationary fears, a strengthening economy, or reaching the debt ceiling, the Federal Reserve announced on September 22 that it expects to begin tapering its $120 billion in monthly purchasing of bonds ($80 billion) and mortgage-backed securities ($40 billion) before the end of the year. The tapering will be complete by Q3 2022.

    “Though it may be due to uncertainty arising from brinkmanship on U.S. debt default, I believe it is from the greater recognition of higher inflation. The Federal Reserve has been revising up its inflation forecast and the Fed chairman Powell has changed his narrative to imply as such.”

    -Dr. Lawrence Yun, NAR’s chief economist

    These monthly purchases that started at the onset of the pandemic to stabilize mortgage rates have grown the Federal Reserve’s debt holdings up to nearly $8 trillion. Remember in April 2020 when jumbo loans all but vanished? It was this action that brought stability and extremely low rates to lending.

    The Fed’s hopes to avoid another “Taper Tantrum.” In 2013, when the Fed began tapering its purchases, it only took 8 weeks for interest rates to go from 3.35% on May 2 to 4.46% on June 27 and finally peaking on August 22 at 4.53%. The quick spike in rates caused home sales to decline by 10% and price appreciation slowed but did not go negative.

    The Fed’s next meeting is on November 2 and it is expected that the tapering start date will be selected then and could start as early as November. Markets often respond to news and interest rates have been slowly increasing since the September 22 announcement. Once the start date is established expect interest rates to jump as much as a quarter to half a percent. For more, check out my recent discussion from Monday, here.

    New Construction:

    New home completions were up 4% from July to August. At the same time, single family starts declined for the second month in a row by nearly 3% in August, month over month. New construction will not be the answer to low inventory.

    In August, about 80% of new construction sales were either under construction or yet to be built.

    Despite that single family construction has been increasing since it bottomed out during the Great Recession, home building is running at the slowest pace since 1995. With a housing unit deficit of 3 to 5 million (depending on the on the data source) it will take many years to close the gap.

    Commercial Real Estate:

    Sales prices in all four of the commercial real estate sectors are up year over year. 1.) apartments are 14.7%, 2.) industrial is up 13.6%, 3.) retail is up 12.5%, and 4.) office is up 11.2%.

    Real Estate News:

    • In October 2020 when Opendoor filed it S-4 form with the SEC to go public, it revealed an August 2019 FTC civil investigative demand regarding advertising claims Opendoor made on its website. In its September 15, 2021filing the company warned investors that the deal currently in negotiation may “negatively affect the company’s ability to operate its business” and went on to say, “there are no assurances that we will be successful in negotiating a favorable settlement.”
    • Opendoor partnered with new home search platform, NewHomeSource.com, consumers browsing the site may request a trade-in offer from Opendoor without leaving the search portal.
    • According to Case-Shiller, at 19.7% July had the largest year over year gain since 1987 when Case-Shiller was created. Prices are up 43.7% since the 2006 peak. Phoenix remains the city with the largest year over year appreciation at 32.4% in July.

    Final Thoughts:

    While we still face obstacles, uphill battles, and constant change; remember residential real estate just pulled us out of the shortest recession in history. The strength of the real estate market is what gave it the ability to save the economy. That strength was created by real demand, not loose credit, and seemingly limitless speculation.

    Copyright 2021 Sarah Perkins

  • Greater Phoenix Real Estate Update 9/17/2021

    Looking at housing, things look good and the market is attempting to normalize, but we do not see the whole picture. Wall Street, federal policy, a worldwide pandemic, labor and supply chain shortages also impact housing. But there is still more to consider: the intense and seemingly ever-increasing battle between the Department of Justice (DOJ) and the National Association of Realtors (NAR).

    NAR & DOJ:

    On Monday, NAR submitted a petition to prevent the DOJ from pulling out of their agreed upon settlement. Despite the lack of precedence and ongoing efforts, on July 1 the DOJ announced that it was pulling out of the November 2020 settlement. The DOJ stated that the settlement was not sufficient and that the DOJ wanted the freedom to investigate and pursue NAR further than the five items covered in the settlement, which include publicly sharing buyer agent commission, no longer calling a buyer agent’s services free, and lockbox access. Five days after pulling out the DOJ requested more data from NAR specifically regarding pocket listings and buyer agent commissions.

    The Clear Cooperation Policy, also known as the pocket listing ban, requires all listings to be entered into the MLS within one business day of public listing marketing. And is one of the items that the DOJ plans to further research. A number of opinion pieces promote the removal of the “Coming Soon” status as it is inconsistent and unfair to smaller companies. Real estate analysts are not able to use Coming Soon status data which ultimately skews the numbers as listings often go from Coming Soon to Pending, skipping Active status completely, thus confusing true inventory counts. The DOJ is researching the size and scope of the policy as it is very far reaching with few exceptions. TAN and PLS sued NAR for implementing this policy. Both cases are ongoing.

    The DOJ is also researching NAR’s rule that requires MLS and non-MLS listings to be displayed separately, steering based on commission offered, buyer/seller rebates, and the several class action, antitrust commission lawsuits. Given the size and scope of the requests, experts wonder if the DOJ has a game plan for execution.

    Andrea Brambila of Inman News wrote an extensive article outlining the four years of on-going strife between NAR and the DOJ which can be found here.

    National Real Estate:

    Last week single family inventory declined by 1.4% to 431,000 from the previous week’s 437,000. Declines are typical over holiday weekends. With nearly 400,000 forbearance exits expected this month, inventory is expected to increase slightly, not decrease. The majority of forbearance exits either restructured their loan or continued paying throughout the forbearance period.

    Home sales dropped by 1.4% from July to August and are down 6% year over year. Year over year comparisons are not useful because the pent up demand drove an end of the year purchasing frenzy that is unlike anything real estate has ever seen before.

    Builder costs declined by 1% in August. Lumber and other costs have been slowly declining in recent months and last month was the first time that builders saw any benefit to the declines in prices. It is unlikely that consumers will feel any savings for some time.

    The AZ Market:

    As previously mentioned, we do everything faster and bigger here, at least in regards to real estate. The shifts hit us first and usually with a greater magnitude. From 2008-2011 homes lost roughly 45% of their value while the country as a whole lost about 25%. While the rest of the country started seeing inventory levels flattening and even declining by 0.2% from July to August, our inventory has started to grow again after a few weeks or staying flat.

    July and August had a median sales price of $405,000. Since demand has increased, unseasonably, lately, September’s projected median sales price is $410,000.

    Absorption rate is a great way to monitor supply and demand. It is very seasonal and from the chart below you can see the four-year trend and see that August 2021 is an outlier. Absorption rate actually increased from July to August versus decrease.

    Tom Ruff of the Information Market wrote, “In August of 2020 nearly 91% of all homes purchased were by traditional buyers, for this analysis, we define a traditional buyer as individuals or married couples. In 2021 this number fell to 75%. We saw a significant increase in the number of properties purchased by iBuyers, large institutional investors as well as small investors.”

    Despite our recent affordability decline, for details see my update from 8/20 here, Greater Phoenix remains among the most affordable big cities in the country. According to a recent report by Roofstock, the cost of living in Greater Phoenix is 1.3% below the national average. About 56% of households can afford the median priced home which is lower than the ideal 60-75% range but is significantly better than California, Washington state, and New York who range from 13% to 41%.

    Nearly 300 companies are considering expanding or relocating to Greater Phoenix which means a potential of 16,000 new jobs and over $50 billion in capital investments.

    “On the business-attraction front, there really never has been more interest than greater Phoenix is seeing right now from firms across the globe looking to make investments and expanding and relocating to the region.” – Josh Reed with the Greater Phoenix Economic Council

    According to Realtor.com’s Best Time to Buy Report, nationally the best time to buy is from September 12 to October 17. In Greater Phoenix it is from January 10 to January 16. Buyers have, on average 31% more listings to choose from and sales prices are about $10,000 below seasonal highs.

    These are the first 10 markets in chronological order of the Best Time to Buy weeks.

    Lending:

    The Treasury and FHFA announced on Tuesday that they are suspending the 7% rule which limited Fannie Mae and Freddie Mac’s loan portfolio to allowing only 7% of their total loans to be secured by investment properties and second homes. This is good news!

    Next week the FOMC meets and many expect Fed Chairman Powell to announce bond and MBS tapering starting in Q4 2021. The tapering will increase mortgage interest rates anywhere from a quarter of a percent to a full percentage point. 54% of mortgage holders have an interest rate of 3.75% or less. If rates go above this amount, affordability will be pushed further. Remember in Q2 2021 housing affordability decreased below the healthy affordability range. Further pressure on affordability will push more buyers out of the purchase market. And this is challenging given that rents are up over 20% year over year. The pressure is not only on perspective buyers, but higher interest rates also prevent potential sellers from selling.

    Joel Kan, MBA’s Associate Vice President of Economic and Industry Forecasting said, “Purchase applications – after adjusting for the impact of Labor Day – increased over 7 percent last week to their highest level since April 2021. Compared to the same week last September, which was right in the middle of a significant upswing in home purchases, applications were down 11 percent – the smallest year-over-year decline in 14 weeks.” The long term growth is consistent and doesn’t look like the bubble of 2005.

    Real Estate News:

    • High profile sellers are being exposed by high resolution images, tours, and video used to market listings. Identifying home décor, awards, plaques, etc. are readable. Several celebrities with listed homes have been identified through marketing.
    • HUD does not have to disclose flood risk on properties. HUD REO homes that sold from 2017-2020 were 75 times more likely to be in a flood zone than other homes sold during the same timeframe.

    Final Thoughts:

    This business is anything but boring (no matter what my brother says)!

    Copyright 2021 Sarah Perkins

  • Greater Phoenix Real Estate Update 8/13/2021

    It’s earnings season so the headlines are dominated by big business quarterly revenue numbers. Wall Street and residential real estate have a bumpy history.

    In late 2008 when the Greater Phoenix real estate market’s heart stopped beating and everything went eerily quiet, I didn’t understand what happened. Like many, I wondered, how could everything stop seemingly overnight? I asked, “where did all of the money go?” And I was told, “it never existed in the first place.” I learned that money did not just evaporate on Wall Street and that housing could take down Wall Street, or was it the other way around?

    In 2011 the market bottomed with a median sales price of $107,000 in greater Phoenix. Since 2014 we have been in a seller’s market and the recovery was slow. For a time, real estate felt local again. But was it?

    Venture Capital Funding:

    In 2015, young company, Opendoor, entered its first market, Phoenix. The company pioneered the iBuying concept and was backed by Softbank’s Vision Fund, one of the biggest funds in the world, allowing Opendoor to remain after continued losses. Seven years later the company still has not turned a profit but has billions more to keep trying, especially since going public last year. Big venture capital money continues its quest to disrupt real estate. Opendoor’s situation is not unique, the industry is ripe with unprofitable giants backed by big money. The chart below illustrates the magnitude of venture capital money in real estate, not limited to Opendoor.

    Credit: Mike DelPrete’s 2021 Emerging Models Report

    Valuations:

    Establishing valuations is complicated and the businesses with the highest valuation does not mean that they are the most profitable. Click here for more info on establishing valuations. Earnings alone only tell most of the story. As accurate pricing is established by both supply and demand, profitability is established by dollars brought in and dollars spent. The only way to be profitable is for a company to spend less than it makes.

    For example, eXp’s year over year Q2 2021 $1 billion in revenue led to an earnings increase of a whopping 183%. That combined with an 87% increase in agent count illustrates future growth potential and explains why eXp’s valuation has skyrocketed. eXp’s profit was $37 million or 3.7%.

    Meanwhile, RE/MAX’s revenue grew by 48%, bringing in $76.05 million for a profit of $5.2 million or 6.8%. RE/MAX has consistently been profitable for years, yet its valuation has remained stable.

    Earnings:

    Q2 2021 year over year earnings look extremely impressive given that the post lockdown real estate recovery started in May 2020.

    The AZ Market:

    Join us next Thursday 8/19 as Tina Tamboer with the Cromford Report does a 1 hour deep dive into the greater Phoenix housing market. For details and registration click here.

    Q2 2021 was one of the biggest multifamily construction quarters on record, there were 623,500 units under construction in the 150 largest apartment markets nationwide. In greater Phoenix there were 28,600 multifamily units under construction, increasing our multifamily base by 7.6%.

    These numbers are high but warranted. Nationwide apartment rents are up 8.3% year over year and occupancy is at a record high at 96.9%. Greater Phoenix continues to top the charts in year over year rents growth at 21.6%.

    Policy:

    The CDC extended the eviction ban through October 3 with slightly different criteria, covering about 90% of renters. In May, the Supreme Court ruled that the only way to extend eviction protections is with Congress’ approval. President Biden officially made that request to Congress while it is in recess, the only way for it pass is through a unanimous call-in vote. Furthermore, when the Supreme Court made its ruling it stated that it agreed with the plaintiffs in that the Supreme Court did not believe that the CDC had the authority to extend the ban in the first place. Of the $46 billion allocated for emergency rental relief, only $3 billion has been disbursed.

    On July 31, the foreclosure moratorium expired. The CFPB implemented specific rules in which lenders must abide by when foreclosing which will further delay most foreclosures. Abandoned properties will be foreclosed on first. There will be some foreclosures but not a flood. For greater detail on this and forbearance, please check out my AZ Forbearance Update from Wednesday, here. One major factor at play is the historic levels of equity most homeowners have.

    New iBuyer:

    Rocket Homes, a subsidiary of Rocket Companies which owns Rocket Mortgage, the country’s largest lender, is hiring employee real estate agents and is planning a “soon to be released iBuyer program” that will be managed through a third-party partner company.

    Rocket Homes, a licensed brokerage, which is already licensed in all 50 states (has been licensed in AZ since 2018) said that beginning in the fourth quarter of 2021, employee agents working from downtown Detroit will provide services to sellers at a discounted commission rate of 1.5% (the co-broke offered is unclear). The remote employee agents will advise on listing price, handle photos, enter listings in the local MLS, negotiate offers, and handle paperwork. Sellers who would prefer to work with an agent in their market will be referred to the Rocket Homes Verified Partner Agent Network. Sellers who don’t want to work with an agent at all can use Rocket’s ForSaleByOwner.com platform for free.

    Real Estate News:

    • A new Connecticut law is now regulating what Realtor teams may call themselves. They can use “team” but not “group” or “LLC” and also requires a $565 initial registration with an annual fee of $375. This is an awfully complicated way to increase state revenue. Will it catch on?
    • Citigroup, JP Morgan Chase, and other banks are offering a new high risk, high reward bond product and investors want in. While they are a very small part of the market, banks are selling riskier products that packages mortgages, car loans, and corporate debt. Investors are responsible for the losses when borrowers default on the loans packaged in the bonds.

    Final Thoughts:

    Long before residential real estate pulled us out of the shortest recession in history, Wall Street and Silicon Valley were plotting ways to infiltrate housing. While big money and new technology provide powerful incentives, it is very difficult to replace a well-informed, well-connected, local real estate professional.

    Copyright 2021 Sarah Perkins

  • Greater Phoenix Real Estate Update 5/21/2021

    Residential real estate continues moving at breakneck speeds. In April, nearly 75% of offers written by Redfin agents were for listings with multiple offers, nationwide. In greater Phoenix, it was 80.5%. Last week Tina Tamboer with the Cromford Report told us that 57.1% of homes that closed in greater Phoenix in April, closed over asking. These exciting times of economic growth and massive home-price appreciation are being dampened by fear, not just of a bubble – which we are not in – but also by the threat of inflation. One of the ways the government is able to slow inflation is by increasing rates (not mortgage), which then usually puts pressure on mortgage rates which would increase affordability challenges thus weakening homebuyer demand.

    Inflation:

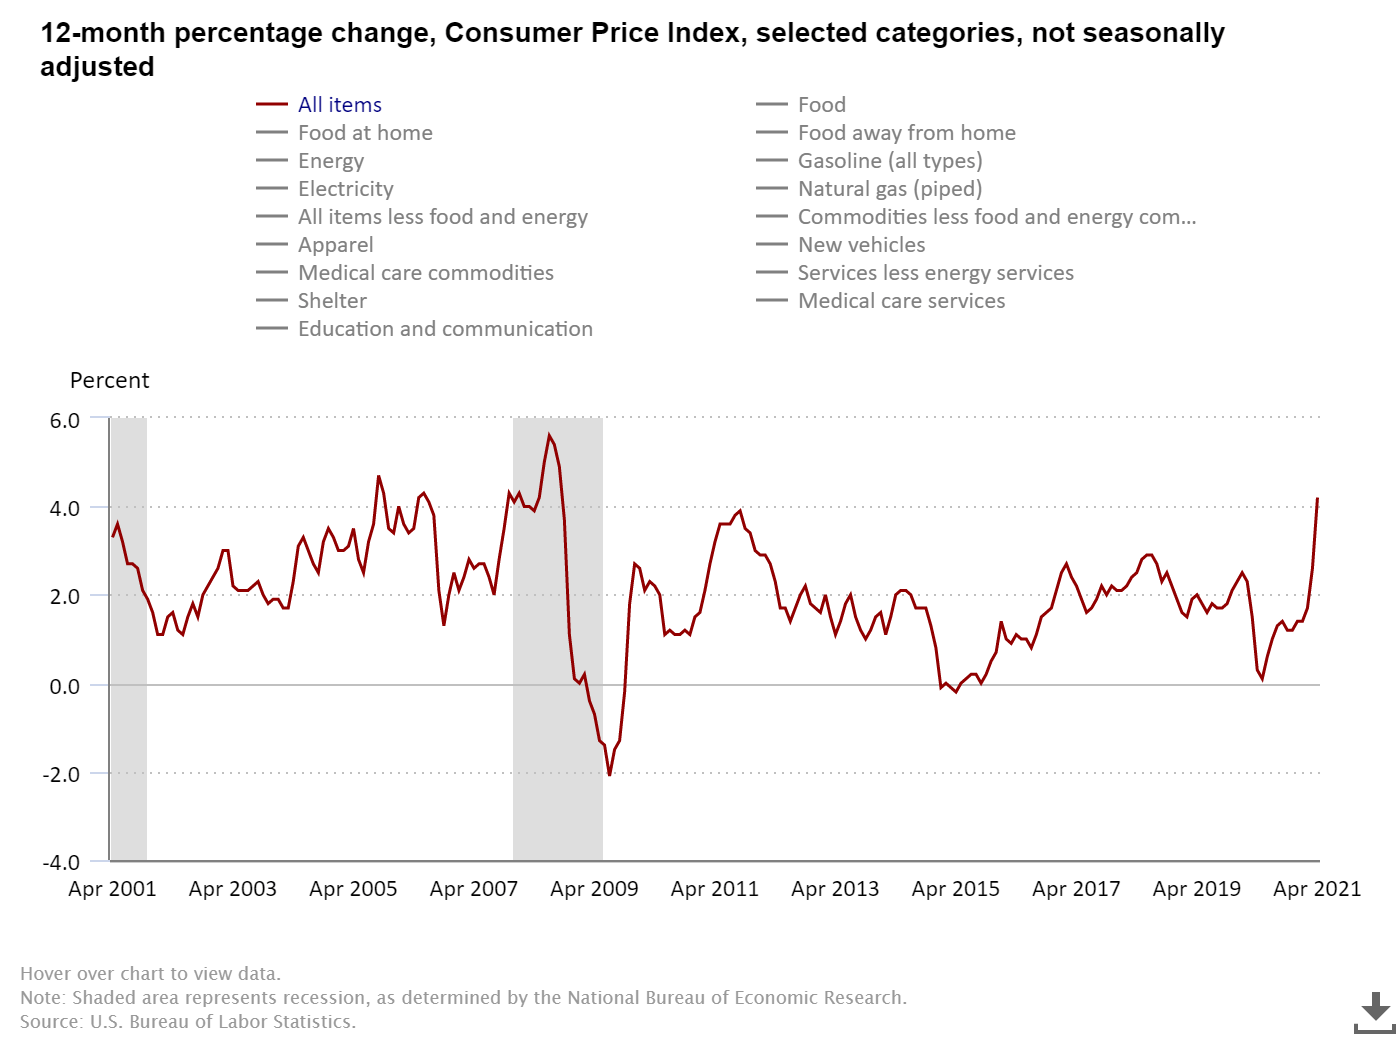
    Consumer price inflation increased by 0.8% from March to April, the largest increase since June 2009. It increased by 4.2% year over year, the highest since September of 2008. Core inflation is up 3% year over year. Experts blame supply chain challenges and last spring’s weak readings and believe this inflation is short-term and will settle down in the coming months. Housing has taken on the largest rate of inflation at 18% (nationally) year over year. Consumers call it appreciation and economists call it inflation.

    In late April the Federal Reserve stated again that it intends to keep short-term interest rates at nearly 0% until we reach full employment (roughly 5%) and inflation is slightly above 2% “for some time.” It will also continue buying $80 billion in Treasury securities and $40 billion in mortgage backed securities monthly until those benchmarks are reached.

    Employment:

    American workers are more productive than they were pre-pandemic. Federal Reserve Governor Christopher Waller said, “It fits with what we have been hearing from businesses about labor supply shortages. GDP is back to its pre-pandemic level, but we have recovered only 14 million of the 22 million jobs lost last spring.”

    With nearly 8 million job openings nationwide and many employers struggling to find workers, 22 GOP led states, including Arizona, opted to end the additional $300 in weekly pandemic unemployment benefits early. In Arizona, those benefits will expire on July 10 rather than in early September. There are just over 6.6 million people receiving Pandemic Unemployment Assistance nationwide.

    Despite the dismal April jobs report, the weekly jobs report released yesterday shows that 444,000 people filed for initial unemployment benefits, down 7% from the previous week and hitting an all-time low since March 14, 2020, when it was 256,000. In Arizona, we had a 27% decline in initial unemployment claims. Continued unemployment claims, known as insured unemployment, increased by 0.1% week over week to 3,751,000. In Arizona, that number declined by 4% to 52,836.

    While the unemployment numbers remain high, experts predict Arizona will add 116,900 jobs by the end of 2021, which would put us ahead of our pre-pandemic numbers, according to the Economic Club of Phoenix, a unit of the WP Carey School of Business at ASU. In April of 2020, Arizona lost 331,000 jobs.

    Source: US Department of Labor

    National Real Estate:

    Single-family housing starts in April declined 13.4% from March, putting us at an annual rate of 1.09 million single-family starts. Builders blame supply chain and labor shortages for the decline.

    As people are out and about more, the personal savings rates will decline. Dr. Lawrence Yun, Chief Economist for NAR, expects “revenge spending” on more services and entertainment in the coming months which will slow some of the frenzy we have been experiencing. He also expects that bidding wars will not be common by 2022.

    Single-family inventory increased again this week by 1% to 313,577. Experts predict inventory to gradually increase by about 1% a week over the next few weeks. There are no signs of distressed listings coming to market. This gives our exhausted buyers more flexibility and room for negotiation. As you can see below, we have only had 3 weeks of inventory increases in the past year.

    71% of new listings went under contract in less than a week, a slight decrease from last week’s 73%. Expect strong demand through June.

    Home sales prices were flat this week at $395,000 and new listing asking price dropped from $365,000 to $360,000. For the past month, new listing asking prices have stayed flat so prices are no longer skyrocketing, on a national level. Normally the asking prices top out in May, last year it did in July. The new listings prices lead the market by about a month. Then closed listings followed by a month and then the headlines follow by another month.

    The AZ Market:

    From July 2019 through July 2020, Phoenix ranked #1 in net migration. We had 89,000 people move here or 244 per day. In 2020 alone Phoenix grew by 106,008 people, ahead of the 10-year average of 85,562 people a year.

    According to the Information Market, in Maricopa County, new home sales are up year to date by 8.6% and resales are up 22.3%. In April, the median sales price for new homes was up 24.6% year over year. For resales, it is up 32!!

    For more in depth information specific to greater Phoenix, see my update from last week, here.

    Lending:

    It is no surprise that mortgage demand declined in April from March but remain significantly above last year’s totals. Demand has been slowly declining since March. The continued low inventory combined with affordability pressures is still to blame. Experts predict there will be a modest rise in rates this year, which will likely further impact demand as well.

    1031 Exchanges & Proposed Policy:

    President Biden’s proposed American Families Plan does not completely eliminate 1031 exchanges but it does cap the amount allowed in the exchange. The plan allows for up to $500,000 in capital gains deferral.

    A study from the University of Florida shows that the average size of a 1031 exchange transaction from 2010 to 2020 was $500,000; which is far smaller than institutional commercial real estate transactions. Walker & Dunlop’s average transaction amount is $49 million and they do not use 1031 exchanges.

    Real Estate News:

    • Fannie Mae recently revised down the expected existing home sales counts due to rising mortgage rates and potential inflation. The article states, “Homes will sell at an annual pace of 5.88 million during April, May and June. That’s down from the previous forecast for second quarter sales to come in at 6.16 million, annualized.”
    • National mortgage delinquency rate improved in April as 400,000 borrowers became current on their loans. The delinquency rate declined to 4.66%, a 7.08% decline from March’s rate.
    • On Wednesday, Zillow launched an in-app calling feature which allows potential buyers to call an agent directly without ever leaving the app. The Realtor has 30 seconds to answer before the call is then routed to another Premier Agent.
    • Two of the country’s largest single-family rental REITs upped their rates on vacant home in April by a lot. American Homes 4 Rent increased 11% and Invitation Homes increased by 10%.
    • Popular CRM, Liondesk announced last week that it is being acquired by Lone Wolf Technologies. As the system integrates with Lone Wolf, users may see some changes.

    Cryptocurrency:

    Yesterday, the IRS announced that “businesses that receive crypto assets with fair market value of more than $10,000” must be reported. This is part of President Biden’s proposed American Families Plan. The announcement comes on the heels of Bitcoin’s peak earlier this week at nearly $65,000 and then an immediate decline to just below $40,000 after a similar announcement that China is planning its own cryptocurrency regulations.

    Final Thoughts:

    While yes, the inflation numbers are more intimidating than we would like, these are short-term numbers and are expected to fall and normalize over time to a more balanced level.

    Demand is declining some but remains stable. Inventory is rising but is coming from such a small number it needs to rise for some time before it becomes a concern.

    For those who remain afraid of a bubble, I quote one of my favorite housing economists, Logan Mohtashami of HousingWire, “Home prices, on the other hand, are rising too fast. When you have the best housing demographics ever recorded in U.S. history in the years 2020-2024 and the lowest mortgage rates ever recorded in history, then the notion that housing demand will collapse is, in a word, ridiculous. Along with stable demand, the financial balance sheets of our current homeowners are solid. But hey, in America, trash sells, no matter how unbelievable.”

    Copyright 2021 Sarah Perkins

  • Greater Phoenix Real Estate Update 4/23/2021

    The pandemic created involuntary savings. People simply couldn’t spend the way they had in the past, and all of a sudden they had money for a down payment. Along with historic low mortgage rates and the ability to work remotely; the extra savings enabled super strong demand. As the economy opens up and people are able to spend their money on more services like concerts, eating out, and traveling the buyer demand is likely to subside modestly. Today’s ideal demographics (see last week’s post for details) will keep replacement buyers steady through 2024. As the demand fades to slightly elevated from crazy hot, the market will return to normal sales cycles.

    Despite movement towards normal, sales prices continue to grow. While yes, inventory has increased, locally it remains over 77% below normal and demand has decreased, it is still over 8% above normal. This supply/demand imbalance is so severe, it will take years to correct, and is why sales prices continue increasing at an appreciation rate of nearly 22%, year over year.

    Bull versus Bubble:

    There is a difference between a bull market and a bubble market. Real estate experts agree, we are currently in a bull market. Here are some basic indicators to illustrate the differences:

    • Is it true or false demand? Are the properties occupied by either renters or owners? True demand is when people are living in the property. False demand is when investors park money in the asset with no plans of using the property. Today homes are lived in.
    • Are rents increasing with sales prices? Rents, like sales prices, increase with greater demand and less supply and decrease with less demand and increased supply. Rental rates decreased during 2004-2006 and today they are increasing faster than sales prices in greater Phoenix. There are some markets, like San Francisco, where rents are falling while sales prices are increasing indicating the market is overvalued.
    • Huge increases of speculative buying on credit (bubble) versus cash buyers and down-payment buyers (bull).
    • What are the fraud levels? The higher the fraud levels, the higher the likelihood of a bubble market. If you were in the business during 2004-2006, chances are good you know someone in prison. Today, there are exhausted buyers and sellers who are unsure where they will go; the price appreciation is based on supply and demand, not collusion.

    National Real Estate:

    Existing homes sales declined by 3.7% from February to March, a smaller decline than the 6.6% decline from January to February. Both declines are attributed to the low inventory levels.

    “Consumers are facing much higher home prices, rising mortgage rates, and falling affordability, however, buyers are still actively in the market. The sales for March would have been measurably higher, had there been more inventory. Days-on-market are swift, multiple offers are prevalent, and buyer confidence is rising.”

    -Dr. Lawrence Yun, NAR’s Chief Economist

    It happened – for the first time in 52 weeks – not only did inventory not drop last week, it increased by 5,000 listings so now we are up to 312,000 available single family listings nationwide, which is an increase of 1.6%.

    Demand remains high; immediate sales also increased, up 3,000 from last week to 26,000 new single-family listings hit the market and went under contract in less than 24 hours.

    The high demand delayed the normal season cycle by about a month, normally by mid-March inventory starts climbing for peak buying season, which is normally March – June. In housing, normal is ideal.

    In addition to buyers having more options, an increase in available listings allows more time for appraisals.  So appraisers can get caught up and increases the likelihood of homes coming in at value.

    This week, the national median sales price increased by $5,000 week over week to $380,000 and the median asking price of new listings increased by $10,000 week over week to $360,000. Sales prices will keep climbing until about June 30th. Then they start to slow because cheaper homes tend to sell more in the 2nd half of the year.

    Homeownership Rates:

    In 2020, homeownership grew by 2.6% or by 3.9M new homeowners to 67.4% and the majority of that gain took place during Q2 2020 and Q3 2020.

    From 3Q 2019 to Q3 2020, Arizona’s homeownership rate increased by 4.1%, up to 71%. Arkansas had the biggest gain at a 7.1% increase, while New Jersey’s homeownership rate declined by 4.4%. West Virginia has the highest homeownership rate at 78.6%.

    The AZ Market:

    According to Redfin, nationwide luxury home sales increased by 41.6% in Q1 2021, year over year. In greater Phoenix, luxury home sales prices are up 25% in Q1 2021, year over year.

    New Construction:

    Nationwide, single-family permits increased from February to March by 4.6%. Single-family completions increased from February to March by 5.3%.

    Housing starts, considered an economic leading indicator, increased by 37% in March, year over year, and increased by 19.4% from February to March, though February’s level was lower than expected due to the winter storms.

    “In nearly every market, 20% more inventory means 20% more home sales. Today’s news on the new home construction surge is, therefore, highly welcomed, especially in light of major challenges on material costs and soaring lumber prices.”

    -Dr. Lawrence Yun, NAR’s Chief Economist

    According to Freddie Mac, builders need to build 3.8 million single-family homes just to meet current demand levels. The lag of new construction over the past decade has contributed to today’s low inventory.

    In 2020 builders built about 65,000 entry-level homes while 2.38 million renters became first-time homeowners.

    “As we navigate our way through the year and get beyond the pandemic, we expect the housing supply shortage to continue to be one of the largest obstacles to inclusive economic growth in the U.S. Simply put, we must build more single-family entry-level housing to address this shortage, which has strong implications for the wealth, health and stability of American communities.”

    -Sam Khater, Freddie Mac’s Chief Economist

    Commercial Real Estate:

    • The local office market has suffered four straight months of increased vacancies putting the vacancy rate at the end of Q1 2021 at 19.1%!

    “A year-plus of forced acceptance of remote services in every sector has carved permanent change into our behavior. And, few sectors have seen a more radical transformation than office work.”

    -Scott Galloway, Author & NYU Business Professor
    • Many major companies are making plans to reduce their commercial real estate footprint. JP Morgan Chase is planning to significantly reduce its commercial space as 10% of its employees will work from home permanently. CEO Jamie Dimon said, “Remote work will change how we manage our real estate.”
    • Office rents are expected to decline by 15% nationwide.

    Lending:

    • Purchase mortgage applications increased by 7% last week from the previous week and are up 57% year over year. We still have a few more weeks of year over year data comparing last year’s lockdown market to this year’s high demand/low inventory market.
    • Despite expectations of interest rates reaching 3.7% this year, the Mortgage Bankers Association is forecasting a 16.4% year over year increase in purchase mortgage volume which would set a new record at $1.67 trillion.

    “The housing market is incredibly strong this year, with robust housing demand in nearly every part of the country, driven by the improving economy, households seeking more indoor and outdoor space, millennials reaching their prime homebuying years, and still low mortgage rates. A lack of supply is the biggest hurdle to an even larger increase in home sales. The widening imbalance of supply and demand is driving up home-price growth and eroding affordability – especially for entry-level buyers.”  

    -Mike Fratantoni, MBA’s Chief Economist and Senior Vice President

    Real Estate News:

    • According to a recent Harvard report, due to last year’s lockdowns about 76% of homeowners completed at least one home remodeling project. The complexity and scope of the projects are increasing as homeowners are willing to spend more as home values rise. It is expected that in 2022 homeowners will spend $370 billion on home improvements.
    • iBuyer acquisitions are nearing their Q1 2020 numbers. While Phoenix remains the national leader in iBuyer activity, the margin of that lead is shrinking and Atlanta is catching up. Meanwhile, the two cities have significant leads ahead of the four remaining largest iBuyer markets in the country: Dallas, Charlotte, Las Vegas, and Raleigh.

    Final Thoughts:

    As one of my favorite housing economists, Logan Mohtashami with HousingWire recently wrote, “The nature of yellow journalism in our society is that fear and loathing sell. Impending doom is somehow sexy and gets many eyeballs and clicks, whereas the standard economic truth does not. People like myself who spend their time yammering on about demographics, prime-age employment to population levels, and how much shelter inflation can move Core CPI, are pleasant to listen to when the double martini doesn’t do the job of putting you to sleep. I get it. Stick to the facts, don’t get sidelined by the sideshow, and we will all be better off.”

    Copyright 2021 Sarah Perkins

  • Greater Phoenix Real Estate Update 4/16/2021

    Despite our fear of change, humans are quite resilient and are far more flexible than we realize. Quite often, change is good. Demand is declining and seasonality is beginning to emerge in the market. I am hearing stories about an FHA buyer who finally had a contract accepted and a seller who agreed to a few concessions. This is good news for our exhausted buyers; they need some wins too. This is how the machine is supposed to work.

    Demographics:

    The post-2008 market crash recovery was the weakest recovery in real estate history. Nationally we have been in a seller’s market since 2012, here in AZ it has been since 2014 (we had a deeper hole to climb out of than most of the country). From 2017-2020 resale closings ranged from 5,340,000 (2018) to 5,640,000 (2020); that is not a huge variation.

    There are more than 32,400,000 Americans aged 27-33. This is the largest group, in the largest generation and this is the prime time for getting married, having babies, and buying houses. Logan Mohtashami, senior economist at HousingWire says, “This is when people date, mate, and buy real estate.”

    The demand wasn’t here 10 years ago but it is here now and likely to stay elevated through the end of 2024. The combination of high demand and low inventory indicates we will stay in a strong seller’s market for years to come. The biggest problem buyers face today is declining affordability.

    New Construction:

    Builders have been underbuilding since 2009 due to the extremely slow recovery. The baselines for months of inventory for new homes is different from resale. At 6.5 months, builders stop building. At 4.4-6.4 months builders are ok as long as sales are consistent. Under 4.3 months builders are happy and building as fast as possible. Nationwide there is a 3.3 month supply of new homes. The building frenzy is warranted.

    While many are looking to builders to solve our inventory crisis and therefore aid in slowing this massive appreciation, builders will not overbuild. Builders are sellers, they want to maximize profits too. Like many of us, they too remember the pain of the crash and adjusted their business models accordingly.

    Lumber costs are the most notable, having nearly tripled in the past 12 months, but other material costs have increased also. Combine that with the labor shortages and huge demand, costs continue to rise for builders, who then push the additional costs to the buyers.

    Institutional Investors:

    Since the end of the Great Recession, institutional investors have purchased over 7M single-family homes to keep as rentals. These buyers are home rental firms, like Invitation Homes which owns about 80,000 houses in 16 markets, private equity, pension funds, sovereign wealth funds, etc.

    According to John Burns Real Estate Consulting, institutional investors are currently purchasing about 20% of all single-family homes in the US. Due to the continuously climbing rental rates in Phoenix, these buyers are purchasing about 30% of the single family supply. They pay cash and will go over the asking price in order to secure the property; something many buyers simply can’t compete with. Additionally, these properties are held longer than a typical owner stays, meaning these properties are being completely removed from the market.

    National Real Estate:

    Many industry experts predict that 2021 will have more sales than 2020 despite the low inventory. NAR predicts 6.5M resale closings, which is significantly up from 2020’s 5.64M resale closings. We do have strong demand and the market is, very slowly inching towards thinking about maybe trying to get closer to being normal, demand is not booming, which makes me doubt that 6.5M sales projection.

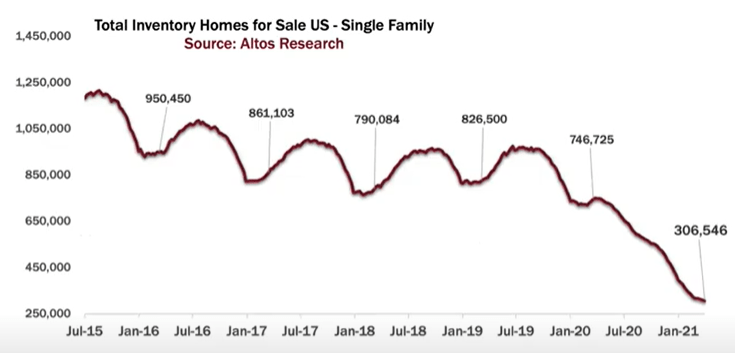
    Single-family active listings declined by another 3,000 listings this week so we are now down to 306,546. We may have another week or two of declines and by May, it is likely we will start to see an increase in inventory. Inventory levels are expected to stay low for years but not at these low historically low levels.

    Prices have stabilized, for the past 3 weeks, the median new listing asking price has remained at $350,000. Expect this to fall as we get later into the year. During normal cycles, more expensive homes are listed in the first half of the year.

    While prices and inventory have started to stabilize, the speed of homes going under contract has not. 38% of single-family homes went under contract within hours of listing and 70% sold in less than a week on the market.

    The AZ Market:

    The Case-Shiller Index measures residential values using a very specific set of data and guidelines and runs a couple of months behind the current market. Many large institutions, including the US Census, use it to gauge appreciation. The most recent data is from January and it shows, for 20 months straight, that Greater Phoenix has the highest appreciation rate in the country. January came in at 15.8%. More info on Case-Shiller click here and here.

    Demand is dropping, as of yesterday, it is 9.2% above normal. And inventory is increasing, it now only 77.7% below normal. Active listing supply is down over 70% from last year (during lockdown protocols). The median sales price is up over 18% year over year to $360,000.

    Remember in January 2020, when Tina Tamboer with the Cromford Report told us to expect a 10% appreciation in 2020 and it was shocking? I do. A lot has changed since then.

    Lending:

    • Many experts believe that despite rising interest rates (with the exception of the past 2 weeks) buyer demand will not dampen. In a press release from March, Fannie Mae stated that while some buyers are being pushed out of the market, an ample amount of buyers remain.
    • For the second week in a row, 30 year fixed mortgage rates declined. Despite the drop Freddie Mac expects rates to rise slowly throughout 2021.
    • While interest rate increases often make people nervous, remember the largest home purchase year in history was 2005 and rates were about 7.5%.

    Forbearance:

    The forbearance numbers saw one of their largest improvements this past week, dropping down to about 2.3 million borrowers or 4.66% of loans. That is down from 4.9% the previous week.

    “Almost 32 percent of borrowers in forbearance extensions have now exceeded the 12-month mark. In terms of performance, more than 88 percent of homeowners who have exited into deferral plans, modifications or repayment plans were current on their loans at the end of March, compared to 92 percent of all homeowners. The accelerating economic recovery in March helped more homeowners recover and become current on their mortgages, in addition to helping other homeowners with more stable financial situations exit forbearance.”

    Mike Fratantoni , MBA senior vice president and chief economist

    Policy:

    President Biden’s first-time homebuyer tax credit has evolved and was submitted to Congress on Wednesday. In the current iteration of the legislation, it is less of a tax credit and more of a down payment assistance program offering up to $25,000. Eligibility requirements include but are not limited to buyers who have not owned a house in the past 3 years, none of the borrowers’ parents may have owned a house unless they lost it due to foreclosure or short sale, income limits, and additional funds are available to groups recognized as socially disadvantaged. For more information click here.

    Real Estate News:

    • After multiple failed attempts to acquire CoreLogic, CoStar, which is heavily involved in commercial real estate, plans to acquire Homes.com for $156M as it continues to enter the residential space.
    • California Regional MLS, the country’s largest MLS with 104,000 members, has declared Saturday a business day. Some suspect it is to prevent a loophole in the Clear Cooperation Policy.
    • The SEC is warning investors about an increase in “lawsuits alleging inadequate disclosure by SPACs.” Going public via SPAC has been perceived as a cheaper, easier process than via IPO. However, in November, Harvard published a study showing that SPACs are more expensive than an IPO and investors are paying those added costs, for now.

    Final Thoughts:

    Today’s market is nothing like that of 2005 but the intensity of it feels very similar. As the market begins to cool, fear will rise, the 2008 crash wasn’t THAT long ago, right? A lot has happened in 13 years.

    That hasn’t stopped the housing fear Googling though. Searches asking, “When is the housing market going to crash?” increased by 2,450% in the past 30 days. Searches asking, “Why is the market so hot?” doubled in the past week. And searches asking “How much over asking price should I offer on a home 2021?” increased by 350% in the past week.

    Let’s spread the word, housing is, hopefully, starting to normalize which is good for everyone. Prices will continue to rise but at a slower rate.

    Copyright 2021 Sarah Perkins

  • Greater Phoenix Real Estate Update 1/29/2021

    The frequency in which I am asked, “Is real estate headed for a crash?” is increasing, by a lot. Given the enormity of uncertainty we have lived with for nearly a year, the question isn’t surprising. Things are going well in real estate and with the limited good news, it is easy to wonder when the other shoe will drop.

    Research professor, Dr. Brene Brown, calls this foreboding joy and defines it as “we are terrified that joy (or a strong housing market) will be taken away from us so we push it away. We beat the pain to the punch. As a result, we don’t fully experience joy and all that it has to offer. We limit our joy.” The pain of the 2008 market crash is still very raw for real estate professionals and consumers alike.

    The headlines and talking heads do not help our human tendencies towards negativity bias and confirmation bias. Consumer sentiment drives our decisions which are then reflected in everything we buy from toothpaste to houses.

    National Real Estate:

    Supply:

    • Inventory dropped to the lowest level since NAR began tracking in 1982.
    • Demand continues to outpace supply. We are now down to about 380,000 single family active listings nationwide, a drop of about 9,000 listings. Despite the drop in active listings, about 48,000 new listings hit the market last week, down from a year ago, but up from a week ago. This shows how quickly things are selling.
    • The current market data is somewhat distorted because so many listings are going from coming soon status, which is not trackable, to pending status completely skipping active status altogether. This means there are actually more listings than the data shows. This is true on the national and local levels.

    2020 Sales:

    • It is official, 2020 had 5.54 million existing home sales, exceeding 2019 by 5.9%!  That is more sales than we have had since 2006.
    • If we had more inventory, economists believe we could have had upwards of 7 million sales.
    • December’s resale closings were up 0.7% from November and up 22.2% from December 2019.
    • Median sales price increased by about 13% in 2020.
    • December marked the 106th straight month of annual price increases.

    “Home sales rose in December, and for 2020 as a whole, we saw sales perform at their highest levels since 2006, despite the pandemic. What’s even better is that this momentum is likely to carry into the new year, with more buyers expected to enter the market.”

    Dr. Lawrence Yun, NAR Chief Economist

    Prices:

    • Patrick Kearns of Inman wrote, “The inventory and affordability challenges have led to disproportionate growth in higher-priced tiers, according to Joel Kan, the associate vice president of economics and industry forecasting at the Mortgage Bankers Association. December average loan sizes were the highest ever recorded in the company’s weekly market survey.”
    • The appreciation is putting pressure on affordability, significantly impacting first time home buyers, who make up one-third of all sales.
    • Listing price increases used to be unusual but look at this. Often a sign of fix and flippers; increases usually have a normal seasonal cycle. Demand increases then prices increase. It is usually only a few percentage points but now we are at a much higher level.
    • February and March sales prices will be way up due to today’s increased listing prices.
    • Also illustrates how sensitive the market is to interest rates.

    New Construction:

    Builder confidence did drop slightly in January to 83, its highest point in 14 years. Anything above 50 means favorable market conditions. Builders are faced with increased lumber costs, labor shortages, upward price pressures, and COVID. In the face of so many obstacles, the fact that confidence is so high is incredible.

    The AZ Market:

    In Greater Phoenix there are fewer than 3,200 single family active listings and only 4,500 total active listings. That is down about 300 from last week and down 42% year over year.

    Listings are down while pending sales are up 13% year over year and closings are up 28% year over year. This translates to inventory being 76% below normal while demand is 28% above normal. A true supply and demand imbalance benefitting home sellers over homebuyers.

    Elliott Pollack wrote, “Greater Phoenix saw increases for permits and new home sales while resales held their own with small contraction according to RL Brown. For the year, new home sales were up 21.3%, permits 13%, and resales were down 0.2%. Looking at the December data, median sales price for resales and new home sales increased 18.4% and 2.0%, respectively. Again the lack of resale supply continued to push prices higher in the metro.”

    CBRE’s US Development Opportunity Index evaluates the top 50 largest cities by population based on four metrics: 1. Construction costs, 2. Fundamental strength of existing supply, 3. Prior cycle performance, and 4. Property forecast. Phoenix ranked second for office and multifamily development opportunities, third for industrial, and 15th for retail.

    Ivy Zelman of Zelman & Associates, discussed the Great American Shuffle when she said, “From 2010 to 2020, the top ten states have grown substantially faster than the United States as a whole and, frankly, builders have been a big beneficiary of this because there is actually space and ability to develop land in these markets.”

    Arizona saw an 18% increase in household growth from 2010-2020.

    Delinquencies, Forbearance, and Foreclosures:

    The forbearance numbers remain relatively flat with about 2.7 million borrowers in a plan. About 44% of borrowers who exited their forbearance plan are either caught up or never missed a payment. 13.4% of borrowers exiting their forbearance plan do so without a loss mitigation plan in place. For more details, check out my post from Wednesday here.

    Keep in mind not everyone who is delinquent on their payments are in forbearance. According to Black Knight, after seven straight months of declines, at the end of December, there were about 3.4 million loans in delinquency or 6.08%, the lowest level since April. Loans that are seriously delinquent declined from 2.19 million to 2.15 million.

    The biggest unknown we are facing is the impact of the eviction and foreclosure moratoriums. They are set to expire on March 31st. The proposed $1.9 trillion stimulus includes extending both through September 30th.  While it provides relief to those who need it now; it also kicks the can down the road and doesn’t provide a real solution.

    Lending:

    • It is completely normal to have weekly ups and downs when tracking mortgage applications, the year over year data is what shows overall trends. One week to the next is too volatile.
    • Despite the headlines demand remains strong. Purchase loan applications are up 16% year over year.
    • Refinance applications are up 83% year over year.

    “Although mortgage rates are projected to increase, they will continue to hover near record lows at around 3 percent. Moreover, expect economic conditions to improve with additional stimulus forthcoming and vaccine distribution already underway.”

    Dr. Lawrence Yun, NAR Chief Economist

    Final Thoughts:

    Ivy Zelman also discussed the biggest challenge facing today’s market, the low inventory. There are not enough homes available to satisfy the demand in the market. Based on history, the imbalance protects the housing market from dips during tough economic times.

    After the 5.3% increase in sales from 2019 to 2020; Zillow predicts that 2021 will see an increase of 21.1% in sales over 2020. Zillow predicts 6.82 million existing home sales in 2021, roughly the same number of sales as 2005.

    Based on today’s data; there is no indication of a crash or even a fender bender.

    “When I think about the 2020 housing market, the big take-home is not the V-shape recovery in many of the housing metrics or even the hotter-than-expected price growth. The big take-home is that 2020, despite the COVID crisis, began a period in our country (the years 2020-2024) when we have both the best housing demographics ever combined with mortgage rates low enough to keep housing stable for years to come.”

    Logan Mohtashami, Lead Economic Analyst for HousingWire

    Please share this with your colleagues and clients.

    Copyright 2021 by Sarah Perkins

  • Greater Phoenix Real Estate Update 12/4/2020

    Economists, government officials, and health professionals are preparing for a rough winter and then a very promising spring/summer. What does that mean for real estate? Not all experts agree.

    Let’s talk about 2021 projections.

    National Real Estate.

    At 6.85 million, 2020 is expected to have 3% more existing home sales than in 2019. (would you have believed that in May?!?) Dr. Lawrence Yun, Chief Economist for NAR expects a 9% increase in resale homes sales in 2021 over 2020. New builds increased 20% year over year in 2020 and Dr. Yun is predicting a 23% increase in new builds in 2021, year over year.

    “My economic forecast is that in 2020, it is a recession, but in 2021 with the vaccine discovery and availability, it will be positive. The interest rate environment will continue to be low, inflation not really a problem. Mortgage rates should remain stable near 3 percent all the way through 2021.”

    Dr. Lawrence Yun

    In the US there are about 140 million housing units. Of those, about 84 million are single family homes. (Greater Phoenix has about 2 million housing units and just over 1.4 million single family homes) Last week, for the first time in history, the number of single family homes for sale nationwide dropped to just below 500,000. There were only 55,000 new listings to come on the market, fewer than the amount that came off the market. Past trends show that available listings typically drop 1-2% a week from Thanksgiving through the second week of January. It is likely we will end the year with 450,000 single family homes available. Once we hit that, 0.5% of single family homes will be listed for sale. With these inventory levels, home prices will continue to increase. (Altos Research)

    With ever-decreasing inventory, transaction volumes could drop. Given the strong buyer demand, any drops would likely small. In October, on average, there were nearly 3.5 offers written for each property that went into escrow. (Matthew Gardner)

    Economy.

    GDP growth in Q4 2020 and Q1 2021 will likely be down. By Q2 2021 and certainly by Q3 2021 we will be back solidly moving in a positive direction with economic growth (barring any unforeseen circumstances).

    Economist Elliott Pollack said, “Prior to COVID-19, the economy was in the longest expansion in U.S. history. Until COVID-19, there was no end in sight. And now, thanks to the effects of COVID-19 on the economy, the spread between potential GDP and actual GDP is huge. It will take at least three years to get back to where the economy should be. Look for a quick burst but then continued above-normal growth for that entire period.”

    The chief economists from Redfin, Realtor.com, and KCM all stated that once the population is vaccinated and people are out spending money on services again, the increased economic strength could drive interest rates up, thus hurting affordability and ultimately decreasing buyer demand.

    Provided there is not another national lockdown, growth is expected throughout 2021. Dr. Yun said of consumer decisions, “Are the mortgage rates low, are the prices right, is the inventory available? It’s all about the economic factors [and] housing conditions.”

    Lending.

    “Assuming an effective vaccine”, Mike Fratantoni with the MBA says, “Our expectation is that 2021 will most likely be a year of a continued, but slow economic recovery, with a modest rise in mortgage rates, and the stubborn, ongoing housing market conundrum of inadequate supply in relation to demand.”

    “Rising yields on government bonds reflect new optimism about the U.S. economy. But the trend could bring unwelcome news for mortgage borrowers: Higher rates on 10-year Treasury notes generally mean rising rates for 30-year mortgages.” said Jeff Ostrowski, Bankrate Senior Mortgage Reporter

    David Childers of Keeping Current Matters believes that these interest rate projections may be revised upwards in the coming months.

    Jobs.

    Greater Phoenix remains the best performing major employment market in the country and has regained two thirds of all the jobs lost during the shutdown. Nationwide about 55% of jobs have recovered. (Elliott Pollack)

    Forbearance:

    To benefit from the CARES Act forbearance plans, borrowers must be enrolled by 12/31/2020.

    After 25 weeks without having an increase in loans in forbearance, last week was the second week in row with increases. We went from 5.48% to 5.54% of loans are in forbearance which is around 2.8 million loans. The biggest reason for the increase is that fewer borrowers are leaving their forbearance programs than in the previous weeks. Other reasons are that re-entries increased slightly and loans in extension increased slightly. Initial entries remained about the same.

    Borrowers in forbearance are protected against penalties and foreclosure even when late on their payments, however they are still counted in the delinquency numbers.

    With 3.4 million mortgage delinquencies, the rate declined to 6.44%, the lowest level since March. (FHFA)

    The AZ Market.

    ASU forecasts that Arizona will be back to economic normalcy by the end of 2021.

    Greater Phoenix has about 4 buyers for every available listing. In order for the Phoenix market to be balanced we would need 25,000-35,000 active listings, we have 7,300. Aside from New York and San Francisco all other major metros are in similar situations. There are some areas in the country that have sufficient inventory for the demand giving us a national average of about 3 buyers for every listing nationwide.

    In November, builder DR Horton purchased 2,783.13 acres of state land just south of Apache Junction. Bidding started at $68 million and the land sold for $245.5 million. (Daily Independent)

    Real Estate News.

    • For the fourth time, FHFA extended the foreclosure and eviction moratoriums to January 31, 2021. (HousingWire)
    • Offerpad partners with New Home Star, the country’s largest seller of private homes. The partnership is effective immediately in Florida; Phoenix and San Antonio are the next two markets to launch. (Inman)
    • Airbnb files with the SEC to go public via IPO with a valuation of $35 billion. (Inman)
    • Rumors are flying that real estate brokerage Compass has begun prepping for its own IPO. (Bloomberg)

    Real Estate Trends.

    • Mortgage interest rates have hit all-time lows 14 times this year. (MBA)
    • In greater Phoenix single family new homes sales were up 19% in October, year over year. (Jim Belfiore)
    • 19% of buyers paid cash in 2019 and 2020. (HousingWire)
    • Demand for primary homes is up 50% and for second homes is up 100%, year over year (Redfin)
    • Nationwide, condo sales in October were up nearly 23% after a 50% decrease in March-May. (Redfin)

    Final Thoughts.

    Continue to be mindful of the headlines. Misleading messages harm consumers and consumer sentiment matters. The low inventory may lead to a drop in sales, but that is not due to lack of interest, it is due to lack of supply. In 1710, writer Jonathan Swift wrote, “Falsehood flies, and the Truth comes limping after it.” Today, 310 years later, this statement remains valid.

    Please share this with your colleagues and clients.

    Copyright 2020 by Sarah Perkins

  • Afternoon Bite 7/13/2020 (Video)

    Every Monday afternoon Amber Kovarik and I talk about what happened this week in our local and national real estate market in 15 minutes or less.

    Today’s Takeaways:

    The AZ Market:

    • Listings under contract are up nearly 20% year over year while active inventory is down 43% year over year. There are roughly 8800 available listings in our market, we should have 25,000 minimum for a market of our size.
    • Monthly median sales price increased by over 11% year over year. Supply and demand.
    • We have 1.5 months of inventory. Normal used to be 6. Three sounds great.
    • Nationally inventory has been dropping since September of 2019.
    • Mortgages in forbearance dropped for the 3rd week in a row.

    Other Real Estate News:

    • After a decade of growth in public transportation use, the car is king again.
    • Pop-up drive-in theaters are emerging in mall parking lots and other unused large open commercial spaces.
    • State and local legislators across the country working to pass upzoning laws. This would allow multi-family housing structures on land zoned for single-family residences.
    • Commercial mortgage-backed security delinquency rates increased to 10.32% in June, nearly hitting an all-time high. The June 2019 delinquency rate was 2.84%.
    • According to the Federal Reserve, the results for the Dodd-Frank mandated stress tests required for banks show that the largest American banks could lose as much as $47.6 billion on commercial real estate loans over the next two years.
    • According to a study by Apartment List released Wednesday, 32% of Americans did not make a complete July housing payment within the first three days of the month. This number will decrease throughout the month. In June it dropped from 30% to 11% of people who did not make their June housing payment in full.
    • Last week the US Supreme Court ruled that the Consumer Financial Protection Bureau (CFPB)’s structure (not the agency itself) is unconstitutional.
    • Last week Airbnb announced renters under 25 who have fewer than 3 positive reviews will not be able to book single-family residences near where they live.
    • The new Chinese National Security Law cracking down on dissent in Hong Kong is making American real estate investors question their investments.
    • Quicken Loans filed for IPO as Rocket Companies.
    • The real estate industry received 3% of the total money distributed by the Paycheck Protection Program (PPP) 
  • Phoenix Area Real Estate Update 6/26/2020

    The top real estate experts and economists expect to see a strong housing market through the summer. While there is no reason to expect anything but positive growth, there are a number of outside factors that could negatively impact the housing market. It is important to be mindful while being optimistic. Shifts of this magnitude have never happened so quickly and there are no guarantees. This is not the market for “wait and see.”

    The AZ Market:

    Cromford Market Index (CMI): The CMI is the best leading indicator available (balance is 100, above 100 is a seller’s market and below 100 is a buyer’s market. Prices rise at 110 and drop at 90). On March 20, the CMI peaked at 241, and yesterday it was at 214.3, up from the bottom of 145.2 we hit on May 15 and up over 20 points in the past seven days.

    Supply: Our local inventory has been dropping every day since May 12. As of yesterday, our inventory is 54% below normal. In the past seven days we have dropped by 2.4%. Our total active inventory is down nearly 28% year over year. That sounds like a lot; then when we remove under contract accepting backups (UCB) we are down 42% year over year. We desperately need more listings.

    Demand: Pending sales are up over 18% month over month and up 15% year over year. Our demand is 1.4% below normal and increased by nearly 10% in the past fourteen days. According to Showing Time, in AZ, physical requests peaked on February 22 and then immediately dropped by 63% through mid-April. We made up that drop and then some and have seen a slight decrease of nearly 2% in the past week. Buyers cannot look at houses that are not for sale. Inventory continues to struggle to keep up with demand.

    Sales & Prices: Phoenix’s closed sales are down just over 15% year over year; nationally we are down 27% year over year. The median sales price is 8.4% up year over year. Dr. Lawrence Yun, NAR’s chief economist, said, “Sales completed in May reflect contract signings in March and April — during the strictest times of the pandemic lockdown and hence the cyclical low point. Home sales will surely rise in the upcoming months with the economy reopening and could even surpass one-year-ago figures in the second half of the year. New home construction needs to robustly ramp up in order to meet rising housing demand. Otherwise, home prices will rise too fast and hinder first-time buyers, even at a time of record-low mortgage rates.”

    Southeast Valley New Listings, Pendings, and Closings:  This week over week comparison for Tempe, Mesa, Chandler, Gilbert, Apache Junction, and Queen Creek since March 15 shows this week’s increased demand and decreased supply. Only time will tell if it is pent up demand or actual demand. Based on February’s demand it is likely to be actual. Closings always increase at the end of the month.

    Other AZ News:

    Multi-billion dollar business, Smead Capital Management announced their relocation from Seattle to the Camelback Corridor in Phoenix. Despite higher taxes in Phoenix, the company’s president and CEO, Cole Smead, is moving the company because of the lower cost of living and a larger pool of talent for recruiting in Phoenix. He also stated, “The unrest that has taken place in the city of Seattle … there really is not a downtown business community today.”

    Arizona gained 45,300 jobs in May, which is impressive since the economy did not reopen until May 16. That is an increase of 2.4% and above the national average. Arizona’s unemployment rate through May was 8.9% which is better than the national unemployment rate of 13.3% through May. Arizona is second to Utah for employment performance year to date, meaning our state retained the second most jobs of any state by percentage of the population.

    Phoenix metro is the fastest-growing major employment market in the country year to date. That means we have lost the fewest jobs, as a population percentage, in the country. This could have major implications for real estate. A larger employed population could lead to fewer potential issues down the road.

    Economy:

    Prior to COVID, we used quarterly economic data to analyze the market and create projections. Today’s environment is changing too quickly for that data to be sufficient so we have to use other options, daily or weekly data, known as high-frequency data, which is what we have to use today to analyze the economy. These are high-frequency data points:

    • Vehicle sales were up 44% in May over April. Vehicle sales make up about 20% of retail sales. Year over year retail sales are down only 6.1%.
    • Hotel occupancy rates reached nearly 42% last week, up from the bottom of 32% the week of May 18. It is still down 42% year over year.
    • TSA’s weekly traveler report shows the week of June 13 we were down 82% year over year which is better than the 91% year over year drop we had in mid-May.
    • According to OpenTable, restaurant reservations are down 64% year over year as of June 18.
    • Seated diner traffic in Phoenix is down 51.2% year over year, an improvement from the year over year decline of 84% last month.
    • Steve Hafner, the CEO of OpenTable, predicts up to 25% of US restaurants will permanently close. The Independent Restaurant Coalition predicts up to 80% of independent restaurants will close permanently. There are roughly one million restaurants nationwide, that prior to the pandemic employed roughly 15.6 million people.

    National Unemployment:

    There were 1.4 million new unemployment claims filed this week bringing the total number from mid-March to 47 million. Continuing claims dropped slightly to 19.5 million. Check out this chart from Matthew Gardner, Chief Economist for Windermere.

    Forbearance:

    According to Elliot Pollack, there are roughly 100 million loans, of varying types, on some sort of COVID relief program. This includes 4.2 million mortgages, 79 million student loan accounts, 7.3 million car loans, 1.3 million personal loans, and millions not paying rent or credit card balances.

    The good news (for lack of a better term) came from the Mortgage Bankers Association when they announced mortgage loans in forbearance decreased for the first time since March. For the week ending on June 14 total mortgages in forbearance dropped to 4.2 million, down from 4.3 million the week before. 8.48% of mortgages are currently enrolled in a forbearance program.

    Emerging Trends:

    • According to Zillow 2.7 million adults aged 18-25 have moved back in with their parents during March and April. That is a 9.7% increase in April year over year and 1.4% of the national rental market.
    • Home improvement spending is up. According to Lending Tree personal loans for home improvement is up nearly 8% year over year.
    • Large office buildings and other commercial property owners are re-evaluating policies regarding elevator and stair usage in order to maintain social distancing. High rise office buildings have to come up with new solutions to transport people to their destination.
    • Worldwide mass transit demand is down 59% since January.
    • According to the Urban Land Institute (ULI), there are about 13.5 million families renting making up about 1/3 of total renters. The ULI is calling for developers to create more rental options for families as this sector is expected to grow.
    • Shifts between the suburbs and the city are cyclical. From 2010 through 2018 cities grew faster than suburbs but as time went on the city demand slowly decreased as the suburban demand increased faster. Today’s shift towards the suburbs started in 2019 but was significantly escalated by the pandemic.
    • Vacation rentals are in high demand. The ones that are doing the best are the ones within about 2.5 hours of a large metro area. More people are driving to their vacations than flying.
    • As more businesses relocate to the suburbs, car dependency is expected to grow.
    • According to a survey by Apartment List, 30% of respondents said that they are less likely to move due to COVID 19. The report stated, “While Americans have historically moved more frequently than those in many other countries, the U.S. mobility rate has actually been declining for the past 35 years. According to the Census Bureau, over 20 percent of Americans changed homes in 1985; by 2019, that rate had been cut in half.”

    Other Real Estate News:

    • 42% of US homes are owned free and clear
    • Mortgage loan applications are up 20.1% year over year at an 11 year high.
    • There are 128 million houses in the US. 22.7 million are non-owner occupied. 6 million of those are owned by institutional investors like Blackstone. 16.7 million are owned by regular people or small investors.
    • Starbucks is changing its café’s footprints and closing about 400 locations while adding 300 new locations that do not offer dine-in options.
    • Homesnap and eCommission launched a new payment option that allows agents to purchase Homesnap products using future commissions.
    • According to HireAHelper.com the moving industry will have a revenue drop this year in a range of 12.2%-19.9% or an estimated $1.5 billion to $2.5 billion.
    • The exclusive iBuyer partnership with Offerpad and Keller Williams has ended, likely because of last week’s announcement that Offerpad will be listing and selling along with iBuying, putting them in direct competition with Keller Williams. KW will now also be working with other undisclosed investors for its iBuyer program.

    Final Thoughts:

    Coldwell Banker CEO, Ryan Gorman said, “If you’re contemplating moving, or are one of many people who are contemplating accelerating your life plan a bit, now is a moment to get your property into inventory. Get it prepared, get it priced, and get it on the market.”

    This is a great time to sell. Do not get distracted by the negative media; the best way to be part of the solution is by getting accurate information out and guiding your clients with the facts.

    Copyright 2020 by Sarah Perkins