Tag: #weeklymarketupdate

  • Greater Phoenix Real Estate Update 1/14/2022

    After nearly two years of headlines and non-experts forecasting a crash, a recent headline reads, “Housing costs will be ‘permanently higher’ following pandemic: Study”

    I expect to see more headlines like this and hopefully, they will reduce the, “I’ll wait until prices go back down” comments. Waiting has proven to be incredibly expensive. In 2021 alone, Greater Phoenix saw a 28% appreciation rate, and the entire country increased by about 15%. Emotionally, the 2005 market felt a lot like the 2021 market, but the fundamentals of those markets were entirely different. Simply put the 2005 market was based on tremendous demand while the 2021 market was based on nearly non-existent supply.

    “Given that pandemic housing trends are mostly preexisting trends accelerated, it’s possible home prices and rents would have risen to levels similar to where they are now even without the pandemic. It would have happened more evenly and more slowly. But looking ahead, it’s hard to conclude anything other than housing costs are going to be permanently higher moving forward.”

    -OJO Labs Housing Study

    National Real Estate:

    New listing asking prices are a leading indicator. This week the median new single family listing asking price is $353,900 up 11% from last week’s $319,000. This is a shockingly huge increase. Each January the new listing asking price jump with the spring demand. The speed and amount prices jump changes each year. 2021 had steep inclines in January, steeper than most years past, and this year that spike is even steeper.

    This is a massive spike. We are seeing the same patterns as last year, only sellers are more prepared for it this year and they want to take advantage of the market. This implies big price gains in closings in February and March. The total median asking price of the whole active market is up 1% in the week and is now $369,900. This indicates we are looking at another year of really big price gains.

    Another leading indicator is price increases. 5.6% of the active market has had their prices increase over the past few months. Meaning houses currently listed that were purchased last fall or withdrawn from the market have been relisted and are asking higher prices. Locally this helps understand investor fix and flips and iBuyers. It is an indicator of demand and investors are leaning into that demand. Activity last fall indicated that this spring was going to be a bit more mellow than last year but based on the current trends it looks like we are on track for another spring of intense bidding wars and fast sales which only drive prices higher.

    The AZ Market:

    There is still time to register and join today’s Cromford Market Update with Tina Tamboer at 10am. For details and registration, click here.

    Active inventory in Greater Phoenix remained flat this week with only 5230 listings. Supply remains 72% below normal and demand is 22.5% above normal. Prices are going up. While builders are building as quickly as possible, labor and supply chain delays prevent any meaningful increase in available homes.

    Both nationally and locally iBuyers sold 20% of homes to institutional investors. Based on analysis of about 6500 iBuyer sales in 2021 through November, the companies averaged a purchase price/sales price premium of $15,197. This includes a single property gain of $267,000 as well as a single property loss of $192,612. Thank you, Tom Ruff of the Information Market for sharing your awesome data with me!

    Nationally, apartments are being built at the fastest rate since 1980. Locally, we are expected to build 22,000 units in 2022, the most in the country.

    Greater Phoenix year over year rent growth through November was 25.9% with net absorption at record levels and a 96% occupancy rate in Q4 2021. These are huge numbers.

    “The inbound migration versus outbound is the best in the nation, and it’s attracting both Gen Z and millennials as well as baby boomers.”

    -Doug Ressler, manager of business intelligence at Yardi Matrix.

    Lending:

    Effective April 1, Fannie Mae and Freddie Mac have a new fee for high balance and second home loans. Georgia Kromrei of Housingwire writes, “Upfront fees for high balance loans will increase between 0.25% and 0.75%, tiered by loan-to-value ratio. For second home loans, the upfront fees will increase between 1.125% and 3.875%, also tiered by loan-to-value ratio.”

    Mortgage rates are up about a quarter percent in a week. Rates often move on news rather than the actual event. The Federal Reserve released its recent meetings’ minutes outlining the speeding up of the tapering of the $120 billion in bond and mortgage-backed securities purchases. The increasing rates combined with the increasing house prices could slow demand.

    The mix of new loans is changing as rates increase. 2022 is expected to see a 63% reduction in refinance originations but a 9% increase in purchase originations. Combining this with the huge increase in equity American homeowners have tons of equity, see chart below. 2022 could be the year of home equity lines of credit (HELOCs)

    Real Estate News:

    Final Thoughts:

    Elliott Pollack summarized it beautifully when he wrote, “At the beginning of each new year, people look forward with the hopes for a better life. New year’s resolutions are made (and often forgotten), but the new year brings a new outlook for many Americans. Here in Arizona, there is reason for a positive outlook. Our state has been one of the leaders in economic growth and that trend should continue. According to the U.S. Census, Arizona was third in population growth in 2021 behind only Florida and Texas. Based on our review of a number of forecasts, Greater Phoenix employment should grow somewhere between 3.7% and 5.3% in 2022 which could mean at least 80,000 new jobs. The state has also made tremendous progress in diversifying our economy including leading the country in both the semiconductor industry and biosciences.”

    It is good to be in Arizona.

    Copyright 2022 Sarah Perkins

  • Greater Phoenix Real Estate Update 1/7/2022

    “Buy land, they’re not making it anymore.” ~Mark Twain

    On June 19, 2020 I wrote, “Econ 101 taught us about supply and demand. To measure the health of the real estate market we look at new listings AKA supply, and new pendings AKA demand. When demand out paces supply, prices go up. This has been good news for a lot of sellers over the past several weeks. However, we are moving closer and closer to running out of houses to sell.”

    When I wrote that there were 8900 active listings in Greater Phoenix. Yesterday there were fewer than 5300 active listings. That is a 40% decline in 18 months. We haven’t run out yet, but this is the closest we have gotten.

    Despite many real estate experts believing that things will normalize in 2022, the numbers are telling a very different story. Demand continues to outpace supply.

    National Real Estate:

    Inventory: 2022 started with record-low supply. There are only 294,000 available single family homes in the country, which is a 10% drop in the last week and a 33% drop from this year’s peak in early September.

    If demand drops off, we are still at a record low supply. Forbearance will/did not bring any inventory relief. That was a very successful program that kept many people in their homes when they may have otherwise had to sell. There is no foreclosure wave coming and the new builds are being absorbed as quickly as they are being released.

    Typically, inventory grows early in the year. In January and February, 2020 supply started increasing before it started falling and we didn’t see any increase in supply until May 2021. Homes were coming to market and selling immediately so supply could not increase.

    We do not know if supply will hit the normal low in January (essentially now) or if demand will keep things moving until April or May again. Does the hot market entice sellers to take advantage of their equity? Will the assumption of mortgage rates increasing drive owners to sell sooner? The question is, will inventory bottom out at 300,000 in January or decline to 200,000 in April? We will know the answer soon.

    Inventory has been falling for a decade and mortgage rates are low. It has been a really good time to be a homeowner. And with rates this low, many sellers are keeping their previous home as a rental. This is a big reason for the continuously falling inventory levels.

    “Investors accounted for more than 18% of U.S. home purchases, a record. Low interest rates and a persistent shortage of affordable properties have pushed investors to stomach higher prices as they bank on rent growth and price appreciation.”

    -Patrick Clark, Bloomberg

    In an inflationary economy, assets are more valuable than cash due to an assets ability to appreciate while cash depreciates. Inflation of this magnitude hasn’t been seen in 40 years. This implies 2022 will face new lows in available inventory.

    The best way to track the level of demand is with immediate sales. Since June about 25% of new listings sold within the first 24 hours of going active. Two weeks ago, it actually increased to 33%. About 60,000 new listings hit the market two weeks ago and over 18,000 went pending in less than 24 hours. The data is not showing any signals of slowing.

    Experts are still hoping for a calmer, slower 2022 but there are no indications of that at this point.

    • Buyer demand increased in December and was 84% higher than normal pre-pandemic December demand, nationally and locally in Phoenix.
    • A recent headline reads, “Home Inventory Hits All Time Low: Fewer homes were available in November than in any period on record, driving prices 15% higher than last year, Redfin reports”
    • In November inventory was down 13.3% year over year and 9.8% month over month!
    • There were about 15 million refinances closed in 2020 and 2021. Low rates often keep owners in homes.

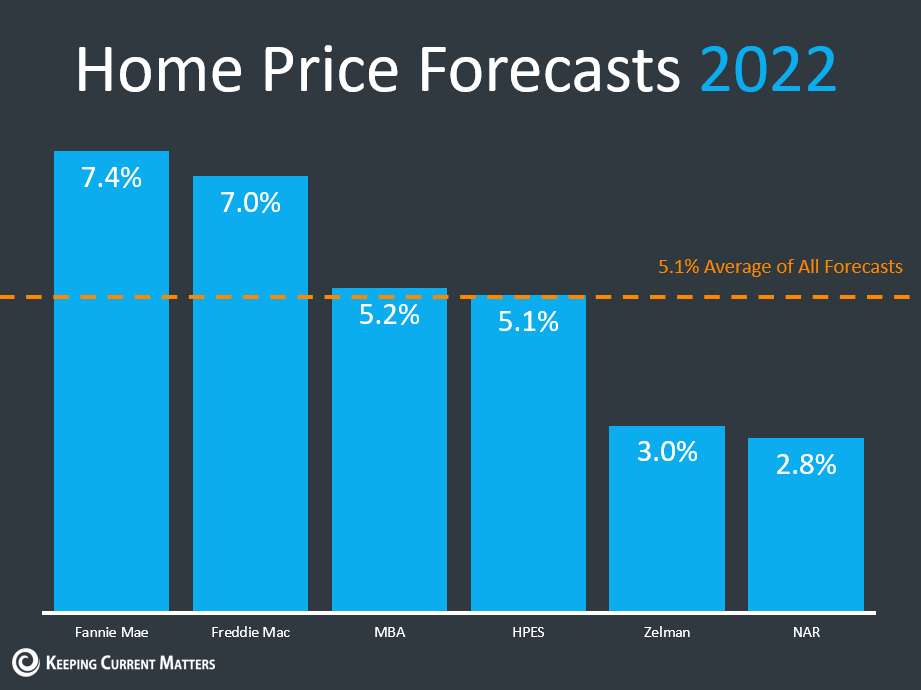
    Yet despite the evidence, forecasted home price appreciation for 2022 is oddly low. I expect these numbers to be revised up:

    The AZ Market:

    Join us next week for a Cromford Market Update with Tina Tamboer. For details and registration, click here.

    The median sales price in December reached $425,000. Resale homes appreciated 28% in 2021 and 297% in ten years.

    New homes appreciated 26% in 2021.

    About 30,000 single family permits were issued in 2021. In 2005 there were about 60,000 issued.

    With the 90,000 new jobs created in 2021 and the 120,000 expected in 2022 further growth is anticipated along with consistent demand.

    New Construction:

    Luxury Real Estate:

    Real Estate News:

    Final Thoughts:

    Greater Phoenix had more resale closings in 2021 than in any other year, beating out 2005. Nationally, it was the biggest selling year since 2006. That happened despite a still raging pandemic, iBuyer sloppiness, political unrest, supply and labor shortages, massive inflation, high (but dropping) unemployment, and virtual learning. That is very impressive and also explains why 2022 will be anything but normal (no matter how desirable that sounds).

    Copyright Sarah Perkins 2022

  • Greater Phoenix Real Estate Update 12/17/2021

    Remember at the beginning of the year we hoped for answers and less political strife? Whether or not those were accomplished remains to be seen but one thing is for sure, 2021 was a year of records. Nationally, median sales prices peaked, for sale inventory bottomed, average days on market bottomed, over-asking price sales peaked, mortgage rates hit all-time lows, and second home demand surged.

    I recently lost all of my previous reviews, will you please help me rebuild by leaving me a review here?

    National Real Estate:

    Yesterday Mike Delprete wrote, “As the Zillow Offers collapse has demonstrated, pricing is a true potential competitive advantage for iBuyers (sellers). Getting it right is a prerequisite for success, while getting it wrong can lead to catastrophic failures.” This applies to all sellers.

    The most recent Swanepoel Trends Report created by real estate consulting and research firm T3 Sixty, author of NAR’s Danger Report (published in 2015 detailing the biggest dangers to the residential real estate industry which have all essentially come to pass), states that in 2021 real estate went into “hyperdrive” and is labeling this year the start of the “Great Acceleration” which could last as long as 10 to 15 years. The growth of available capital has enabled an “increasing concentration of production and market share among the nation’s largest real estate companies.”

    Last week, available single family inventory declined by 7%, this week it declined by another 3%, we are now down to 339,000 actives. On April 30, we hit the 2021 low of 307,000 listings. Inventory may fall below that by the end of the year.

    Experts suspect a cause of the low inventory is due to homeowners keeping their properties to rent out rather than selling when they move. About 16 million or 19% of single family homes are rentals. Of those about 300,000 are owned by institutional investors and 176,000 are owned by the 4 largest corporate investors, Invitation Homes (the largest with 80,000 homes), American Homes 4 Rent, Progress Residential and Cerberus Capital Management.

    Each week for the past 6 months, about 25% of new listings sold within 24 hours of going active. This is a leading indicator of demand, when this number shrinks, we will know demand is declining.

    The AZ Market:

    Inventory is dropping, quickly, again. Inventory is 67% below normal while demand is 23% above normal. The supply-demand imbalance continues, pushing prices ever higher. We may end this year with a 30% year over year appreciation rate. We will have more existing home sales than in 2005! Given that our available inventory levels have been declining for years, we will start 2022 in a robust seller’s market.

    The $750 million redevelopment of Metro Center is expected to start in the second half of 2022. The plan includes 2,600 multi-family units, retail, restaurants, bars, parks, and commercial and entertainment venues.

    The Optima Kierland and Optima Sonoran Village both won the American Architecture Awards, the nation’s most prestigious architecture awards.

    Fed Tapering:

    After reaching an increase of 6.8% in year over year inflation, a 39 year high, inflation concerns have replaced unemployment concerns. The Federal Reserve has opted to, starting in January, increase the speed in which it tapers its bond and MBS purchases. With the new schedule the tapering will be completed by March rather than June. Upon completion, the Fed will be ready to implement its first short term rate hike as early as April. By raising the rates, inflation will cool. (Devil’s advocate, they can’t raise rates too much or the Federal government will not be able to make its debt payments because it be able to afford the interest rates.)

    Industry News:

    NAR’s Home Buyer & Seller Survey:

    Research-based on transactions from mid-2020 to mid-2021

    • 87% of buyers and 90% of sellers worked with a Realtor.
    • Majority of buyers who did not use a Realtor worked directly with builders.
    • 82% of sellers interviewed only one agent.
    • 73% of buyers interviewed only one agent.

    Brian Buffini’s 2022 Bold Predictions with NAR’s Dr. Lawrence Yun:

    Buffini is proud that of the 33 bold predictions he has done (year-end and mid-year), he has gotten it right 31 times.

    This fall we experienced a mini-surge in demand, making this fall the second busiest fall in 15 years, behind 2020. The increased demand is unusual for this time of year.

    2021 in Review:

    • In 2019 Realtors had an average of 9 years of experience. In 2020 that numbers dropped to 8 years, the largest one year decline in history.
    • In 2021 first time home buyers made up 34% of buyers, up from 2020’s 31%.
    • 15% of buyers purchased new homes (it was 29% in 1989).
    • 29% of buyers paid over asking.
    • 90% of homes went under contract within 30 days.
    • Estimates 6 million existing home sales, up 7% from 2020’s 5.7 million sales.
    • NAR’s has roughly 1.5 million members, which means that there were 8 transaction sides for every Realtor.

    2022 Predictions:

    • Expects a very busy spring and summer. The cheaper markets will cool first and luxury will remain strong. Asset purchases, particularly real estate purchases are a great hedge against inflation and those who can (buy), will.
    • 2% decline in existing home sales; to 5,880,000 or 7.8 transaction sides per Realtor.
    • Inventory increases due to new construction completions and the expiration of mortgage forbearance. (I agree with the new home availability, but the mortgage forbearance numbers are too small to make an impact. At the end of October there were 1M borrowers in forbearance and 17% exited still behind on their payments with no loss mitigation plan in place. These exits only add 3,400 listings per state if divided evenly)
    • By December 2022 interest rates will be at 3.7%. The increased rates slow price appreciation.
    • Fewer sales over asking.
    • It will be harder to get business and more market share will go to the highly trained.
    • After two years of record numbers entering the industry and due to the increased difficulty in obtaining business, not everyone will be successful, more agents will fail than will succeed, likely furthering the decline in years of experience.
    • Real estate is no longer for hobbyists, it is for the highly trained, skilled, funded agent who runs the business like a business.

    Real Estate News:

    Final Thoughts:

    As we look to 2022. We are watching the leading indicators, ready to pivot upon market instruction. I remain cautiously optimistic. Remember last year residential real estate pulled us out of the shortest recession in history. This year it broke all of the records. What will real estate do in 2022? I look forward to finding out!

    Have a Merry Christmas and a Happy New Year!

    Copyright 2021 Sarah Perkins

  • Greater Phoenix Real Estate Update 12/10/2021

    When you are asked, “How is the market?” what do you say? Is it a great time to buy? Is it a great time to sell? Is it a great time to be a homeowner? I would say yes to all of those. The data supports the continued growth, continued strength, and continued appreciation – just at a slower rate.

    Despite that housing still faces continuing challenges; low inventory, rising prices, demand – traditional homeowners versus institutional investors, and negative headlines. The economy as a whole faces supply chain and labor shortages, inflation, and another variant. Muted seasonality is emerging, which is not to be confused with a crash, it is simple – and necessary – moderation.

    Ivy Zelman:

    Tom Ruff, with the Information Market, compiled this series of Ivy Zelman quotes from a recent presentation. She is the premier Wall Street housing analyst who has received a lot of industry attention lately due to her reports on future household formation and new construction.

    “The market has started to show some moderation. It’s still extremely strong, and we expect that we’re going to see that reversion to the mean and normalization come to fruition in 2022, barring no large increase in mortgage rates. One of the primary reasons for the looming cool down is the current situation’s ultimate lack of sustainability. In some regions, mortgage payments on a medium-priced home have gone up in double digits because of an ever-increasing percentage of investors and fix-and-flip buyers hoping to tap into rising home prices. The market then becomes oversaturated to an extent where people who own only the home they live in cannot afford to buy at all, finally bringing down demand for all. You have the people who have real jobs and need a place to shelter their families, and you have non-primary buyers. When you’re competing with cash and investors paying above appraised value, at some point, the music stops. Pricing is not elastic, and affordability matters. Too many homeowners are getting too comfortable in the belief that this situation will last forever. Some are hoping to see their property grow by more, while others are simply worried that, even if they sell well, prices have soared so much that they won’t be able to find another home to move into. The problem with such a market is that it does not work when there are no primary buyers. When only investors can afford properties and everyone else holds off on buying, the market ultimately stagnates for everybody. As a result, agents need to convince homeowners who are on the fence about selling their homes to do it quickly. It’s the incremental buyer that you need to worry about. You, as a Realtor, need to convince the existing prospective seller that now is a good time to sell. If your clients thought they could double what they paid, that opportunity is going to start to compress.”

    National Real Estate:

    Zelman’s statements make sense. Demand pulled back slightly in mid-summer and inventory rose. Pending home sales declined, seasonality emerged. The iBuyer frenzy with absurd purchase prices that ultimately took down Zillow Offers was relatively short-lived.

    Yet something doesn’t sit quite right. I can’t seem to put my finger on it either. Why would October have a 7.5% month over month increase in pending sales if sales are moderating? Mortgage applications have hardly declined since the beginning of the year, the trend line shows less than a 1% decline.

    United States MBA Mortgage Applications

    Available inventory has been dropping since 2014. According to a recent Redfin report, inventory has never been lower. It is 42% below December 2019 and 23% lower than December 2020. Available active single family homes declined by 7% week over week. At this rate, we will start 2022 with fewer homes on the market than at any point in 2021.

    Between the consistent demand, low inventory, days on market at half the seasonal average, and increased housing tenure (2008-2021 averaged 10+ years) which further reduces inventory; prices should go up next year, right? In October prices were up 18% year over year, the supply/demand imbalance was extreme earlier this year. While the supply/demand imbalance remains, to a lesser extent, what is causing a forecast of only 2.5%?

    The AZ Market:

    Inventory has been dropping since 2011 which was also the year property values bottomed out after the crash at $110,000. November’s median sales price is $420,000 and is still rising. That is a 282% increase in 10 years.

    As long as the demand remains above supply, there are currently about 4 buyers for each listing, prices will go up. When the mix of buyers is 8% iBuyer, 8% corporate investor, and 18% out of state (YTD) the demand has the potential to shift quickly, leaving Greater Phoenix vulnerable to outside forces.

    In Q3 2021, iBuyers paid $1.47 Billion to Greater Phoenix home sellers. This is the first time iBuyer purchases exceeded $1B in a single market. 12.1% of sellers sold to an iBuyer.

    “Just because Zillow didn’t get it right doesn’t mean Opendoor and Offerpad are not going to get it right. It doesn’t mean disruption is not going to work. It doesn’t mean billions of dollars of venture capital is not going to continue to flow in and subsidize new businesses and try new things and stress your existing model.”

    -Mike DelPrete, iBuyer guru and real estate analyst

    The build to rent movement is popular nationwide, but here in Greater Phoenix it is more than just popular, developers are betting big. With a 96.8% occupancy rate for the existing 5,000 units with an average monthly rate of $1,990; another 6,900 units are under construction.

    Wall Street and private capital continue to flow into our market and as Zelman said above without traditional buyers, the market stagnates. 66% of our buyers are traditional buyers, which is down from 2020’s 91%. This is the trend to watch.

    Final Thoughts:

    The bottom line is if there are available jobs and a growing population, the real estate sector grows. Greater Phoenix has created over 14,000 more jobs than existed in February 2020 and people are moving here to fill those jobs. The headlines are often misleading, but I remain cautiously optimistic.

    Copyright 2021 Sarah Perkins

  • Greater Phoenix Real Estate Update 12/3/2021

    Yesterday I had lunch with three of Greater Phoenix’s premier real estate analysts. As the conversation moved from appreciation rates to price reductions to data quality to seasonality, the question kept coming up, “What do you think will happen in 2022?” It is forecast season after all. Time to reflect on the year that was and plan for the year ahead.

    Before I go further, I am pleased to announce that I recently joined Clear Title. While remaining in the sales arena, I will use my research on the real estate industry to solve specific client challenges. The best way I can support our clients is by understanding their business and the subtle nuances and shifts within the real estate space. Click here for the Phoenix Business Journal announcement. Click here for the Clear Title press release.

    National Real Estate:

    Despite significant headwinds, at over 6.2 million, 2021 is on pace to have the most existing home sales since 2006.

    “Home sales remain resilient, despite low inventory and increasing affordability challenges. Inflationary pressures, such as fast-rising rents and increasing consumer prices, may have some prospective buyers seeking the protection of a fixed, consistent mortgage payment.”

    -Dr. Lawrence Yun, Chief Economist for NAR

    Fannie Mae projects that we will see declining sales volumes over the next two years. If 2021 has the most sales in the past 15 years, then it only makes sense that there would be fewer sales in the next two years. Even still, the 2022 and 2023 projections both call for sales volumes greater than every year from 2007 through 2018.

    The headlines look bad but the actual numbers show continued growth and stability. Fannie Mae, despite the negative headlines, forecasts favorable markets for the next two years. While yes, Fannie Mae does predict a downturn in 2023, a lot can happen in two years, just look at the past two years. No one predicted any of it. That 2023 prediction is based on seasonal trends going back 60 years. While some elements of seasonality have emerged over the past six months, it is muted and unpredictable. Inventory is declining faster than normal and demand, particularly luxury demand, remains strong, which is also unusual for Q4.

    Inventory:

    With inventory declining quickly, we may start 2022 with fewer homes on the market than we had at the beginning of 2021. If inventory stays low, prices will continue increasing. If inventory increases, then prices will rise more slowly. There is a lot of speculation that supply will rise, but the question remains, by how much and when?

    Appreciation & Inflation:

    When we are in a balanced market, homes appreciate at the rate of inflation. Today, that means homes would appreciate at 6.2%. The forecasts that call for appreciation rates under 6% are essentially calling for negative appreciation. In 2022, Realtor.com expects a 3.6% appreciation rate and Forbes expects a 16% appreciation rate. With ranges this wide, how educated are these guesses, I mean forecasts?

    The AZ Market:

    2021 will likely turn out to be Greater Phoenix’s biggest resale year by units, outpacing even 2005.

    In January 2020 all signs pointed to a year with 10-12% appreciation. I was concerned about the lack of sustainability of appreciation rates that high. Little did I know that 2020 would end at 18% appreciation and continue growing. In April we hit 4% month over month appreciation and by June we dropped to only a 1.1% appreciation rate month over month.

    In July and August, when the median sales price stayed flat month over month at $405,000, we thought we would see some real normalization. The median sales price in November was $420,000 giving us an appreciation rate of 28%!! Back to back years with appreciation rates this high is unsustainable and unhealthy for the overall market.

    Tapering:

    The Federal Reserve may speed up its bond and mortgage backed security purchase tapering. The persistently high inflation is not abating meaning that the Fed expects to raise rates sooner than expected. The tapering is currently expected to be complete by June 2022 but the timelines may move up to a March 2022 completion date in order to raise rates as early as April 2022. Some say June was too cautious and others are concerned about demand declines if we have another “tamper tantrum” like in 2013 when sales declined by 10%, appreciation slowed but did not go negative.

    Real Estate News:

    • Several law firms are investigating Zillow for potential securities fraud, which is not uncommon when a company pivots and share prices drop significantly. In only a few weeks Zillow’s market cap has dropped from $21.3 billion to $14 billion.
    • At the end of 2020 NAR had $50M in reserves. By the end of 2021 NAR expects to have $160M in operating reserves and $91M for advocacy reserves. The increase is to help fund the DOJ lawsuits battles.
    • People with a net worth of $5M+ own an average of $1M-$5M in real estate. That is a 180% increase from 2019.
    • Opendoor, Offerpad, Zillow sold 20% of their inventory to investors this year. This week three Senators requested information from Zillow on how many homes the company has sold and plans to sell to Wall Street firms.
    • The elimination of 1031 exchanges was removed from the recently passed infrastructure bill.
    • The conforming loan limits are increasing more than initially expected, at an 18% increase the new limit is $647,200 for conventional financing.

    Final Thoughts:

    As our lunch ended yesterday, we agreed, that with so many different moving parts – many operating outside of typical seasonal trends – it is extremely difficult to comfortably forecast anything past Q1 2022. We agreed that 28% appreciation is unsustainable, and it is unlikely that we will see appreciation at even half that rate next year. After 2020’s 18% appreciation and 2021’s potential 28%+, an appreciation rate of 8% to 10% for 2022 would be welcomed by buyers and would ultimately put us on a better path towards a healthier real estate market.

    Copyright 2021 Sarah Perkins

  • Greater Phoenix Real Estate Update 11/12/2021

    The relationship between supply and demand establishes pricing whether it is for toothpaste, a mani/pedi, Bitcoin, or a house. Demand moves based on consumer sentiment. This is true for Wall Street and Main Street and that is the extent of the similarities between the two.

    Earnings:

    Aside from Zillow’s, many of the Q3 2021 earnings calls were filled with optimism. There were clear winners like eXp and Fathom who both experienced massive growth. There were also companies pleased at losing less than in previous quarters. Redfin’s total revenue was up 128% year over year and its net loss improved from $34.2 million in Q3 2020 to only losing $18.9 million in Q3 2021.

    Redfin’s iBuying revenue was up 1,000%. While Redfin is the country’s fourth largest iBuyer, CEO Glenn Kelman said iBuying is only part of what they do but is not the company’s primary focus. He went on to say that iBuying isn’t going away, despite Zillow’s challenges, nor will it be a huge part of the market, forecasting that iBuying will likely max out at about 10% of the market.

    iBuying is not dead but it is still not profitable. It broke Zillow, who after $1 billion in losses in 3.5 years, expects to lose another $250 million in Q4 2021. Opendoor increased revenue by 91% to $2.3 billion from Q2 to Q3 2021 and decreased its losses from $144 million to $57 million over the same time frame. At $540.3 million, Offerpad’s revenue increased by 185% year over year, but still sustained a net loss of $15.3 million.

    Other winners include 18 publicly traded homebuilders who successfully doubled their market caps since March 2020. Hovnanian Enterprises had the greatest market cap increase at 1,207%. The nation’s largest home builder, D.R. Horton had an increase of 176%. Despite the labor and supply chain shortages, homebuilders are turning substantial profits.

    National Real Estate:

    Demand is increasing, which is seasonally unusual. The rising interest rates and super high rents are possible culprits. Homes continue to sell quickly (in about 42 days on market, up from 21 in May, but well below the normal 70 expected this time of year) and with multiple offers, though declining. Single family year over year appreciation is high but slowing from 22.9% in Q2 2021 to 16% in Q3 2021.

    “Home prices are continuing to move upward, but the rate at which they ascended slowed in the third quarter. I expect more homes to hit the market as early as next year, and that additional inventory, combined with higher mortgage rates, should markedly reduce the speed of price increases.”

    -Dr. Lawrence Yun, NAR’s chief economist

    The AZ Market:

    Buyer demand is increasing, why? Zillow pulled out and yet demand is over 22% above normal. Inventory remains persistently low at 65% below normal. The iBuyer frenzy has settled down. The best thing for our market is to have a lot of owner occupied buyers. 18 months ago, 93% of buyers were owner occupied and in September it was only 74%.

    At 17.4%, Arizona had the highest percentage of homes sold to institutional investors in the country in Q3 2021. AZ was followed by Georgia at 13.9 and Mississippi at 12.8%.

    BeachesMLS in Southeast Florida recently joined MLS Aligned as it gears up to release Aligned Showings, a new showing service. Created in 2018, MLS Aligned is a joint venture founded by ARMLS, Metro MLS in Wisconsin, MLSListings in Silicon Valley, RMLS in Oregon, and UtahRealEstate.com.

    ARMLS policy states that a product vendor cannot also be a member, which means that ShowingTime (owned by Zillow, an ARMLS member) will not be able to extend its contract into 2022.

    Below is ShowingTime’s traffic report for Arizona. The increasing demand is reflected.

    Scottsdale came in at number four for cities that have increased the most by both actual dollars and in percentage growth. In September 2019 the median sales price for a Scottsdale home was $477,000. By August of 2021 it was $715,000. Nearly a 50% increase!

    According to a city analysis from 2020, Phoenix is short 163,067 housing units. Combine that with Phoenix’s average retail space per capita is 40.5 square feet, compared to 28 square feet nationwide, and city officials are creating a plan to convert vacant retail spaces into apartments and condos.

    Real Estate News:

    • For 10 months, from October 2020 to August 2021, Fannie Mae and Freddie Mac applied the adverse market fee to refinances and collected nearly $5.3 billion, covering nearly 70% of the GSE’s Covid relief programs.
    • Pretium Partners has agreed to acquire 2,000 of Zillow’s homes to add to its portfolio of 70,000 single family rentals throughout the country. Zillow still has about 18,000 homes to sell before it can fully shut down its iBuying segment.
    • Created for long term sphere marketing, Navigate by Cryano is a conversation analysis tool that uses communication styles from Gmail and Zoom to develop follow up strategies for Realtors.
    • Opendoor purchased a digital mortgage company, RedDoor, that can provide pre-approvals in one minute.

    Final Thoughts:

    While the residential real estate market changes slowly, it has never before moved this quickly. Change is unnerving but not always bad. Remember, it was housing that pulled us out of the shortest recession in history.

    If the COVID-19 crisis didn’t happen, we would still enjoy the most prolonged economic and job expansion in history. But the pandemic did happen, and we are more vital for having weathered that horrific storm. We now continue this journey together in this new expansion. Economic cycles come and go: My job is to guide you through this process and show you that boring economic models work. They may not be sexy, but they can be precious when you have a good one tested through time. Trust the data and keep moving forward.

    -Logan Mohtashami, Housingwire’s Lead Economist

    Copyright 2021 Sarah Perkins

  • Greater Phoenix Real Estate Update 10/29/2021

    Could it really be possible that we are overbuilding? But what about the extreme undersupply of housing stock? NAR said we have a national deficit of over 5 million units. Economist, Dr. Peter Linneman says have a 2-3 million unit shortage. Wall Street housing analyst, Ivy Zelman says the deficit is less than one million units. These are all credible sources so how do we make sense of this? Perspective is key, different data tells different stories.

    Completed Housing Units:

    Looking at the past five decades of homebuilding it is easy to conclude that building fell way behind in the last 10 years. As long as the population grows at the historic rates, consistent building is necessary to keep up and to replace the roughly one million homes lost each year due to condemnation, natural disaster, or fire.

    Population Growth:

    What if the population growth is not keeping up? According to the 2020 census, over the past 10 years, the US population increased by 22.7 million to 331.4 million. That is a 7.4% increase, lower than the 9.7% increase the previous decade and the lowest growth rate since the 1930s.

    A challenge to a rising population is a declining birth rate. From 2007 to 2019 the birth rate decline was 1-2% a year. In 2020 the birth rate declined by 4%.

    In 1985, 58% of buyers had kids under 18. Today, only 33% of buyers have kids under 18.

    Household Formation:

    A household is one or more people living together (do not have to be related). If two people move into their own places while the third person remains, two households were created. Combining unsustainable home price appreciation and a declining household formation rate, the market will continue to moderate. Affordability matters.

    Household formation is declining quickly, and population growth has stagnated. This will challenge what we know about how we use housing. Household formation has been falling for decades. With this rate of decline, using historic data is not beneficial, rather looking at the most current trends is what is more important. There is no benefit to building homes for a population that has enough homes.

    Why is it declining? Urbanization. Populations are moving away from the country, suburban and urban areas are seeing the most population growth. Over 50% of the country’s counties had population decline over the past 10 years. Urban families tend to have fewer kids, more education, and live at home longer (later to get married and have kids).

    The impact of overbuilding based on household formation will not be seen for many years.

    National Real Estate:

    Existing home sales increased 7% in September month over month, after a 2% decline in August. At this rate, 2021 will likely have the second-highest sales rate in history, behind 2005.

    Appreciation is rapidly slowing. It has slowed from a year over year increase of 23.6% in May, to 23.4% in June, to 17.8% in July, to 14.9% in August, and now 13.3% in September. It is this speedy deceleration that likely caused the iBuyer challenges leading to Zillow’s pause on home purchases through the end of the year. Zillow, and to a lesser extent Opendoor, continued making offers as though the market was appreciating at this springs’ levels. An example is a Fountain Hills property which Zillow purchased for $566,000. Last week the asking price declined from $522,000 to $509,000. For more details on this “catastrophic failure on pricing” check out Mike DelPrete’s recent analysis (I helped him gather data), here.

    There has been a small spike in property re-lists (properties that either canceled or removed to reset days) which is now 1.7% compared to last year’s 1.5%. We usually decline from now through the holidays and then a spike right after the holidays. In 2007 it was like 25% of the market. A climbing relist rate is a sign of a weakening market.

    Goldman Sachs, not known for its residential real estate expertise, projects that housing will appreciate by 16% in 2022, much higher than many projections, and is a definite outlier. At 11%, Zillow’s most recent forecast is the closest to Goldman Sachs. CoreLogic forecasts only a 2.2% jump in U.S. home prices. Freddie Mac and John Burns Real Estate Consulting are forecasting home price growth of 5.3% and 4%, respectively. See chart below from Keeping Current Matters with the forecasts from MBA, Fannie Mae, and NAR. I expect that in 2022 we will have a 6-10% rate of appreciation locally.

    The AZ Market:

    Last week we had Tina Tamboer with the Cromford Report do a deep dive on the Greater Phoenix real estate market. Click here to see my notes from her presentation.

    New Construction:

    The new home market has stabilized and aside from its chronic labor and supply chain struggles is doing well. There is a 5.7 month inventory, at 6.5 months of inventory builders pull back, which is not the case today.

    Over the past 12 months, builders in Greater Phoenix spent over $5 billion for 813 land purchases for new housing.

    Despite single family permits declining in Greater Phoenix month over month in August, they are still up 27% year over year.

    Nationwide there are currently 701,000 multifamily units under construction, the largest amount since July 1974, nearly 50 years ago!

    New home sales increased by 14% in September month over month while remaining 17.6% below September 2020 new home sales. The median sales price reached a new record at $408,800 in September.

    Real Estate News:

    • In New York City, CoStar launched platform that is in direct competition with Zillow’s platform, StreetEasy. StreetEasy currently has no competition and charges agents to post listings. CoStar’s product, CitySnap, does not charge to post. NYC agents are excited. It begs the question, is it too late in the game to create a meaningful competitor for Zillow?
    • The CFPB is hiring 20-30 more enforcement attorneys as it ramps up in enforcement. Under the Obama administration the CFPB had a lot of freedom and fined companies more than $11 billion. Under the Trump administration a lot of its power was reduced and the fines totaled about $1.5 billion. Now, under the Biden administration much of its original power from the Obama administration has been reinstated. The CFPB is tasked with enforcing lending laws and RESPA.
    • Next month at the NAR Conference in San Diego the board will discuss, among other things, a policy that would require public display of buyer broker commissions and Realogy’s request that portals clearly display the listing agent separately from the advertising agent for each property listing.
    • Howard Hughes Corporation purchased the proposed 37,000 acre master planned community, Douglas Ranch, in Buckeye AZ for $600 million. Plans include 100,000 homes; 300,000 residents; and 55 million square feet of commercial property.
    • Goldman Sachs announced it will back a new SFR platform, Entera, which will match investors with finance options and rental properties. Could this investment influence its appreciation forecast?
    • Opendoor will now make real-time offers on Realtor.com’s My Home dashboard.

    Final Thoughts:

    The market is changing quickly and in order to survive and compete in today’s environment, it is important to understand the subtleties of today’s challenges. Also, as Marc King, Keller Williams’ President, suggested, agents must choose whether they want to be a “tech-enabled fiduciary” or an “Uber driver who opens doors.” The choice is yours.

    Copyright 2021 Sarah Perkins

  • Greater Phoenix Real Estate Update 10/22/2021

    Today is all about the AZ market. On Wednesday, Lawyers Title hosted a presentation with Tina Tamboer with the Cromford Report. She always shares pertinent and timely information. Below I have combined a lot of her information from her presentation, along with additional information from my research.

    What Affects Demand?

    • Population Growth
      • Technically every human being is an element of demand for housing, whether as an owner or a renter
    • Relocation (Inbound)
      • Households relocating from outside the metro area bring one excess element of demand without adding to supply
      • Out of state buyers is the biggest source of new population in AZ
      • 18% of buyers are coming from out of state. The biggest feeder cities are San Francisco, LA, and Chicago.
    • Household Formation (Growing)
      • When 1 household splits into 2 (growing), one excess element of demand is created
      • When 2 households merge into 1 (shrinking), one element of demand is removed
      • Work from home movement drove our market during the pandemic and now it is normalizing.
      • With prices going up, household formation is shrinking. It is responding to the affordability issues.
      • This formation rate is an indicator that means the lack of formations will not allow for a lot of price growth, it reduces demand. Do not assume we will have a giant year of appreciation next year.
    • Affordability
      • Employment/Income
        • Increases or decreases in employment and income levels will affect Household Formation and Affordability
      • Appreciation/Depreciation
        • Appreciating home prices decrease affordability and decrease demand
        • Depreciating home prices increase affordability and increase demand
        • Tina thinks affordability will be flat from Q2 to Q3. When affordability is on a free fall, it is not a good time to buy. That is not the case today.
        • Prices went up in Q3 but at a much slower rate than earlier in the year. Appreciation slowed, sped up, and has slowed again. We are up 28.3% year over year. (24%-30% is accurate ballpark for everyone)
      • Interest Rates (Can offset effects of Appreciation/Depreciation)
        • Lower rates increase affordability and increase borrower demand
        • Higher rates decrease affordability and decrease borrower demand
        • Rising interest rates are a concern. With the Fed’s tapering likely to be scheduled in a couple of weeks, the markets will likely respond to the news of scheduled start of the tapering.
        • When a mortgage rate increases from 2.99% to 3.05%, payments increase by $12 a month (for the median house).
        • Loosening up is when lenders go to more desktop approvals (which Fannie and Freddie made permanent for refinances). When lenders hire more people, they are tightening up.
      • Loose/Tight Lending Practices (Can offset effects of Interest Rates)
        • Loose lending practices increase approved borrowers, and increase demand
        • Tight lending practices reduce approved borrowers, and decrease demand
        • Loan limits just increased by the largest dollar amount in history. For details, check out my update from last week, here.

    Affordability declined in Q2 2021 and the US as a whole and Greater Phoenix fell below the ideal affordable range of 60-75 for the first time since late 2018. Through Q2 2021 in Greater Phoenix a household earning the median income ($79,000 annually), can afford 56.4% of what is for sale. A year ago, it was 70%.

    • Consumer Sentiment
      • Emotions, such as euphoria or utter despair, based on speculative opinions or unreliable forecasts can cause some home buyers to make decisions that are not in line with market indicators.

    What Affects Supply?

    • New Homes
      • New construction adds more homes to overall total housing supply
      • Most not counted in supply for sale because most are not listed in the local MLS
    • FSBOs
      • Not counted in supply for sale because they are sold outside of the local MLS
    • Appreciation/Depreciation (Equity)
      • Appreciation creates more equity and allows more homeowners to sell without out-of-pocket costs, adding to supply
      • Depreciation creates less equity and restricts more homeowners from selling without out-of-pocket costs, restricting supply
    • Foreclosures / Household Formation (Shrinking)
      • When 2 households merge into 1 (shrinking), one home is left vacant adding to available supply
      • When 1 household splits into 2 (growing), one excess element of demand consumes an available home, thus reducing supply
    • Relocation (Outbound)
      • When a household leaves the area entirely, one vacant home is added to available supply
    • Divorce/Illness/Death/Job Losses/Tragedy
      • Divorce increases Household Formation and reduces supply
      • Death leaves a vacant residence, thus increases supply
      • Illness, Job Losses and Tragedy can cause Household Formation to shrink due to financial distress, thus increasing supply
    • Consumer Sentiment
      • Emotions, such as euphoria or utter despair, based on speculative opinions or unreliable forecasts can cause some homeowners to make decisions that are not in line with market indicators.

    Rents:

    It is not a great time to rent. It is not reasonable to expect rents to continue increasing as they have. Expect less rental rate appreciation. Rents will likely go flat for a bit and then go back up again. That is normal. They often go flat in Q4. Will they rise in Q1 2022? Probably not too much because of the extreme increases. Median rental price in Q1 2020 was $1,600. In Q3 2021 the median rental price was $2,200. That is a 38% increase!

    Forbearance:

    80% of the forbearance exits have stayed in their homes. With over 3 million borrowers having stayed in their homes after exiting their plan, the forbearance program has been very successful. There are 1.1 million borrowers still in forbearance, if 80% of those stay in their homes which is 880,000 homeowners, then we may see as many as 220,000 new properties come to market, nationwide. That breaks down to 4400 per state. And that would be overtime. There is no flood of listings that will come as borrowers exit forbearance. They will sell and it will not hurt the market. It could be why household formation is shrinking. We have over 10,000 houses sold a month.

    Foreclosures:

    Foreclosure filings are up. There are always foreclosures. Even during normal times there are foreclosures. On average, there are about 40,000 per month nationwide. There is a backlog of foreclosures due to the moratorium so expect increases but when you look at the chart shown, even with the current increase in pre-foreclosures, we are still way below 2019 numbers. In 2019 we never talked about foreclosures having an impact on the market.

    We may see a boost as everything gets caught up. We are still below 1998 foreclosure levels were higher, with fewer houses and fewer people. March 2009 was the peak for pre-foreclosure notices at 10,558. In September 2021 we had 109 filings.

    SFR Permits:

    Single family permits are up 27.6% year over year through August. Permits always scale back in Q4. Nothing to be concerned about. What is happening with all of the permits that were pulled earlier in the year. We should see more houses that are added to supply. We are not seeing any impact of the increased permits turn into actual supply. This is largely due to labor and supply chain challenges slowing the process.

    Non-MLS Sales:

    Non-MLS Sales are at an all-time high. We used to call them FSBOs but now there are more reasons.

    Non-MLS sales often turn into flip sales. Flip activity works the best in a seller’s market. We will be in a seller’s market until at least the middle of next year.

    Ibuyers:

    Affordability declined and the ibuyers went crazy and started paying way over asking. Ibuyers came in super high, creating new risk. They are now trying to sell to the buyers that they just outbid. And those buyers cannot afford the property.

    They are not exiting the market permanently. Zillow came in too hot and is having to do a lot of price reductions. Click here for a great explanation of the iBuyer price struggles in Phoenix.

    Opendoor is scaling back. They did not announce a pullback. They announced that they are still buying after Zillow’s announcement.

    Flip sales are up 76% year over year in August. Opendoor’s flip sales are up 892% year over year in August. Zillow’s flip sales are up 638%. And Offerpad’s flip sales are up 86%.

    The Market Cycle:

    Lots of investors and sellers are at euphoria and buyers are at unease. Homebuilders are concerned about affordability and lenders will be concerned about it too. Appraisers cannot use a comp that is way off. They may throw them out if they are too far off. Often the highest and lowest comps are thrown out.

    Supply:

    Today’s supply movement is not seasonal. We are seeing a shifting market and not a seasonal market. Supply continues to increase and is up 78% since the end of February. Only down 11.2% from last year. In February inventory stopped dropping and started increasing. In May household formations started dropping.

    Demand:

    This is the time of year that buyer demand declines. Best time to be a buyer is in Q4 because supply is rising and less competition. Less ibuyer demand.  Not a lot of seasonal supply for low end, insane market. The $400-800K market has been stable and there are 44.5% more listings under contract than in 2020 and 190% up from 2019. $800-1M supply is low and demand is high. $1M+ starting seasonal demand dip and Q4 rally. Q1 2022 will see more buyers. Comparing year over year demand for the second half of the year will come in negative because of the spike in demand late last year. Currently listings under contract are down 12.5% year over year but we are ahead of 2019 by 13.3%.

    Closed Sales:

    MLS closed sales through September is up 9.2% over 2020. A little less than closed through September 2005. October 2021 is following the activity of October 2020. By the end of the month, we may exceed closings through October 2005.

    Cromford Market Index (CMI):

    The best tool for predicting future price appreciation trends and is available on the main page of the Cromford Report: https://cromfordreport.com/ (without a subscription)

    • 100 is balanced and prices rise at the rate of inflation (currently 5.4%), below 100 is a buyer’s market, above 100 is a seller’s market, prices drop below 90, prices rise at 110. 2014 was a balanced market.
    • On 3/20/2020 we were at 241
    • On 5/15/2020 we were at 145.2
    • Yesterday we were at 349.7
    • We peaked on 3/14/2021 at 514.9
    • Prior to this run, the previous peak was 312.9 in the spring of 2005.
    • CMI is the predictor, it moves first and then appreciation follows. Cannot predict the CMI. It tells us where we are.

    When the CMI weakens we see other weakening follow, like sales prices, appreciation, over asking, etc. We are now averaging a decline of 1.6 points over 30 days. Previously it was dropping much faster over 30 days. It is slowing due to the increased demand, 4.3 points over the past 30 days while supply has only increased by 1.4 points over the same timeframe.

    Ibuyers do not affect supply. Only demand. There is a slight slowdown in demand due to ibuyer pull back.

    Prices are rising. Will continue rising through the end of the year. We will likely not see any prices decline anytime. They will go up at a slower rate.

    Demand below supply = buyer market

    Supply below demand = seller market

    Always trying to come together. Currently, there is an extreme separation between supply and demand.

    Contract ratio:

    Only looks at what is active and what is under contract and nothing else. Contract ratios are very seasonal. Right now we have an extreme seasonal market. Some is seasonal, some isn’t. Despite the decline in contract ratio, the data shows we are still in an extreme seller’s market that is just starting to weaken.

    Final Thoughts:

    The extreme seller market is still in a frenzy. Demand is being driven more by investors than owner-occupants.

    • Annual Appreciation = 25.1% (down from 39%)
    • Sales Over Asking Price = 48.2% (down from 60%)
    • Median Over List = $10,500 (down from $20,000)
    • Average Sale Price per SF = 0.3% over List (down from 1.8%)
    • DOM Prior to Contract = 10 Days (up from 5 Days)
    • Median Sales Price = $415,000 to Date +24% from Last October

    Demand Indicators:

    • Affordability Lower than Normal – projected to measure 56% again for Q3 when released in November
    • Household formation is down over past 3 months, corresponding with affordability indicators
    • 3rd Quarter Sales down from Q3 2020, comparable to Q3 2019
    • Interest Rates Up to 3.05%
    • Lending Practices Loosening with Increased Loan Limits
    • Jobs Good
    • Corporate Profits Good
    • Inbound Relocation Good, Population Rising
    • Incomes (?) – To Come

    Other Observations:

    • Ibuyers = Zillow on pause. Opendoor and Offerpad are scaling back.

  • Greater Phoenix Real Estate Update 10/15/2021

    Change is scary and a balanced market still seems light years away. We got used to operating under extreme pressure due to high demand and low inventory. That market isn’t healthy and it peaked in March. Now, we are, slowly, moving towards a healthier market and it is a good thing.

    The median days on market have more than doubled from 5 days in April to 11 days in October. Sales over asking have declined by 22% but don’t worry, 47% of sales are still closing over asking. These changes are good for the overall health of the market and provide more options for our (slightly less) exhausted buyers.

    National Real Estate:

    • The share of homes listed for $1 million or more has increased from 3.48% in 2020 to 6.61% in 2021, that is a 90% increase. In Greater Phoenix the January to September year over year increase is 106%.
    • According to Zillow’s recent consumer trends report about 65% of home sellers are also buyers, in the first nine months of the year 24% of home sellers received 4 or more offers, 65% of sellers received an offer waiving inspection, while only 16% closed without any inspections.
    • In September, first time homebuyer purchases accounted for 29% of purchases, a two year low. Affordability remains the biggest challenge.
    • According to a recent report from Corelogic, US home prices are up 18.1% in August which is the highest annualized increase since 1977, when the data was first collected. At 32.2% Idaho is the only state with a larger increase than Arizona’s which was 29.5%.
    • Nationwide equity increased by $2.9 trillion since Q2 2020. This translates to an additional $51,500 in equity per borrower over the same time period. Arizona’s borrowers gained $79,000 in equity!

    The AZ Market:

    Join us next week for a Cromford Market Update Zoom meeting. Tina Tamboer will do a deep dive all about Greater Phoenix real estate. For details and registration, click here.

    Greater Phoenix home values have increased by 73% over the past 5 years. From July to August prices were flat at about $400,000. In September the median sales price increased to $405,000 and into October the median sales price is up again to $410,000.

    “When it comes to home prices in this market, what goes up stays up. That’s especially true in the Sun Belt. Home prices are up more than 20% from last year in Austin and Phoenix.”

    -Daryl Fairweather, Redfin’s chief economist

    Why are prices increasing now? This is not the time of year when we normally see building demand and increasing prices. Demand is different today than a year ago. In August of 2020, 91% of buyers were owner occupied buyers. In August of 2021, 75% of buyers were owner occupied buyers.

    The year over year appreciation rate of 25% on sales and the 36% rental increase over the past two years has driven the frenzy from institutional buyers. Rents increased by only 28% in the previous 18 year period. Regular home buyers struggle to compete with corporate deep pockets and many have been displaced from the market.

    Over the past three months, iBuyers acquired 9% of all resale sales and their sales are not keeping up with their purchases. From September 2020 to September 2021, homes purchased by investors to be used as rentals increased by 77%. The investor and iBuyer demand make up about 16% of our current sales. What will happen if and when they stop buying at these levels? Inventory will rise and price appreciation will slow, but not go negative.

    Lending:

    On January 1, 2022 Fannie Mae and Freddie Mac are increasing the conforming loan limit to $625,000 from $548,250. The limit is connected to the national average sales price. In dollars, it is the largest increase ever (data goes back to 1970). By percentage, at 14% it will likely be the second highest increase behind 2006’s 15.9% jump.

    Employment:

    The labor-force participation rate (percentage of workers with a job or actively looking for one) has declined from 63.3% in February 2020 to 61.6% in September 2021, which equates to 3.1 million people.

    By August, Greater Phoenix had fully recovered all of the jobs lost during the pandemic. Arizona has recovered 93% of jobs lost.

    Arizona had a record breaking fiscal year (12 month period ending 6/30/21) in 2021 for statewide economic development. The Arizona Commerce Authority (ACA) worked with companies that committed to creating jobs and investing in communities and not only achieved its goals but blew past them.

    Rentals:

    Over the past 10 years residents of 103 suburbs changed from being primarily homeowners to being primarily renters, which is a 69% increase. Fifty-seven more are expected to shift in the coming five years. 79% of the 4.7 million new residents in the suburbs of the 50 largest cities are renters.

    Quick highlights on the Greater Phoenix area:

    • El Mirage had the fastest growth in the area. From a renter share of 29% in 2010, it grew to 40% in 2019.

    • Sun City, while having the lowest renter share, saw a spectacular jump of 26%. From a 14% renter population, it grew to 18% in 10 years.

    • Scottsdale saw its renter population grow from 26% to 32% by the end of 2019.

    • Avondale grew from 36% to 43%, while Glendale had a similar rise, from 37% to 43%.

    “Today’s suburbia is far different from the Baby Boomer fantasyland it used to be. We have reimagined the American dream for a modern, more diverse society where people are having fewer children and getting married much later in life (if at all), and where most good job/career opportunities require one to be flexible.” 

    -Dr. Kenneth Laundra, associate professional of sociology at Millikin University

    Real Estate News:

    • Earlier this month Zillow moved forward with its acquisition of ShowingTime despite recent FTC warnings that they do so at their own risk.
    • Opendoor revealed a new debt facility agreement in its October 4th SEC filing which will increase the company’s borrowing power to $9 billion.
    • Last year Redfin partnered launched self-led Direct Access tours for vacant listings. Recently Redfin partnered with ADT who will provide 24/7 home monitoring for no additional cost.
    • In addition to offering mortgages, real estate services, closing services, and homeowner’s insurance; Better.com is now adding cash offers to its list of services. Like Rocket, it is building its own full service platform.
    • Homesmart is now offering a revenue sharing model, allowing agents to opt for an 80% split with a cap versus the company’s traditional 100% split.
    • By the end of this year, roughly 20,100 nonresidential units will be converted into residential rental apartments which is double the conversions in 2019 and 2020 combined.
    • Out of 500 organizations, the Greater Economic Council (GPEC) took the top spot at the recent International Economic Development Council annual conference. Criteria for selection is based on business plan execution, job creation, and unique problem solving approaches.

    Final Thoughts:

    Remember real estate changes slowly. Yes, it has never moved so quickly but it doesn’t change overnight, despite what it seems. By understanding the implications of the slight shifts, we can all better council our clients. And while Sean Black, CEO of Knock, believes that within 5 – 10 years buying a house will be like booking a short term rental on Airbnb, a lot has to happen first.

    Copyright 2021 Sarah Perkins

  • Greater Phoenix Real Estate Update 10/1/2021

    Emotions have the ability to cloud our judgment. We are taught to be rational and to only use the facts when making decisions. That sounds good in theory, but when a human is devoid of emotion they cannot make even the simplest of decisions.

    Do you have clients still worrying about when the housing market will crash? The intensity of late 2020 and early 2021 felt like the market frenzy of 2005. As the market normalizes it may feel weird or uncomfortable as we pivot again. While those emotions are important and we have to have emotion to make decisions, we have to look at the facts. And the facts point towards stabilization and continued appreciation, just at a slower rate.

    National Real Estate:

    • Nationwide equity increased by $2.9 trillion since Q2 2020. This translates to an additional $51,500 in equity per borrower over the same time period. Another way to look at it is national negative equity share dropped to 2.3%, the lowest level in 12 years.
    • While the extreme price appreciation has benefitted sellers for nearly a year, it is unsustainable. The decline in the rate of appreciation will be noticeable and will feel uncomfortable, however, it is necessary to rebalance the market. Fannie Mae recently released its forecast for the rest of this year and next. I expect to see a 4% to 8% rate of appreciation, year over year in 2022 and Fannie Mae agrees!
    • According to Fannie Mae’s most recent Home Purchase Sentiment Index survey, those who said that it is a good time to buy increased by 7 points, month over month, the first improvement in four months. Those who said it was a good time to sell declined by 1 point, month over month in August. Consumers are starting to realize the shifting market.
    • Zillow sponsored a recent survey of real estate experts and economists projecting the source of future inventory. The panelists expect to see 40% of listings to come from existing homeowners who are relocating. 23% from home builders. 10% from sellers who plan to rent. And 5% from foreclosed properties. Based on the data above 5% could be a reach.
    • After two consecutive months of declines, in August, pending home sales increased 8.1% month over month.

    “Rising inventory and moderating price conditions are bringing buyers back to the market. Affordability, however, remains challenging as home price gains are roughly three times wage growth.”

    -Dr. Lawrence Yun, NAR’s chief economist

    • After two months of gains, existing home sales declined 2% in August, month over month, dropping the seasonally adjusted annual rate of sales to 5.88 million. In 2020 there were 5.64 million home sales.
    • National rentals rates are at a 16 year high and up 8.5% year over year in July. In Greater Phoenix rental rates are up 18.9%.
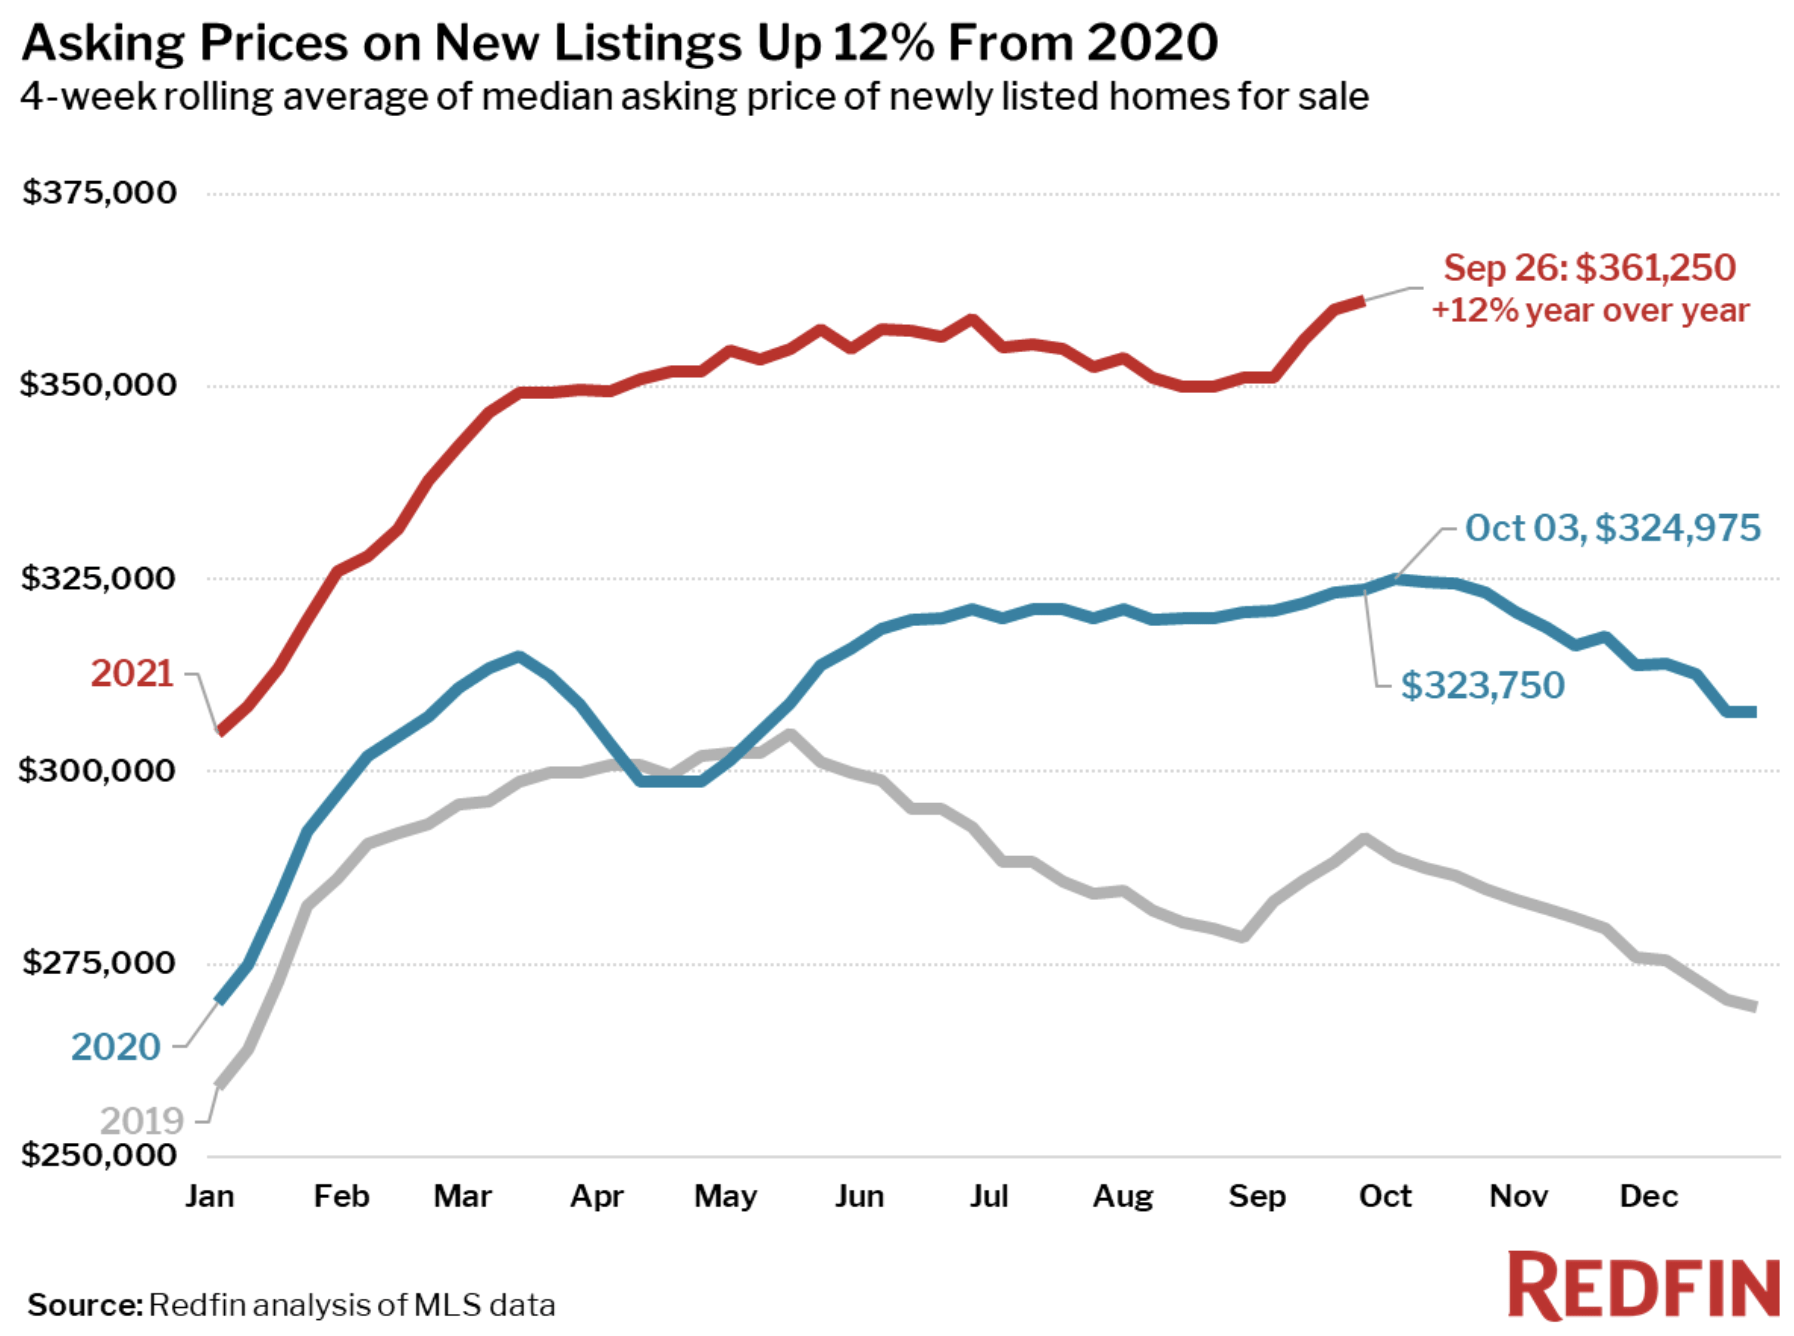
    • The median new listing asking price is up 12% year over year and reached a record high of $361,250 for the four-week period ending September 26. For single family only it is $389,900.

    The AZ Market:

    Demand increased by 11.4% from July 20 to September 30. That is unusual. Demand usually declines in August and September and begins to increase into October as the weather cools. Supply is up 19.6% over the same time period, this is also unusual as inventory tends to decline in the late summer.

    Rents are expected to continue increasing. Greater Phoenix rental occupancy is at its highest rate in over 40 years at 97.1%, the highest since 1978.

    Since 2016 developers have added 36,000 multi-family units, including leased and build-to-rent properties. 2021 will add 11,000 units, the most since 2009’s 9,315.

    Pinal County is growing. In the first half of the year, Coolidge saw a 258% year over year increase in homebuilding permits. In the Town of Maricopa, permits are up 237% year over year.

    New home permits are up 25% year over year in August, meanwhile, permits and closings for new single family homes declined for the second month in a row.

    Nationally, upwards of 10% of new builds are for build to rent. Phoenix is the third-largest build-to-rent market.

    Federal Reserve:

    Mortgage rates are increasing. Higher rates = higher monthly payments = decreased affordability. Additional affordability pressure hurts demand. Rule of thumb: one percentage point = $50,000 of buying power.

    Whether is it persistent inflationary fears, a strengthening economy, or reaching the debt ceiling, the Federal Reserve announced on September 22 that it expects to begin tapering its $120 billion in monthly purchasing of bonds ($80 billion) and mortgage-backed securities ($40 billion) before the end of the year. The tapering will be complete by Q3 2022.

    “Though it may be due to uncertainty arising from brinkmanship on U.S. debt default, I believe it is from the greater recognition of higher inflation. The Federal Reserve has been revising up its inflation forecast and the Fed chairman Powell has changed his narrative to imply as such.”

    -Dr. Lawrence Yun, NAR’s chief economist

    These monthly purchases that started at the onset of the pandemic to stabilize mortgage rates have grown the Federal Reserve’s debt holdings up to nearly $8 trillion. Remember in April 2020 when jumbo loans all but vanished? It was this action that brought stability and extremely low rates to lending.

    The Fed’s hopes to avoid another “Taper Tantrum.” In 2013, when the Fed began tapering its purchases, it only took 8 weeks for interest rates to go from 3.35% on May 2 to 4.46% on June 27 and finally peaking on August 22 at 4.53%. The quick spike in rates caused home sales to decline by 10% and price appreciation slowed but did not go negative.

    The Fed’s next meeting is on November 2 and it is expected that the tapering start date will be selected then and could start as early as November. Markets often respond to news and interest rates have been slowly increasing since the September 22 announcement. Once the start date is established expect interest rates to jump as much as a quarter to half a percent. For more, check out my recent discussion from Monday, here.

    New Construction:

    New home completions were up 4% from July to August. At the same time, single family starts declined for the second month in a row by nearly 3% in August, month over month. New construction will not be the answer to low inventory.

    In August, about 80% of new construction sales were either under construction or yet to be built.

    Despite that single family construction has been increasing since it bottomed out during the Great Recession, home building is running at the slowest pace since 1995. With a housing unit deficit of 3 to 5 million (depending on the on the data source) it will take many years to close the gap.

    Commercial Real Estate:

    Sales prices in all four of the commercial real estate sectors are up year over year. 1.) apartments are 14.7%, 2.) industrial is up 13.6%, 3.) retail is up 12.5%, and 4.) office is up 11.2%.

    Real Estate News:

    • In October 2020 when Opendoor filed it S-4 form with the SEC to go public, it revealed an August 2019 FTC civil investigative demand regarding advertising claims Opendoor made on its website. In its September 15, 2021filing the company warned investors that the deal currently in negotiation may “negatively affect the company’s ability to operate its business” and went on to say, “there are no assurances that we will be successful in negotiating a favorable settlement.”
    • Opendoor partnered with new home search platform, NewHomeSource.com, consumers browsing the site may request a trade-in offer from Opendoor without leaving the search portal.
    • According to Case-Shiller, at 19.7% July had the largest year over year gain since 1987 when Case-Shiller was created. Prices are up 43.7% since the 2006 peak. Phoenix remains the city with the largest year over year appreciation at 32.4% in July.

    Final Thoughts:

    While we still face obstacles, uphill battles, and constant change; remember residential real estate just pulled us out of the shortest recession in history. The strength of the real estate market is what gave it the ability to save the economy. That strength was created by real demand, not loose credit, and seemingly limitless speculation.

    Copyright 2021 Sarah Perkins