Category: Weekly Market Update

  • Greater Phoenix Real Estate Update 3/18/2022

    Brad Inman recently wrote, “Realtor optimism can be necessary for survival” but giddy over-confidence is a bigger problem. He went on to say, “In our industry, the euphoria is characterized by a common sentiment that a real estate market boom can go on forever. It never does.” The newness of a growth market is exciting. Residential real estate has a lot to be proud of; housing demand and low rates pulled us out of the shortest recession in history. Home appreciation made a lot of money for a lot of people and gave options to struggling borrowers. This all happened in the face of some very real headwinds.

    Those headwinds are changing and getting stronger. The excitement is shifting into uncertainty. Sky-high inflation (reaching 7.9% in February with expectations that March will be significantly worse), the Federal Reserve’s short term interest hikes, stock market volatility (SPACs have all but disappeared), mortgage rate spikes, a war that only one person wants, and a pandemic that just entered year three.

    National Real Estate:

    Demand is stable. Do not let the headlines fool you, demand is not crazy high right now, it is stable. It seems that demand is so high because of the extremely low inventory. Remind sellers on the fence that it will not last forever. Demand may further weaken, or inventory could rise; both of which limit the strength of the seller’s market.

    February’s median home-sale price increased 16% year over year, reaching an all-time high of $363,975, according to Redfin. The median asking price is up 15% year over year and up 27% since 2020.

    Available single family inventory increased by 3% this week! This is the first increase in months. There are now nearly 249,000 homes on the market. Available inventory remains 21% lower than this time last year. This is good news for buyers but is too early to be a trend. Typically, it takes three weeks for a trend to emerge. This increase is due to a supply side addition versus a decline in demand.

    23% more new listings hit the market this week versus last week. About 33% sold within 24 hours; the same week over week. If demand were declining, fewer homes would sell immediately.

    Flip investor profit margins reached an 11 year low due to increased holding costs, additional competition from consumers, iBuyers, and institutional investors.

    Second home demand declined quickly to its lowest level since May 2020. While second home demand remains 35% above pre-pandemic levels; in January that demand was 87% above pre-pandemic levels.

    A record, 1 in 12 homes is valued at or over $1 million or roughly 6 million homes.

    US homeowners gained $8.2 trillion in equity over the past 10 years.

    “Owning a home continues to be a proven method for building long-term wealth. Home values generally grow over time, so homeowners begin the wealth-building process as soon as they make a down payment and move to pay down their mortgage.” 

    -Dr. Lawrence Yun, NAR’s chief economist

    Rentals:

    Nationally, in 2021 rents increased by 11%, triple the typical increase in a normal year. In Greater Phoenix rents increased by 30% in 2021, among the highest increases in the country. These increases have caused more than 12 states to re-open rent control policy talks. Wages are not growing quickly enough to keep up with prices. In the past rent control talks have slowed new build projects so this time new builds may be exempt from the rules. Many cities currently have rent control policies in place with annual increases capped anywhere from 3% (St. Paul, MN) to 10% (CA).

    In Greater Phoenix rents are up nearly 80% over the past five years while wages are up on 22% over the same time period.

    The AZ Market:

    In Greater Phoenix, the median sales price in February reached $450,000 – an all time high. That is a 28.5% year over year increase and there are no signs of slowing. The median sales price for properties in escrow, likely to close in the next 45 days is $470,000!

    In February, 64% of the buyers purchased with the intent to live in the property, this is a decline from 2015-2019 when this number was closer to 73%. A huge group of those absentee owned properties are owned by institutional buyers who purchased more than 9,000 homes since the beginning of last year to use as rentals.

    STAT writer, Tom Ruff with the Information Market quotes Michael Orr with the Cromford Report, who explained that single family rentals on the market have increased by 99% year over year. And rents are down to $1.80 per square foot versus $1.93 a year ago. In May 2021, prices reached $2.01 per square foot.

    “These conditions suggest that the era of quickly rising rents in Greater Phoenix may be coming to an end. A large amount of new rental supply is coming on board this year, judging by the number of multi-family permits issued in the last 2 years. Rent looks likely to stay fairly flat, which will change the buy versus rent equation as home prices and mortgage rates continue to increase. In the longer term, this could seriously dampen demand for homes to buy.”

    -Michael Orr, Cromford Report

    Diamond Age, a home construction startup, recently moved its headquarters from CA to AZ, and plans on building 20 homes this year using a combination of 3D printing technology and traditional building processes.

    Federal Reserve:

    Earlier this month, the Fed ended its bond and mortgage backed securities purchases. And has shifted its focus on combating inflation. At this week’s meeting, they raised the short term interest rate by 25 basis points to 0.25% – 0.50%. The Fed expects to increase rates six more times this year and three more times next year. With the seven planned rate hikes, the Fed expects to be back at a 2% rate of inflation after 2024.

    Lending:

    Interest rates are up nearly 1% in eight weeks. While yes, rates are still at historic lows and yes, in 1980 rates increased 3.5% in eight weeks, today’s buyers are not connected to 1980’s buyers (my parents bought their first house in 1980 at 18% interest). However, we can easily connect with the 2018 rate increases that totaled over 1%. Inventory increased some, home price appreciation slowed but stayed positive, and homes took a little longer to sell.

    “The bottom line is that rates were never going to hold at the record lows we have seen, and we need to just accept the fact that they will continue trending higher as we move through the year but are not yet at a level that suggests impending doom for the housing arena.”

    -Matthew Gardner, Windermere’s Chief Economist

    Loan servicers support a permanent forbearance option. It has been a very successful program and the program as it exists today is winding down over the next few months. Of the roughly 8 million borrowers that entered into forbearance, only about 3% or 275,000 remain behind on their payments.

    While yes, cash out refinances did hit a new record in 2021 with a volume of $1.2 trillion, the loan to value ratio declined, meaning the amount owed compared to the house’s value decreased. 60% of 2021’s refinances included cash out and values increased. Despite continued equity gains, due to an increase in rates, cash out refis declined by over 10% in February.

    Real Estate News:

    • Judge rules that Oregon’s real estate love letter ban violates free speech and struck down the proposal.
    • The state of Washington has proposed a bill to make real estate love letters illegal stating that they may violate fair housing laws.
    • Power buyer, Knock.com, has abandoned its plans to go public via SPAC, was nearly acquired in December, recently laid off half of its employees, and is now attempting to hit profitability by the end of the year.
    • Matterport added virtual staging company, Sketchfab, to its platform which also allows agents to take screen shots and use virtually staged Matterport images as photos too.
    • Six former Realtor.com employees are suing Move, operator of Realtor.com, for discrimination, abusive work environment, and being forced to lie to Realtors among other complaints.
    • President Biden signed an executive order urging the Federal Reserve and Treasury Department to study and identify cryptocurrency’s impact on financial stability and national security and establish whether or not the federal government should create its own, regulated, cryptocurrency.

    Final Thoughts:

    And yet we move forward in spite of it all. Human resiliency never ceases to amaze me. Let’s hope that resiliency can help all of those who are suffering through the humanitarian crisis in eastern Europe.

    I regularly quote several of my subscribers. Thank you for your input and contribution to our industry and your support of the AZ market!

    Copyright 2022 Sarah Perkins

  • Greater Phoenix Real Estate Update 3/4/2022

    People are resilient. There is chaos in the world and uncertainty is looming in every corner. This is as true today as it was two years ago. Quite frankly, it has always been true. In January 2020 when Tina Tamboer stood in front of a packed room and told us that we could see a 10% appreciation rate in the coming year, I thought to myself, “Oh no, we can’t handle that, that is way too much, it will be terrible for our market!” 2020 ended with an appreciation rate of 18%. Not only did our market handle it, it did so during a pandemic, civil unrest, and a presidential election. Residential real estate quickly became the solution to the shortest recession in history. Then we handled the 2021 market and now we will figure out how to handle the 2022 market.

    War & Economics:

    In order to slow inflation, which is currently 7.5% year over year, the Federal Reserve is planning to raise rates from 0% to 0.25% during its meeting on March 15-16. Economic sanctions often lead to even greater inflation which could lead to additional rate hikes or larger hikes. Some analysts predict that rates could be increased as much as 0.5% during the upcoming meeting.

    Georgia Kromrei of Housingwire explains, “Economists have said that the conflict in Ukraine could bring a short-term reduction in mortgage rates, as investors flock to safe haven assets like mortgage-backed securities and bonds. But longer term inflation brought on by the conflict will cause mortgage rates to rise.”

    The Fed is also concerned with home price appreciation which is another to say home price inflation. Fed Chairman Powell expects that by raising the rates, home buyer demand will weaken, slowing the rate of growth. This will not cause prices to decline.

    “We won’t get back to pre-pandemic levels. We’re not trying to get prices back down, we’re trying to limit future prices.”

    -Fed Chairman Powell

    Supply & Demand:

    Nationwide, available single family inventory declined by 1.4% last week. There are now fewer than 245,000 homes on the market. That is 25% lower than 2021’s bottom on April 30. And over 66% below January of 2020.

    In 2018 inventory increased as interest rates increased. Rates declined in 2019 and inventory decreased. The expected inventory increase due to increased rates has not yet emerged in the national data. Declines in demand will emerge locally before it does on a national level.

    According to NAR, pending home sales declined by 5.7% month over month in January, continuing a three-month decline in transactions. Of the four major U.S. regions, only the West had an increase in month over month pending sales. All four regions saw a year over year decline. The declines are likely due to lack of homes available for purchase.

    In Greater Phoenix, demand has been declining slowly since early January when demand was 23% above normal. Yesterday’s demand was about 15% above normal. Because inventory is 75% below normal (about 4,000 available single family homes in Greater Phoenix), the decline in demand is nearly unnoticeable. Listings may now only receive 10 offers instead of 20. Despite the decline in demand those remaining buyers still want to buy that property which usually only goes to the highest bidder.

    “The last time the Valley saw a ‘normal’ supply of inventory was in January 2019 when there was a four-month supply. The last time there was a five-month supply was January 2016. From March 2019 to January 2022, we have not hit three months (worth) of inventory. That’s crazy.”

    -Thomas Brophy, Colliers Phoenix housing research director

    One reason given for the tremendous lack of available supply is homeownership tenure. According to Redfin, the typical homeowner is staying their home for 13.2 years, up from 10.1 years in 2012. At 18 years, Los Angeles has the longest median tenure in the country.

    Appreciation Rates:

    In Greater Phoenix, February’s median sales price was $450,000. That is $100,000 more than the median sales price in February 2021 of $350,000! And is nearly a 29% increase year over and year. Wow!

    The Case-Shiller Index released its 2021 report last week showing that US homes appreciated 18.8% last year which is the biggest increase in the 34 year history of the index. 2020’s appreciation rate was 10.4%. Phoenix topped the charts with a 32.5% appreciation rate in 2021. Behind Phoenix, Tampa’s appreciation rate was 29.4% and Miami’s was 27.3%.

    While the Case-Shiller Index is not often used in residential real estate pricing because of its lag time, the data is used by Wall Street, the federal government, and many other businesses. The index calculates price changes monthly by looking at the three month moving averages of single family home sales.

    New Construction:

    Labor and supply chain challenges continue to pressure new home builders. The timelines are difficult to estimate, each week there is something else slowing things down. The latest hold up: garage doors.

    “It used to take us 20 weeks to build a house and now it takes us 20 weeks to get a set of garage doors.”

    -Adrian Foley, Brookfield Properties President & CEO

    These delays have made new home inventory difficult to track. In years past, the number of permits pulled and the number of new home sales was essentially the same. In 2021, there were 31,069 permits pulled (up 7.26% from 2020) and only 24,039 new home sales (down 1.33% from 2020). While these counts exclude single family rental permits, RL Brown Reports is tracking 144 build-to-rent communities in Maricopa, Pinal, and Pima Counties. Thank you, Jim Daniel – President of RL Brown Reports for sharing these numbers with me.

    Both locally and nationally, new home demand is consistent and sales are increasing but not at breakneck speeds. The reason demand feels so strong is because available supply is nearly non-existent.

    Real Estate News:

    • Blackstone, the nation’s largest commercial real estate holder, continues its investment in rentals with its recent $5.8 billion acquisition of Preferred Apartment Communities with about 12,000 rentals units in the southeast United States. Real estate accounted for almost half of Blackstone’s $5.66 billion earnings in 2021.
    • The Property Listing Service (formerly the Pocket Listing Service) has rebranded to the National Listing Service. The company’s federal antitrust lawsuit against NAR and the Clear Cooperation Policy remains ongoing.
    • After Airbnb surpassed its goal set in August of providing 20,000 Afghan refugees with free, temporary housing; the company has set a new goal to help another 20,000 refugees.
    • Last week Fifth Wall, a venture capital firm, withdrew its request for a SPAC with the SEC. Fifth Wall had planned to raise $150 million to take a real estate tech company public. The withdrawal is likely due to the stock market volatility, particularly surrounding proptech stocks.
    • The Host Co. is a digital market place that allows short term rental owners to sell items like furniture, artwork, crafts, and even food. Guests are able to pre-order items or purchase on-site.

    Final Thoughts:

    Today’s uncertainty is different from that of 2020 and 2021. After all that we have been through, I am more optimistic about our ability to adapt. I know we can because we have done it before. And as Logan Mohtashami of Housingwire always says, “Be the detective, not the troll, listen to serious people who don’t need money from clicks.”

    Copyright 2022 Sarah Perkins

  • Greater Phoenix Real Estate Update 2/18/2022

    Today is all about the AZ market. On Wednesday, Clear Title hosted a presentation with Tina Tamboer, with the Cromford Report. She always shares pertinent and timely information. Below I have combined a lot of her information from her presentation, along with additional information from my research.

    To learn more about a Cromford Report membership, click here.

    The AZ Market:

    In order to be successful in real estate you need to know what is actually going on, clear information is the best. Ignore the noise and fear mongering headlines, it is just click bait. The sky is not falling but the market is indeed changing, it is always changing. This is what I wrote about in my update from last week, which can be found here.

    Wages and Demographics:

    The Census Bureau openly admits that the 2020 US Census data is incomplete and of low quality. The Census released experimental estimates for the 1-year data. Between the low quality, lack of data, and experimental estimates; establishing benchmarks, like affordability levels, is difficult. Garbage in, garbage out.

    The US Census stated, “Unfortunately, even with modifications focusing on known sources of bias, the Census Bureau determined that the estimates did not meet our statistical quality standards. These inconsistencies led to the Census Bureau’s decision not to release the standard set of 1-year data products.”

    Without the 1-year data, we cannot estimate population growth or accurate wage information. And without that data, we cannot accurately estimate affordability.

    HUD publishes wage data once a year, from the Census data. The next update will be released in March. To measure affordability in Greater Phoenix we are still using $79,000 as the median household annual income. This number was established by using the 2018 wage data and applying inflation over time (yikes!).

    Based on that amount, affordability is suffering significantly. The ideal affordability range is 60-75, meaning that of the families earning the median income were able to afford 60-75% of the homes sold that quarter.

    Tina doesn’t believe it is this bad, it is unlikely that our affordability level is only at 44.5 like it is on the report. With demand still 18% above normal, Phoenix’s affordability rate is probably closer to the national number at 54.2.

    Rather than using the affordability index as a predictor; we have to closely watch all demand indicators. As soon as the population cannot afford an item, demand drops.

    Buyer Mix:

    All residential property owners are categorized in one of three buckets. 1. Owner occupied, 2. Second home, and 3. Landlord.

    From 2015 to 2019 owner occupied buyers purchased 70-76% of the properties. In 2020 it was 80-83%. In Q2 2021 a new trend emerged, owner occupied purchases began declining and by the end of the December that rate dropped to 64%.

    What changed? It wasn’t the iBuyers, they pulled back on purchases in Q4 2021. It was the massive increase in landlord purchases that pushed that percentage down. We have to watch this number very closely. If owner occupied purchases go down further, then we clearly have a big affordability problem. This matters to everyone. Can the landlord find a renter? Can the ibuyer find a buyer? Ignoring this info today will cost the investors.

    While the intensity of the market feels like the intensity of the bubble. The fundamentals are very different. A market correction will not hurt the consumers like it did in 2008-2011; it will hurt the investors who are asking too much in rent or sales price. Miscalculations destroyed Zillow Offers.

    Mortgage Payments:

    The February 2022 median sales price for a 1,500 to 2,000 square foot home is $435,000. That is a 27.9% year over year increase. Combine the increasing interest rates with the appreciation, payments are now 38% higher than February 2021. With an estimated monthly payment of $2,232 a family needs an income of $95,700 a year to make it affordable. That is up from $91,000 last month, last month’s update notes are here.

    That monthly payment is based on an interest rate of 3.69% which was the rate last week. Yesterday’s, Freddie Mac survey showed a 30 year fixed rate mortgage is now 3.92%. Rates dropped from 2018 through January of 2021 when rates bottomed at 2.65%. In December 2021 rates were 3.12%

    In 2018 they increased by 1%. Mortgage payments jumped, demand declined, inventory grew, and in 2019 rates dropped and houses became more affordable. Based on the market movement in 2018 when rates increased, we have a general idea of what to expect today. 38% year over year monthly payment increases is unsustainable.

    A fixed rate mortgage is one of the best hedges against inflation.

    Rentals:

    Single family rental rates have been flat for the past 5 months. It is very typical to see rents hold steady in the fourth quarter of the year. Any prospective landlords must make sure there is room for rents to grow when investing. The median monthly rent is up to $2,195; up 17.1% year over year and up 34.3% since Q1 2020. Some luxury rentals have declined, February is not outperforming January.

    For apartment, rents are an entirely different beast and they have been increasing significantly as well. For details on apartment rents, evictions, and distressed properties, check out these new charts from the Maricopa County Association of Goverments.

    Now that the median mortgage payment is higher than the median rent, some potential buyers may be on the fence. The advantage of homeownership remains. Real estate ownership is still the greatest wealth creator.

    Where can landlords get the biggest bang for their buck?

    • West side
    • Southeast valley
    • 85254 – the magic zip code

    Median size of rentals is 1,600 square feet. Rentals follow the same law of diminishing returns. Properties over 1,700 square feet have lower price per square foot rentals. Larger homes do not have huge price per square foot prices.

    There is not going to be a decline in rentals until the vacancy rates decline. At 5.6% vacancy rates very low. They haven’t been this low since the early 1980s. An issue during the 2004-2006 bubble was the high vacancy rates; indicating false demand. Today’s low vacancy rates indicate true demand.

    What affects demand?

    • Population growth
    • Relocation (inbound)
    • Household formation (growing)
      • Population doesn’t need to grow for demand to grow if new households are forming. You can increase demand without population growth. Household formation is mostly related to affordability.
    • Affordability (based on the worst census data ever)
      • Employment/income
      • Appreciation/depreciation
      • Interest rates (can offset effects of Appreciation/Depreciation)
        • Because rates are going up demand may decrease, but prices will not decline. There is still too much demand for the supply, prices are still increasing, quickly.
      • Loose/tight lending practices (can offset effects of interest rates)
    • Consumer Sentiment

    Population:

    National population growth is very low, and it is very location dependent. Where is the population moving? (the Census will have an update in March) How much can we draw into Greater Phoenix? Some people talk about over building for the future due to lack of growth. Today’s market is telling us that we do not have enough houses for the people that are here now.

    What will happen to AZ in the future? Job growth. Many people are moving here for jobs. Retirees used to drive the population growth, but now with so many new jobs more and more working age people are moving here. We depend heavily on domestic migration for our population growth.

    From 2020-2021 only six states had a population growth greater than the entire country’s. Those states are Arizona, Utah, Idaho, Montana, Texas, and South Carolina. 16 states saw population declines.

    Unsurprisingly, the areas with the greatest inbound flow are from southern California, Chicago, and Seattle. Check out the interactive map at https://flowsmapper.geo.census.gov/map.html

    What affects supply?

    • New homes
    • FSBOs
    • Appreciation/Depreciation (Equity)
    • Foreclosures/Household Formation (shrinking)
    • Relocation (Outbound)
    • Divorce/Illness/Death/Job Losses/Tragedy
    • Consumer sentiment

    Builders are not going to crash the market, after a decade of insufficient building the undersupply is significant. Until you see vacancies or longer days on market, builders will keep building. Are the builders overbuilding? Permit counts are where they were in the 90s, down 15.7% year over year. New home sales declined 0.5% in 2021 from 2020. We are not currently overbuilding for the demand.

    Even if builders wanted to build like they did in 2005; it won’t happen. There are still far too many challenges with tight labor and supply chain issues. Typical build time is up to 12-14 months. Permits are primarily being pulled for the west valley and Pinal County.

    Arizona has indefinitely tabled a recent controversial bill that would have allowed the state to override city zoning and rules.

    Household formation is growing, which makes supply drop. When household formation slows, supply increases.

    Investor Flips through December 2021:

    The more balanced the market, the fewer flip transactions. Briefly, in 2014, we had a balanced market and was the year with the fewest flips. Today’s market is seeing nearly as many flips as we had in 2012, when investors were selling all of the properties they picked up for $1 in 2011 (the bottom of the market after the crash). iBuyers do not affect supply.

    Zillow lost $880M on its failed iBuyer business. How did they do this in a market with 28% appreciation in 2021? By paying more for properties and it sold them for. Zillow’s median acquisition price was $466,765 and its median sales price was $430,000.

    Opendoor is in the hot seat with a median acquisition amount of $429,500 and a median sales price of $435,000. ibuying is risky and yet Opendoor just launched in the Bay area.

    Offerpad is the most conservative of the three and is not doing as poorly as the others. Offerpad’s median acquisition price of $395,000 is 8.8% higher than its median sales price of $429,900.

    Traditional flips are doing great. The long term average return is 30-40% and right now the average return is about 25%. This is significantly better than the iBuyer returns.

    Short term rentals might be adding some supply, maybe. Cities are enforcing ordinances on short term rentals. PV and Scottsdale are enforcing the most.

    Short term rentals are mostly in the Northeast valley, primarily in Scottsdale, Paradise Valley, and north Phoenix. One reason rents are so high is because short term rentals reduce supply in these areas which makes houses in these areas cost even more. Long term rentals is a place for someone to live so it helps slow price appreciation.

    Short term rental data is tough to track. Despite some available data, analysts believe that the numbers in the chart below are very low. Rather than 210 short term rentals in Paradise Valley, experts believe the number is closer to 380, which is closer to 6% of supply in PV.

    Realtors:

    ARMLS Agent population has grown 19% in the past 5 years. With declining inventory and increasing competition, many agents are expected to leave the business. Keep track of those agents getting out and work with them for referrals, etc.

    New listings:

    • YTD down 3.1% year over year. In 2021 we had a lot of new listings hitting the market.
    • We are at the lowest count for new listings since 2001. Contract activity is higher than 2021.
    • Newly accepted contracts are sky rocketing.
    • There are 3.5% more listings in the MLS than we had this time last year.
    • Listings under contract are down 2.1 from last year but still very high and are expected to keep rising.
    • Closings are still coming in very high. Second highest closing rate since 2000 (behind 2021).

    Cromford Market Index (CMI): 

    The best tool for predicting future price appreciation trends and is available on the main page of the Cromford Report: https://cromfordreport.com/ (without a subscription) 

    • 100 is balanced and prices rise at the rate of inflation (currently 7%), below 100 is a buyer’s market, above 100 is a seller’s market, prices drop below 90, prices rise at 110. 
    • On 3/20/2020 we were at 241 
    • On 5/15/2020 we were at 145.2 
    • Yesterday we were at 471.9
    • We peaked on 3/14/2021 at 514.9 
    • CMI is the predictor, it moves first and then appreciation follows. Cannot predict the CMI. It tells us where we are. 

    The predictor says the annual appreciation rates are going to increase. This is not good for buyers. Prices are not declining.

    Supply stopped dropping so quickly. At 4.1 points in 30 days, demand is now dropping faster than supply which is down 2.4 points in 30 days. We are starting to see a slight softening in the market.

    Prices are not going down. Prices are going up quickly. Currently at a 2% month over month rate. First half of 2021 we saw a 3-5% rate of appreciation. In the second half of the year, we had 1.1% monthly appreciation.

    Cities with the most new home completions have the weakest CMI. Cities with fewest new homes have the highest CMI.

    Median Sales Prices:

    The median sales price is up 50% in 2 years!

    Prices are increasing slightly faster than they were at the end of 2021 but not as quickly as they were in the first half of 2021. Currently prices are increasing at a 1.8% month over month, up from 1.6% just last month. We may see this go up but unlikely to go up to the 4-5% we saw last year. Definitely be faster than 1.1% from last year. Average and median prices are increasing at about the same percentage together.

    2022 will not be like 2021, buyers are exhausted and pulling back slightly.

    What is normal anymore?

    It could be another year before we see demand drop to near normal. Demand dropped in 2018 due to rates. No softening in price anytime soon. The rate of growth is slowing. Supply has to go above demand for prices to drop. It is not worth waiting for prices to go up 20% for a slight possibility of a small drop maybe in the future. The interest rates hikes have slightly decreased demand, slightly.

    Past 21 Years:

    • Buyer’s market – 3.6 years
    • Balanced market – 4.6 years (2001-2003, 2014)
    • Seller’s market – 13 years

    What we are used to is not a balanced market. We are used to a weak seller’s market, like 2015-2019. There were seller concessions and some wiggle room for negotiations.

    Contract Ratio:

    • We are mirroring last year.
    • Phoenix has slight weakening in demand.
    • Pinal County has a lot of demand.

    The demand is many areas is not unusual demand. Pinal and northeast valley cities have high high high demand and crazy low inventory. None of our areas have much supply, way below on where we should be. The highest contract ratio you should see is 105. All cities are currently over 200.

    Closed Sales:

    • We currently have a 22% annual appreciation rate (normal is 4-10%).
    • 46% of homes sold over asking in February.
    • Median over asking $11,000 (up from 10,000 last month)
    • List to sale price ratio is rising. Great to be a buyer in Q4. Normal is 97-98%.
    • Median days on market is currently 7 and will likely drop to 5.
    • Median sales price is $445,000 up 27.1% from February 2021.

    Summary:

    Prices are expected to rise through June, possibly even at a faster rate than last year. Even in a booming market, buying still wins. It’s a hedge against inflation and provides greater opportunity as the value increases.  

  • Greater Phoenix Real Estate Update 2/11/2022

    Sensationalism in the news media hurts consumer sentiment. Consumer sentiment has the greatest impact on the market and the economy as a whole. As much as we value our individualism and our ability to think for ourselves, we are heavily influenced by the decisions and actions of others.

    When consumers see other consumers pull back, they question, “What do they know that I don’t?” Unfortunately, it is not unusual for groups of people to make drastic choices based on nothing.

    This is why it is so important to share accurate and timely information with our home buyers and sellers. Be wary of clickbait and remember, sometimes it is the last sentence in the article that sheds the most amount of light on the topic.

    Yes, there are headwinds. Yes, this year will not be like last year and that is ok. The 2021 housing market was unsustainable. And besides, no two years are ever exactly the same. That would be boring.

    Fannie Mae’s January Housing Survey:

    In March 2021, 53% of Americans thought it was a good time to buy a house. Today 70% said it is a bad time to buy. Consumer sentiment has changed. Prices are higher, rates are higher, there are fewer listings available, and the competition is fierce. The counterintuitive piece is that declining demand will allow inventory to grow and will slow appreciation which will ultimately bring that consumer confidence back up because then the buyers have more options to choose from.

    “Younger consumers — more so than other groups — expect home prices to rise even further, and they also reported a greater sense of macroeconomic pessimism. Additionally, while the younger respondents are typically the most optimistic about their future finances, this month their sense of optimism around their personal financial situation declined. All of this points back to the current lack of affordable housing stock, as younger generations appear to be feeling it particularly acutely and, absent an uptick in supply, may have their homeownership aspirations delayed.”

    -Doug Duncan, Fannie Mae Chief Economist

    National Real Estate:

    “Homebuyers in the last quarter saw little relief as home prices continued to climb, albeit not as fast as earlier in the year. The increasing prices are indicative of a seller’s market, with an abundance of eager buyers and very limited supply.”

    -Dr. Lawrence Yun, NAR Chief Economist
    • Available national single family inventory hit another new all time low, dropping by nearly 6% this week to 256,000. Down 17% below the record low on April 30, 2021. In normal markets, mid-January is the low point of inventory for the year.
    • In 2021 we saw an average of 100,000 new listings each week. So far this year we are seeing about 80,000 new listings a week. Last week 31% of homes sold immediately, within one day. Last year it was about 25% sold in one day.
    • Despite the volatile stock market and rising mortgage rates, demand remains solid, declining some but still at elevated levels. Prior to now, the most recent rate hike took place at the end of 2018. Nationally demand declined and inventory grew by about 6% (not in Greater Phoenix).
    • There may be a pull back on purchases but do not expect an increase in defaults and foreclosures. The typical American mortgaged homeowner has $185,000 in equity.
    • Usually, interest rates increasing deters second home buyers and investors before demand declines for primary homes. According to Redfin, January’s second home demand was 87% higher than pre-pandemic, only September of 2020 was higher at 90%. Primary home demand is up 42% from pre-pandemic numbers.

    The AZ Market:

    Join us on Wednesday, February 16 for our next Cromford Market Update with Tina Tamboer. She will spend an hour doing a deep dive into the Greater Phoenix real estate market. For details and registration, click here.

    Following in the footsteps of Minnesota, California, and Oregon; Arizona’s lawmakers have proposed a bill that allows the state to override local zoning ordinances and enable developers to build higher density and multi-family in areas that previously only allowed for single family homes. NIMBYism (not in my backyard) has long prevented local zoning changes. The entire proposal can be found here.

    In 2021, Greater Phoenix was the most popular city for relocation bringing 85,000 new residents. Dallas came in second with 56,000 new residents and Orlando came in third with 53,000 new residents.

    In ten years, the median sales price increased by about 300%. Today homes under $200,000 are nearly non-existent and in 2011 the majority of our market was under $200,000.

    New Construction:

    I recently had the privilege of attending the AZ Dealmakers event on January 27, 2022. It is an event that includes industry leaders in the residential new construction arena. The presenters included economists, housing analysts, builders, lenders, and more. The conversation was all about the future of new home development in Arizona. My notes and takeaways from the event are here.

    Real Estate News:

    • In 2021, the most popular ‘how to become’ search on Google was for ‘real estate agent’ followed by flight attendant and notary.
    • In 2021, publicly traded residential prop-tech companies lost 65% to 75% of their value including Zillow, Redfin, Compass, eXp, Opendoor, and Offerpad. That is $90 billion in shareholder value gone in a year. This year all eyes will be on these companies to see if they can become profitable.

    Final Thoughts:

    Clickbait headlines like “75% of homebuyers acknowledge some regret over recent home buy” lead to incorrect conclusions. If you read through the full article, it explains that 75% of buyers that purchased in the past two years have at least one regret about their home purchase. It is probably fair to say that most people have one regret about their new house, regardless of when it was purchased, there are always woulda, coulda, and shoulda’s.

    In order to be confident, consumers need reliable information that helps them make choices based on their specific needs. If consumer confidence is waning, remember real estate moves slowly, albeit currently, it is moving faster than ever before, there is plenty of time to plan and pivot accordingly.

    Copyright 2022 Sarah Perkins

  • Greater Phoenix Real Estate Update 2/4/2022

    Inventory is still declining, demand remains consistent, and prices are still increasing. There is no relief in sight. The anticipated January inventory increase never materialized. The expected foreclosure boom didn’t come. The builders are constrained as ever. Mortgage rates are up. Something has to give, but what and when? Our buyers are exhausted and potential sellers don’t know where they will go when they sell.

    National Real Estate:

    Available national single family inventory hit another new all time low this week at 272,000. Down 1.9% from last week and 11.4% below the record low on April 30, 2021. In normal markets, early to mid-January is the low point of inventory for the year. By February, inventory has already started climbing. Inventory hasn’t slowed its weekly decline yet. Like last year, it may not be until the end of April before we start to get a little inventory increase for the year.

    It is too soon to see the impact of the financial corrections on housing. It will take a couple of months to show its impact. Home buying is more driven by life events (married/divorced/babies/empty nest) than it is by financial events. Second homes and vacation rentals are more impacted by the market volatility. This has the potential to create opportunities for first time home buyers.

    First time home buyers gained some ground in 2021, making up 34% of the year’s buyers, up from 32% in 2020. Prior to the market crash in 2008, first time buyers made up 40% of the market. With the largest group of the largest generation aged 28-34, this number is expected to rise. Affordability and lack of available homes will likely dampen growth though.

    Despite expectations, foreclosure filings declined in December making 2021 the all time low for foreclosure filings. The forecasted increase did not materialize and bring additional inventory to market.

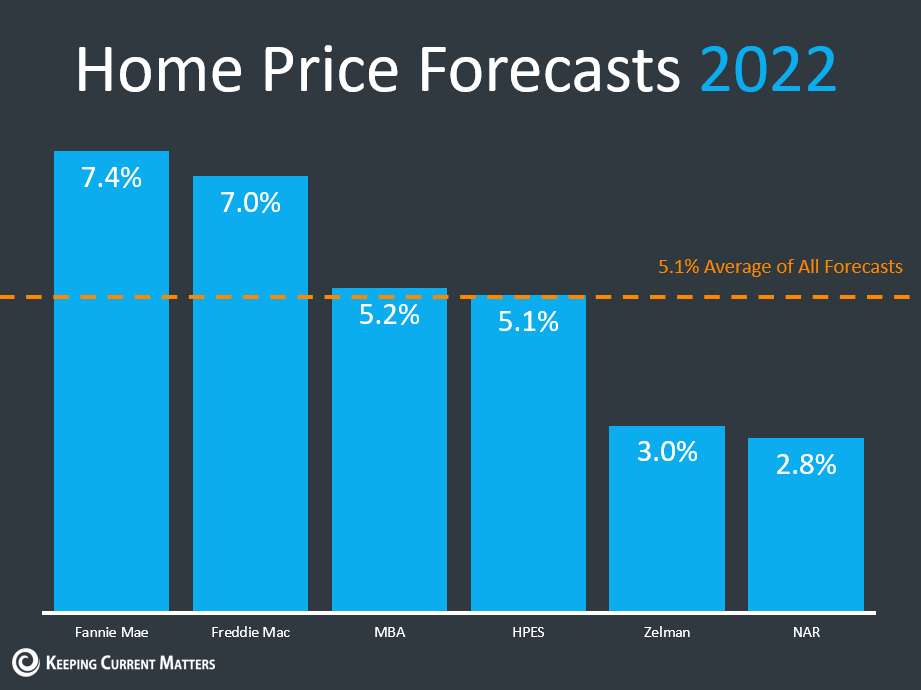
    Fannie Mae expects existing home sales will decline in 2022 by 3.2% due to increased mortgage interest rates creating affordability challenges. Fannie also predicts that 2022 will be the second biggest resale year in the past 15 years only behind 2021.

    Source: Fannie Mae Economic and Housing Outlook, January 2022.

    Prices increased so much nationwide that the value of our housing market grew by $6 trillion in one year!

    The AZ Market:

    Join us on February 16 for our next Cromford Market Update with Tina Tamboer. She will spend an hour doing a deep dive into the Greater Phoenix real estate market. For details and registration, click here.

    To see my notes on our recent deep dive with Tina, please click here.

    According to the Marcus & Millichap annual US Multifamily Index, Phoenix ranks number five in top investment markets due to the job growth and household formation rates.

    Tom Ruff with the Information Market summed up 2021 and the challenges we face in 2022 beautifully. He wrote:

    “What we do know, we begin 2022 with the lowest number of active listings at year’s end on record. And, while we all know the 28% year-over-year increase in the median sales price last year is unsustainable, there is nothing holding back continued price gains in the short term. We know a change is coming, but there are two questions I can’t answer: When will our market moderate? Where will the increase in supply come from? We do know, it isn’t going to moderate tomorrow. New construction and distressed sales will not increase our supply as new construction did in 2004 and 2005, and distressed properties did in 2009, 2010 and 2011.

    It’s time for your year in review records:

    • Highest year-end sales units: 104,850

    • Highest year-end average sales price: $528,940

    • Highest year-end gross dollar sales volume: $51.763 Billion

    • Highest year-end median sales price: $427,000

    • 11 consecutive years with year-end gain in the median sales price

    • The number of new builds sold in Maricopa County declined this year after increasing 6 straight years”

    New Construction:

    Recently I attended an event that discussed the future of land development and building. There were multiple national and local builders who all believe we will see new builds appreciate 10% in the next 6 months. They anticipate increased delivery of backlogged product later this year. Labor is the number one struggle for builders and is why a regular house now often takes over 12 months to complete. Supply chain issues are a close second. Builders expect to see an increase in completions during the second half of the year, but it will be sometime before the low inventory struggles improve.

    Nationally, a record high of 34.1% of homes on the market in December were new construction, up from 25.4% a year ago.

    According to Ivy Zelman of Zelman & Associates, about 70% of mortgage holders are locked into a mortgage interest rate at or below 4%. That is a big disincentive to move as rates incrase. Zelman thinks that the rate increases will hurt the primary buyer but not the investor who is paying cash and buying and holding.

    Before covid each year about 2.3 million renters converted into homeowners. By the end of 2020 and Q1 2021 that number increased to 2.8 million and has since moderated to about 2.4 million. The increased demand we are seeing now is from the investors who were 20-21% of the market and now are 26% of the market. A substantial amount of the surge in prices has been from corporate buyers. Second home buyers have also been a big part of the market and pushing up prices.

    Inventory is coming from the new builds. A ton of product is coming. Backlogged single family inventory is at 2007 levels. The pipeline is massive in the mountain west. Tons of options coming both for build for sale and build for rent.

    Real Estate News:

    • AIG is not renewing 9,000 homeowner insurance policies for high end homes in CA due to future flood and fire risks. Backup insurance is offered with premiums of upwards of $40,000 a year for a $10 million house, or $100,000 a year for a $30 million home. This could have a significant impact on CA home values.
    • With the goal to reduce inflation, the Federal Reserve announced it will begin raising rates on 3/16/22 after it completes the bond and mortgage backed security purchase tapering.
    • In an effort to boost homeownership, a quasi-governmental group in Cincinnati out-bid 12 other investors to purchase nearly 200 homes. The properties will be renovated and sold to local residents.
    • 42% of homeowners with a loan are equity rich, which means their home’s value is at least double the loan amount. The top three states are 1. Idaho, 2. Washington, 3. Arizona.

    Final Thoughts:

    For years, the simple rule of thumb has been if a city has a solid job market and a growing population to handle those jobs then the city would have a healthy real estate market. That seems easy enough. But what happens when you have a growing job market and growing population of over 5 million with ever declining resale options and new homes are taking 12 months to build? I do not know but we will find out soon enough.

    Copyright 2022 Sarah Perkins

  • Greater Phoenix Real Estate Update 1/21/2022

    Today is all about the AZ market. Recently, Clear Title hosted a presentation with Tina Tamboer, with the Cromford Report. She always shares pertinent and timely information. Below I have combined a lot of her information from her presentation, along with additional information from my research.

    The AZ Market:

    In order to be successful in real estate you need to know what is actually going on. Ignore fear mongering headlines. We are all in uncharted territory.

    Typically, the Martin Luther King Jr. holiday weekend is the unofficial start to the spring selling season. While we have seen an increase in properties going under contract this week, it is still too soon to tell what will happen.

    Wages and Demographics:

    In April 2020 the US Census started collecting data. Unfortunately, the data that was collected is incomplete and of low quality. The US Census stated, “Despite our best efforts to mitigate the collection disruptions and modify the weighting adjustments, the outcome could not be fully evaluated until data collection ended. Unfortunately, even with modifications focusing on known sources of bias, the Census Bureau determined that the estimates did not meet our statistical quality standards. These inconsistencies led to the Census Bureau’s decision not to release the standard set of 1-year data products.”

    The Census released experimental estimates for the 1-year data. Between the low quality, lack of data, and experimental estimates; establishing benchmarks, like affordability levels, is difficult. Garbage in, garbage out.

    Without the household income data from the Census we have to use the HUD income data and that is focused on family income which excludes individual person households and multiple, unrelated people households. HUD updates this data every February. Based on the info we do have, which is likely on the low end, the annual median family income in Greater Phoenix is $79,000. This number was established by using the 2018 wage data and applying inflation over time (yikes!).

    Based on that amount, affordability is suffering. The ideal affordability range is 60-75, meaning that of the families earning the median income were able to afford 60-75% of the homes sold over a period of time.

    In Q3 2021, we dropped to an affordability rate of 51%. Lower than the national rate of 56.6%. How inaccurate is the wage data? Are incomes actually keeping up with house prices?

    Rather than using the affordability index as a predictor; we have to closely watch all demand indicators. As soon as the population cannot afford an item, demand drops.

    Buyer Mix:

    All residential property owners are categorized in one of three buckets. 1. Owner occupied, 2. Second home, and 3. Landlord.

    From 2015 to 2019 owner occupied buyers purchased 70-76% of the properties. In Q2 2021 a new trend emerged, owner occupied purchases declined from 67% to 63% through October. That is a big drop in a short time. And overall demand stayed strong and grew in Q4. Will this trend continue, and will this make up for lack of occupied demand? What if occupied demand continues to decline?

    Wall Street funded corporate buy and hold investors remove inventory from the market for the long term. ibuyers add extra demand without removing inventory from the market.

    What will impact the investor buyers? Miscalculations.

    In October, a distressing trend for Zillow became undeniably apparent. Zillow’s median acquisition price was $435,294 while its median sales price was $411,000. In early November, Zillow shut down Zillow Offers completely.

    Through October, Opendoor’s median acquisition and sales prices were about the same. Only Offerpad came out ahead with a median acquisition price of $380,000 and a median sales price of $400,000.

    iBuyers are still buying, albeit more conservatively. They are selling about 20% of their inventory to institutional buyers. If those buyers pull back, the iBuyers selling strategy will be negatively impacted.

    Traditional flip buyers working their program are still making a 30-40% profit. This has been the case since they started tracking the numbers. Good time to be a smart flip investor.

    What could cause a stock market funding pullback? Strong consumer confidence leads to more spending which keeps Wall Street happy. For institutional buyers, when the stock market goes flat their purchases flatten. But if it goes down, sharply down, expect a potential draw back from Wall Street too.

    Corporate profits remain high. When corporate profits are high, luxury real estate does very well. People are making lots of money and are spending it on high end luxury real estate.

    Affordability:

    In December, the median sales price for a starter home was $418,200. The 28% appreciation rate for the year combined with increased interest rates, has added $618 to the monthly payment. A 41% year over year monthly mortgage payment increase is unsustainable, despite lots of wage growth. In order for $2,123 a month to be affordable, annual household income needs to be at least $91,000.

    The median rent increased by over 20% last year and as of Q1 2022 it was $2,265 a month. While the gap between median monthly mortgage payments and monthly rent is shrinking, the benefits of owning still far outweigh those of renting. Equity grows.

    What affects supply?

    • New homes
    • FSBOs
    • Appreciation/Depreciation (Equity)
    • Foreclosures/Household Formation (shrinking)
    • Relocation (Outbound)
    • Divorce/Illness/Death/Job Losses/Tragedy
    • Consumer sentiment

    What affects demand?

    • Population growth
    • Relocation (inbound)
    • Household formation (growing)
    • Affordability (based on the worst census data ever)
      • Employment/income
      • Appreciation/depreciation
      • Interest rates
      • Loose/tight lending
    • Consumer Sentiment

    Population & Migration:

    Population growth remains positive but is slowing. The declining birth rate is a long term red flag. Today’s declining population reduces future demand. Impacts are likely 10+ years out. The solutions are more babies and more immigration.

    From 2020-2021 only six states had a population growth greater than the entire country’s. Those states are Arizona, Utah, Idaho, Montana, Texas, and South Carolina. 16 states saw population declines.

    Unsurprisingly, the areas with the greatest inbound flow are from southern California, Chicago, and Seattle. Check out the interactive map at https://flowsmapper.geo.census.gov/map.html

    U-Haul and United Van Lines both released their migration 2021 reports. According to U-Haul, Arizona is #5 for inbound migration for the second year in a row. According to United Van Lines, Arizona didn’t make the top 10 for inbound or outbound migration.

    47% of the outbound migration are aged 65+ and are moving to be closer to family. Retirement remains the largest portion of inbound migration but the percentage of job relocation is growing.

    Employment:

    Arizona ranks 28th in the country for the unemployment rate. CA is ranked 50th, IL is 40th, and NY is 47th. There is higher unemployment in the states people are leaving. Utah has a 2% unemployment rate, the lowest in the country.

    4.7% is great for us. We had one of the sharpest increases in employment in the country. We are normally slightly higher than the country in unemployment rates. We are now at pre-pandemic levels. AZ recovered our entire labor force last by last February.

    Appreciation:

    The median sales price in December was $430,000, up 28.4% year over year. Median sales price increases reached a year over year high of 38% from January to June and a 3.2% increase month over month for the first half of the year. Then from June to December the monthly appreciation slowed to 1.3% (which is still VERY high).

    January is currently running a 1.7% monthly appreciation rate, slightly higher than the end of last year. While there is no guarantee of anything, at this rate we are looking at a 15% appreciation rate by June.

    Supply:

    In late summer/early fall, we almost had a supply increase but inventory started declining again in October and now we are at all time, record lows for available inventory. The question is: will it go up or down? All we can do is watch the numbers. There are no trends to help us predict, there is no seasonality to use as a baseline. Earlier today there were fewer than 4800 active listings in Greater Phoenix. These levels do not support our population of over 5 million people. The last time we had 20,000 active listings was 2016 and that was a seller’s market.

    Why is it so low? We are not getting enough new listings each week. Over the summer our new listing count grew slightly but then in Q4 new listings dropped off and demand picked up. Demand is expected to continue to rise from now through May.

    Closed Sales:

    • 2021 had the most MLS sales in history, outpacing 2005.
    • 2021 had the highest median sales price of $430,000.
    • 2021 had the lowest foreclosure activity on record.

    Cromford Market Index (CMI): 

    The best tool for predicting future price appreciation trends and is available on the main page of the Cromford Report: https://cromfordreport.com/ (without a subscription) 

    • 100 is balanced and prices rise at the rate of inflation (currently 7%), below 100 is a buyer’s market, above 100 is a seller’s market, prices drop below 90, prices rise at 110. 
    • On 3/20/2020 we were at 241 
    • On 5/15/2020 we were at 145.2 
    • Yesterday we were at 455.8 
    • We peaked on 3/14/2021 at 514.9 
    • CMI is the predictor, it moves first and then appreciation follows. Cannot predict the CMI. It tells us where we are. 

    The current seller’s market is strengthening as demand stays consistent and supply further declines. Prices will be rising for the next 3-6 months. The amount remains to be seen. Expect (hope) the rate of appreciation slows but will continue to increase. As long as demand outpaces supply prices will go up. Currently, supply is 73% below normal while demand is nearly 23% above normal.

    Past 21 Years:

    • Buyer’s market – 3.6 years
    • Balanced market – 4.5 years (2001-2003, 2014)
    • Seller’s market – 13 years

    What we are used to is not a balanced market. We are used to a weak seller’s market, like 2015-2019. There were seller concessions and some wiggle room for negotiations.

    Closed Sales:

    • Prices increased by 28.4% in 2021.
    • In December, 40.5% closed over asking.
    • Median amount over asking: $10,000
    • December’s sale price/list price ratio: 99.9%
    • December days on market: 18 (bottomed out at 5 in the spring)

    Final Thoughts:

    The real estate market in Greater Phoenix is not slowing down. Low inventory and solid demand will push prices up. 2022 is going to be another exciting year.

    Copyright 2022 Sarah Perkins

  • Greater Phoenix Real Estate Update 1/14/2022

    After nearly two years of headlines and non-experts forecasting a crash, a recent headline reads, “Housing costs will be ‘permanently higher’ following pandemic: Study”

    I expect to see more headlines like this and hopefully, they will reduce the, “I’ll wait until prices go back down” comments. Waiting has proven to be incredibly expensive. In 2021 alone, Greater Phoenix saw a 28% appreciation rate, and the entire country increased by about 15%. Emotionally, the 2005 market felt a lot like the 2021 market, but the fundamentals of those markets were entirely different. Simply put the 2005 market was based on tremendous demand while the 2021 market was based on nearly non-existent supply.

    “Given that pandemic housing trends are mostly preexisting trends accelerated, it’s possible home prices and rents would have risen to levels similar to where they are now even without the pandemic. It would have happened more evenly and more slowly. But looking ahead, it’s hard to conclude anything other than housing costs are going to be permanently higher moving forward.”

    -OJO Labs Housing Study

    National Real Estate:

    New listing asking prices are a leading indicator. This week the median new single family listing asking price is $353,900 up 11% from last week’s $319,000. This is a shockingly huge increase. Each January the new listing asking price jump with the spring demand. The speed and amount prices jump changes each year. 2021 had steep inclines in January, steeper than most years past, and this year that spike is even steeper.

    This is a massive spike. We are seeing the same patterns as last year, only sellers are more prepared for it this year and they want to take advantage of the market. This implies big price gains in closings in February and March. The total median asking price of the whole active market is up 1% in the week and is now $369,900. This indicates we are looking at another year of really big price gains.

    Another leading indicator is price increases. 5.6% of the active market has had their prices increase over the past few months. Meaning houses currently listed that were purchased last fall or withdrawn from the market have been relisted and are asking higher prices. Locally this helps understand investor fix and flips and iBuyers. It is an indicator of demand and investors are leaning into that demand. Activity last fall indicated that this spring was going to be a bit more mellow than last year but based on the current trends it looks like we are on track for another spring of intense bidding wars and fast sales which only drive prices higher.

    The AZ Market:

    There is still time to register and join today’s Cromford Market Update with Tina Tamboer at 10am. For details and registration, click here.

    Active inventory in Greater Phoenix remained flat this week with only 5230 listings. Supply remains 72% below normal and demand is 22.5% above normal. Prices are going up. While builders are building as quickly as possible, labor and supply chain delays prevent any meaningful increase in available homes.

    Both nationally and locally iBuyers sold 20% of homes to institutional investors. Based on analysis of about 6500 iBuyer sales in 2021 through November, the companies averaged a purchase price/sales price premium of $15,197. This includes a single property gain of $267,000 as well as a single property loss of $192,612. Thank you, Tom Ruff of the Information Market for sharing your awesome data with me!

    Nationally, apartments are being built at the fastest rate since 1980. Locally, we are expected to build 22,000 units in 2022, the most in the country.

    Greater Phoenix year over year rent growth through November was 25.9% with net absorption at record levels and a 96% occupancy rate in Q4 2021. These are huge numbers.

    “The inbound migration versus outbound is the best in the nation, and it’s attracting both Gen Z and millennials as well as baby boomers.”

    -Doug Ressler, manager of business intelligence at Yardi Matrix.

    Lending:

    Effective April 1, Fannie Mae and Freddie Mac have a new fee for high balance and second home loans. Georgia Kromrei of Housingwire writes, “Upfront fees for high balance loans will increase between 0.25% and 0.75%, tiered by loan-to-value ratio. For second home loans, the upfront fees will increase between 1.125% and 3.875%, also tiered by loan-to-value ratio.”

    Mortgage rates are up about a quarter percent in a week. Rates often move on news rather than the actual event. The Federal Reserve released its recent meetings’ minutes outlining the speeding up of the tapering of the $120 billion in bond and mortgage-backed securities purchases. The increasing rates combined with the increasing house prices could slow demand.

    The mix of new loans is changing as rates increase. 2022 is expected to see a 63% reduction in refinance originations but a 9% increase in purchase originations. Combining this with the huge increase in equity American homeowners have tons of equity, see chart below. 2022 could be the year of home equity lines of credit (HELOCs)

    Real Estate News:

    Final Thoughts:

    Elliott Pollack summarized it beautifully when he wrote, “At the beginning of each new year, people look forward with the hopes for a better life. New year’s resolutions are made (and often forgotten), but the new year brings a new outlook for many Americans. Here in Arizona, there is reason for a positive outlook. Our state has been one of the leaders in economic growth and that trend should continue. According to the U.S. Census, Arizona was third in population growth in 2021 behind only Florida and Texas. Based on our review of a number of forecasts, Greater Phoenix employment should grow somewhere between 3.7% and 5.3% in 2022 which could mean at least 80,000 new jobs. The state has also made tremendous progress in diversifying our economy including leading the country in both the semiconductor industry and biosciences.”

    It is good to be in Arizona.

    Copyright 2022 Sarah Perkins

  • Greater Phoenix Real Estate Update 12/17/2021

    Remember at the beginning of the year we hoped for answers and less political strife? Whether or not those were accomplished remains to be seen but one thing is for sure, 2021 was a year of records. Nationally, median sales prices peaked, for sale inventory bottomed, average days on market bottomed, over-asking price sales peaked, mortgage rates hit all-time lows, and second home demand surged.

    I recently lost all of my previous reviews, will you please help me rebuild by leaving me a review here?

    National Real Estate:

    Yesterday Mike Delprete wrote, “As the Zillow Offers collapse has demonstrated, pricing is a true potential competitive advantage for iBuyers (sellers). Getting it right is a prerequisite for success, while getting it wrong can lead to catastrophic failures.” This applies to all sellers.

    The most recent Swanepoel Trends Report created by real estate consulting and research firm T3 Sixty, author of NAR’s Danger Report (published in 2015 detailing the biggest dangers to the residential real estate industry which have all essentially come to pass), states that in 2021 real estate went into “hyperdrive” and is labeling this year the start of the “Great Acceleration” which could last as long as 10 to 15 years. The growth of available capital has enabled an “increasing concentration of production and market share among the nation’s largest real estate companies.”

    Last week, available single family inventory declined by 7%, this week it declined by another 3%, we are now down to 339,000 actives. On April 30, we hit the 2021 low of 307,000 listings. Inventory may fall below that by the end of the year.

    Experts suspect a cause of the low inventory is due to homeowners keeping their properties to rent out rather than selling when they move. About 16 million or 19% of single family homes are rentals. Of those about 300,000 are owned by institutional investors and 176,000 are owned by the 4 largest corporate investors, Invitation Homes (the largest with 80,000 homes), American Homes 4 Rent, Progress Residential and Cerberus Capital Management.

    Each week for the past 6 months, about 25% of new listings sold within 24 hours of going active. This is a leading indicator of demand, when this number shrinks, we will know demand is declining.

    The AZ Market:

    Inventory is dropping, quickly, again. Inventory is 67% below normal while demand is 23% above normal. The supply-demand imbalance continues, pushing prices ever higher. We may end this year with a 30% year over year appreciation rate. We will have more existing home sales than in 2005! Given that our available inventory levels have been declining for years, we will start 2022 in a robust seller’s market.

    The $750 million redevelopment of Metro Center is expected to start in the second half of 2022. The plan includes 2,600 multi-family units, retail, restaurants, bars, parks, and commercial and entertainment venues.

    The Optima Kierland and Optima Sonoran Village both won the American Architecture Awards, the nation’s most prestigious architecture awards.

    Fed Tapering:

    After reaching an increase of 6.8% in year over year inflation, a 39 year high, inflation concerns have replaced unemployment concerns. The Federal Reserve has opted to, starting in January, increase the speed in which it tapers its bond and MBS purchases. With the new schedule the tapering will be completed by March rather than June. Upon completion, the Fed will be ready to implement its first short term rate hike as early as April. By raising the rates, inflation will cool. (Devil’s advocate, they can’t raise rates too much or the Federal government will not be able to make its debt payments because it be able to afford the interest rates.)

    Industry News:

    NAR’s Home Buyer & Seller Survey:

    Research-based on transactions from mid-2020 to mid-2021

    • 87% of buyers and 90% of sellers worked with a Realtor.
    • Majority of buyers who did not use a Realtor worked directly with builders.
    • 82% of sellers interviewed only one agent.
    • 73% of buyers interviewed only one agent.

    Brian Buffini’s 2022 Bold Predictions with NAR’s Dr. Lawrence Yun:

    Buffini is proud that of the 33 bold predictions he has done (year-end and mid-year), he has gotten it right 31 times.

    This fall we experienced a mini-surge in demand, making this fall the second busiest fall in 15 years, behind 2020. The increased demand is unusual for this time of year.

    2021 in Review:

    • In 2019 Realtors had an average of 9 years of experience. In 2020 that numbers dropped to 8 years, the largest one year decline in history.
    • In 2021 first time home buyers made up 34% of buyers, up from 2020’s 31%.
    • 15% of buyers purchased new homes (it was 29% in 1989).
    • 29% of buyers paid over asking.
    • 90% of homes went under contract within 30 days.
    • Estimates 6 million existing home sales, up 7% from 2020’s 5.7 million sales.
    • NAR’s has roughly 1.5 million members, which means that there were 8 transaction sides for every Realtor.

    2022 Predictions:

    • Expects a very busy spring and summer. The cheaper markets will cool first and luxury will remain strong. Asset purchases, particularly real estate purchases are a great hedge against inflation and those who can (buy), will.
    • 2% decline in existing home sales; to 5,880,000 or 7.8 transaction sides per Realtor.
    • Inventory increases due to new construction completions and the expiration of mortgage forbearance. (I agree with the new home availability, but the mortgage forbearance numbers are too small to make an impact. At the end of October there were 1M borrowers in forbearance and 17% exited still behind on their payments with no loss mitigation plan in place. These exits only add 3,400 listings per state if divided evenly)
    • By December 2022 interest rates will be at 3.7%. The increased rates slow price appreciation.
    • Fewer sales over asking.
    • It will be harder to get business and more market share will go to the highly trained.
    • After two years of record numbers entering the industry and due to the increased difficulty in obtaining business, not everyone will be successful, more agents will fail than will succeed, likely furthering the decline in years of experience.
    • Real estate is no longer for hobbyists, it is for the highly trained, skilled, funded agent who runs the business like a business.

    Real Estate News:

    Final Thoughts:

    As we look to 2022. We are watching the leading indicators, ready to pivot upon market instruction. I remain cautiously optimistic. Remember last year residential real estate pulled us out of the shortest recession in history. This year it broke all of the records. What will real estate do in 2022? I look forward to finding out!

    Have a Merry Christmas and a Happy New Year!

    Copyright 2021 Sarah Perkins

  • Greater Phoenix Real Estate Update 12/10/2021

    When you are asked, “How is the market?” what do you say? Is it a great time to buy? Is it a great time to sell? Is it a great time to be a homeowner? I would say yes to all of those. The data supports the continued growth, continued strength, and continued appreciation – just at a slower rate.

    Despite that housing still faces continuing challenges; low inventory, rising prices, demand – traditional homeowners versus institutional investors, and negative headlines. The economy as a whole faces supply chain and labor shortages, inflation, and another variant. Muted seasonality is emerging, which is not to be confused with a crash, it is simple – and necessary – moderation.

    Ivy Zelman:

    Tom Ruff, with the Information Market, compiled this series of Ivy Zelman quotes from a recent presentation. She is the premier Wall Street housing analyst who has received a lot of industry attention lately due to her reports on future household formation and new construction.

    “The market has started to show some moderation. It’s still extremely strong, and we expect that we’re going to see that reversion to the mean and normalization come to fruition in 2022, barring no large increase in mortgage rates. One of the primary reasons for the looming cool down is the current situation’s ultimate lack of sustainability. In some regions, mortgage payments on a medium-priced home have gone up in double digits because of an ever-increasing percentage of investors and fix-and-flip buyers hoping to tap into rising home prices. The market then becomes oversaturated to an extent where people who own only the home they live in cannot afford to buy at all, finally bringing down demand for all. You have the people who have real jobs and need a place to shelter their families, and you have non-primary buyers. When you’re competing with cash and investors paying above appraised value, at some point, the music stops. Pricing is not elastic, and affordability matters. Too many homeowners are getting too comfortable in the belief that this situation will last forever. Some are hoping to see their property grow by more, while others are simply worried that, even if they sell well, prices have soared so much that they won’t be able to find another home to move into. The problem with such a market is that it does not work when there are no primary buyers. When only investors can afford properties and everyone else holds off on buying, the market ultimately stagnates for everybody. As a result, agents need to convince homeowners who are on the fence about selling their homes to do it quickly. It’s the incremental buyer that you need to worry about. You, as a Realtor, need to convince the existing prospective seller that now is a good time to sell. If your clients thought they could double what they paid, that opportunity is going to start to compress.”

    National Real Estate:

    Zelman’s statements make sense. Demand pulled back slightly in mid-summer and inventory rose. Pending home sales declined, seasonality emerged. The iBuyer frenzy with absurd purchase prices that ultimately took down Zillow Offers was relatively short-lived.

    Yet something doesn’t sit quite right. I can’t seem to put my finger on it either. Why would October have a 7.5% month over month increase in pending sales if sales are moderating? Mortgage applications have hardly declined since the beginning of the year, the trend line shows less than a 1% decline.

    United States MBA Mortgage Applications

    Available inventory has been dropping since 2014. According to a recent Redfin report, inventory has never been lower. It is 42% below December 2019 and 23% lower than December 2020. Available active single family homes declined by 7% week over week. At this rate, we will start 2022 with fewer homes on the market than at any point in 2021.

    Between the consistent demand, low inventory, days on market at half the seasonal average, and increased housing tenure (2008-2021 averaged 10+ years) which further reduces inventory; prices should go up next year, right? In October prices were up 18% year over year, the supply/demand imbalance was extreme earlier this year. While the supply/demand imbalance remains, to a lesser extent, what is causing a forecast of only 2.5%?

    The AZ Market:

    Inventory has been dropping since 2011 which was also the year property values bottomed out after the crash at $110,000. November’s median sales price is $420,000 and is still rising. That is a 282% increase in 10 years.

    As long as the demand remains above supply, there are currently about 4 buyers for each listing, prices will go up. When the mix of buyers is 8% iBuyer, 8% corporate investor, and 18% out of state (YTD) the demand has the potential to shift quickly, leaving Greater Phoenix vulnerable to outside forces.

    In Q3 2021, iBuyers paid $1.47 Billion to Greater Phoenix home sellers. This is the first time iBuyer purchases exceeded $1B in a single market. 12.1% of sellers sold to an iBuyer.

    “Just because Zillow didn’t get it right doesn’t mean Opendoor and Offerpad are not going to get it right. It doesn’t mean disruption is not going to work. It doesn’t mean billions of dollars of venture capital is not going to continue to flow in and subsidize new businesses and try new things and stress your existing model.”

    -Mike DelPrete, iBuyer guru and real estate analyst

    The build to rent movement is popular nationwide, but here in Greater Phoenix it is more than just popular, developers are betting big. With a 96.8% occupancy rate for the existing 5,000 units with an average monthly rate of $1,990; another 6,900 units are under construction.

    Wall Street and private capital continue to flow into our market and as Zelman said above without traditional buyers, the market stagnates. 66% of our buyers are traditional buyers, which is down from 2020’s 91%. This is the trend to watch.

    Final Thoughts:

    The bottom line is if there are available jobs and a growing population, the real estate sector grows. Greater Phoenix has created over 14,000 more jobs than existed in February 2020 and people are moving here to fill those jobs. The headlines are often misleading, but I remain cautiously optimistic.

    Copyright 2021 Sarah Perkins

  • Greater Phoenix Real Estate Update 12/3/2021

    Yesterday I had lunch with three of Greater Phoenix’s premier real estate analysts. As the conversation moved from appreciation rates to price reductions to data quality to seasonality, the question kept coming up, “What do you think will happen in 2022?” It is forecast season after all. Time to reflect on the year that was and plan for the year ahead.

    Before I go further, I am pleased to announce that I recently joined Clear Title. While remaining in the sales arena, I will use my research on the real estate industry to solve specific client challenges. The best way I can support our clients is by understanding their business and the subtle nuances and shifts within the real estate space. Click here for the Phoenix Business Journal announcement. Click here for the Clear Title press release.

    National Real Estate:

    Despite significant headwinds, at over 6.2 million, 2021 is on pace to have the most existing home sales since 2006.

    “Home sales remain resilient, despite low inventory and increasing affordability challenges. Inflationary pressures, such as fast-rising rents and increasing consumer prices, may have some prospective buyers seeking the protection of a fixed, consistent mortgage payment.”

    -Dr. Lawrence Yun, Chief Economist for NAR

    Fannie Mae projects that we will see declining sales volumes over the next two years. If 2021 has the most sales in the past 15 years, then it only makes sense that there would be fewer sales in the next two years. Even still, the 2022 and 2023 projections both call for sales volumes greater than every year from 2007 through 2018.

    The headlines look bad but the actual numbers show continued growth and stability. Fannie Mae, despite the negative headlines, forecasts favorable markets for the next two years. While yes, Fannie Mae does predict a downturn in 2023, a lot can happen in two years, just look at the past two years. No one predicted any of it. That 2023 prediction is based on seasonal trends going back 60 years. While some elements of seasonality have emerged over the past six months, it is muted and unpredictable. Inventory is declining faster than normal and demand, particularly luxury demand, remains strong, which is also unusual for Q4.

    Inventory:

    With inventory declining quickly, we may start 2022 with fewer homes on the market than we had at the beginning of 2021. If inventory stays low, prices will continue increasing. If inventory increases, then prices will rise more slowly. There is a lot of speculation that supply will rise, but the question remains, by how much and when?

    Appreciation & Inflation:

    When we are in a balanced market, homes appreciate at the rate of inflation. Today, that means homes would appreciate at 6.2%. The forecasts that call for appreciation rates under 6% are essentially calling for negative appreciation. In 2022, Realtor.com expects a 3.6% appreciation rate and Forbes expects a 16% appreciation rate. With ranges this wide, how educated are these guesses, I mean forecasts?

    The AZ Market:

    2021 will likely turn out to be Greater Phoenix’s biggest resale year by units, outpacing even 2005.

    In January 2020 all signs pointed to a year with 10-12% appreciation. I was concerned about the lack of sustainability of appreciation rates that high. Little did I know that 2020 would end at 18% appreciation and continue growing. In April we hit 4% month over month appreciation and by June we dropped to only a 1.1% appreciation rate month over month.

    In July and August, when the median sales price stayed flat month over month at $405,000, we thought we would see some real normalization. The median sales price in November was $420,000 giving us an appreciation rate of 28%!! Back to back years with appreciation rates this high is unsustainable and unhealthy for the overall market.

    Tapering:

    The Federal Reserve may speed up its bond and mortgage backed security purchase tapering. The persistently high inflation is not abating meaning that the Fed expects to raise rates sooner than expected. The tapering is currently expected to be complete by June 2022 but the timelines may move up to a March 2022 completion date in order to raise rates as early as April 2022. Some say June was too cautious and others are concerned about demand declines if we have another “tamper tantrum” like in 2013 when sales declined by 10%, appreciation slowed but did not go negative.

    Real Estate News:

    • Several law firms are investigating Zillow for potential securities fraud, which is not uncommon when a company pivots and share prices drop significantly. In only a few weeks Zillow’s market cap has dropped from $21.3 billion to $14 billion.
    • At the end of 2020 NAR had $50M in reserves. By the end of 2021 NAR expects to have $160M in operating reserves and $91M for advocacy reserves. The increase is to help fund the DOJ lawsuits battles.
    • People with a net worth of $5M+ own an average of $1M-$5M in real estate. That is a 180% increase from 2019.
    • Opendoor, Offerpad, Zillow sold 20% of their inventory to investors this year. This week three Senators requested information from Zillow on how many homes the company has sold and plans to sell to Wall Street firms.
    • The elimination of 1031 exchanges was removed from the recently passed infrastructure bill.
    • The conforming loan limits are increasing more than initially expected, at an 18% increase the new limit is $647,200 for conventional financing.

    Final Thoughts:

    As our lunch ended yesterday, we agreed, that with so many different moving parts – many operating outside of typical seasonal trends – it is extremely difficult to comfortably forecast anything past Q1 2022. We agreed that 28% appreciation is unsustainable, and it is unlikely that we will see appreciation at even half that rate next year. After 2020’s 18% appreciation and 2021’s potential 28%+, an appreciation rate of 8% to 10% for 2022 would be welcomed by buyers and would ultimately put us on a better path towards a healthier real estate market.

    Copyright 2021 Sarah Perkins