Category: AZ Real Estate

  • Greater Phoenix Real Estate Update 5/21/2021

    Residential real estate continues moving at breakneck speeds. In April, nearly 75% of offers written by Redfin agents were for listings with multiple offers, nationwide. In greater Phoenix, it was 80.5%. Last week Tina Tamboer with the Cromford Report told us that 57.1% of homes that closed in greater Phoenix in April, closed over asking. These exciting times of economic growth and massive home-price appreciation are being dampened by fear, not just of a bubble – which we are not in – but also by the threat of inflation. One of the ways the government is able to slow inflation is by increasing rates (not mortgage), which then usually puts pressure on mortgage rates which would increase affordability challenges thus weakening homebuyer demand.

    Inflation:

    Consumer price inflation increased by 0.8% from March to April, the largest increase since June 2009. It increased by 4.2% year over year, the highest since September of 2008. Core inflation is up 3% year over year. Experts blame supply chain challenges and last spring’s weak readings and believe this inflation is short-term and will settle down in the coming months. Housing has taken on the largest rate of inflation at 18% (nationally) year over year. Consumers call it appreciation and economists call it inflation.
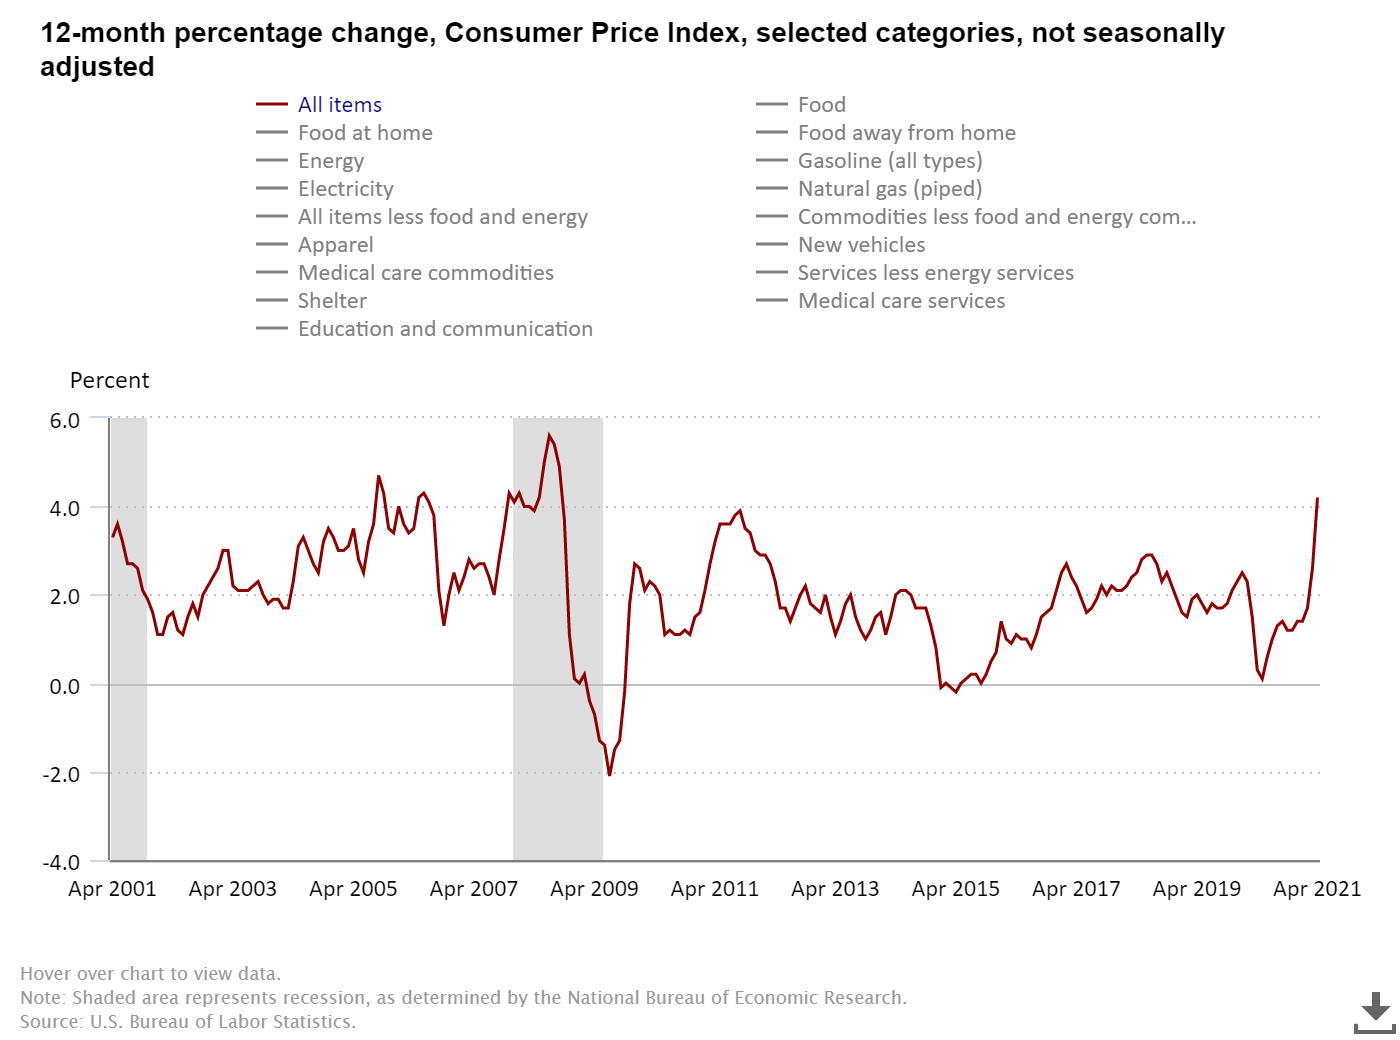
    In late April the Federal Reserve stated again that it intends to keep short-term interest rates at nearly 0% until we reach full employment (roughly 5%) and inflation is slightly above 2% “for some time.” It will also continue buying $80 billion in Treasury securities and $40 billion in mortgage backed securities monthly until those benchmarks are reached.

    Employment:

    American workers are more productive than they were pre-pandemic. Federal Reserve Governor Christopher Waller said, “It fits with what we have been hearing from businesses about labor supply shortages. GDP is back to its pre-pandemic level, but we have recovered only 14 million of the 22 million jobs lost last spring.”

    With nearly 8 million job openings nationwide and many employers struggling to find workers, 22 GOP led states, including Arizona, opted to end the additional $300 in weekly pandemic unemployment benefits early. In Arizona, those benefits will expire on July 10 rather than in early September. There are just over 6.6 million people receiving Pandemic Unemployment Assistance nationwide.

    Despite the dismal April jobs report, the weekly jobs report released yesterday shows that 444,000 people filed for initial unemployment benefits, down 7% from the previous week and hitting an all-time low since March 14, 2020, when it was 256,000. In Arizona, we had a 27% decline in initial unemployment claims. Continued unemployment claims, known as insured unemployment, increased by 0.1% week over week to 3,751,000. In Arizona, that number declined by 4% to 52,836.

    While the unemployment numbers remain high, experts predict Arizona will add 116,900 jobs by the end of 2021, which would put us ahead of our pre-pandemic numbers, according to the Economic Club of Phoenix, a unit of the WP Carey School of Business at ASU. In April of 2020, Arizona lost 331,000 jobs.

    Source: US Department of Labor

    National Real Estate:

    Single-family housing starts in April declined 13.4% from March, putting us at an annual rate of 1.09 million single-family starts. Builders blame supply chain and labor shortages for the decline.

    As people are out and about more, the personal savings rates will decline. Dr. Lawrence Yun, Chief Economist for NAR, expects “revenge spending” on more services and entertainment in the coming months which will slow some of the frenzy we have been experiencing. He also expects that bidding wars will not be common by 2022.

    Single-family inventory increased again this week by 1% to 313,577. Experts predict inventory to gradually increase by about 1% a week over the next few weeks. There are no signs of distressed listings coming to market. This gives our exhausted buyers more flexibility and room for negotiation. As you can see below, we have only had 3 weeks of inventory increases in the past year.

    71% of new listings went under contract in less than a week, a slight decrease from last week’s 73%. Expect strong demand through June.

    Home sales prices were flat this week at $395,000 and new listing asking price dropped from $365,000 to $360,000. For the past month, new listing asking prices have stayed flat so prices are no longer skyrocketing, on a national level. Normally the asking prices top out in May, last year it did in July. The new listings prices lead the market by about a month. Then closed listings followed by a month and then the headlines follow by another month.

    The AZ Market:

    From July 2019 through July 2020, Phoenix ranked #1 in net migration. We had 89,000 people move here or 244 per day. In 2020 alone Phoenix grew by 106,008 people, ahead of the 10-year average of 85,562 people a year.

    According to the Information Market, in Maricopa County, new home sales are up year to date by 8.6% and resales are up 22.3%. In April, the median sales price for new homes was up 24.6% year over year. For resales, it is up 32!!

    For more in depth information specific to greater Phoenix, see my update from last week, here.

    Lending:

    It is no surprise that mortgage demand declined in April from March but remain significantly above last year’s totals. Demand has been slowly declining since March. The continued low inventory combined with affordability pressures is still to blame. Experts predict there will be a modest rise in rates this year, which will likely further impact demand as well.

    1031 Exchanges & Proposed Policy:

    President Biden’s proposed American Families Plan does not completely eliminate 1031 exchanges but it does cap the amount allowed in the exchange. The plan allows for up to $500,000 in capital gains deferral.

    A study from the University of Florida shows that the average size of a 1031 exchange transaction from 2010 to 2020 was $500,000; which is far smaller than institutional commercial real estate transactions. Walker & Dunlop’s average transaction amount is $49 million and they do not use 1031 exchanges.

    Real Estate News:

    • Fannie Mae recently revised down the expected existing home sales counts due to rising mortgage rates and potential inflation. The article states, “Homes will sell at an annual pace of 5.88 million during April, May and June. That’s down from the previous forecast for second quarter sales to come in at 6.16 million, annualized.”
    • National mortgage delinquency rate improved in April as 400,000 borrowers became current on their loans. The delinquency rate declined to 4.66%, a 7.08% decline from March’s rate.
    • On Wednesday, Zillow launched an in-app calling feature which allows potential buyers to call an agent directly without ever leaving the app. The Realtor has 30 seconds to answer before the call is then routed to another Premier Agent.
    • Two of the country’s largest single-family rental REITs upped their rates on vacant home in April by a lot. American Homes 4 Rent increased 11% and Invitation Homes increased by 10%.
    • Popular CRM, Liondesk announced last week that it is being acquired by Lone Wolf Technologies. As the system integrates with Lone Wolf, users may see some changes.

    Cryptocurrency:

    Yesterday, the IRS announced that “businesses that receive crypto assets with fair market value of more than $10,000” must be reported. This is part of President Biden’s proposed American Families Plan. The announcement comes on the heels of Bitcoin’s peak earlier this week at nearly $65,000 and then an immediate decline to just below $40,000 after a similar announcement that China is planning its own cryptocurrency regulations.

    Final Thoughts:

    While yes, the inflation numbers are more intimidating than we would like, these are short-term numbers and are expected to fall and normalize over time to a more balanced level.

    Demand is declining some but remains stable. Inventory is rising but is coming from such a small number it needs to rise for some time before it becomes a concern.

    For those who remain afraid of a bubble, I quote one of my favorite housing economists, Logan Mohtashami of HousingWire, “Home prices, on the other hand, are rising too fast. When you have the best housing demographics ever recorded in U.S. history in the years 2020-2024 and the lowest mortgage rates ever recorded in history, then the notion that housing demand will collapse is, in a word, ridiculous. Along with stable demand, the financial balance sheets of our current homeowners are solid. But hey, in America, trash sells, no matter how unbelievable.”

    Copyright 2021 Sarah Perkins

  • AZ Forbearance Update 5/19/2021

    In this 17 minute video, Lydia Wietsma and I discuss the latest in forbearance, delinquencies, employment, and loan servicing.

    Forbearance Numbers:

    We had another week of improvement in the forbearance numbers. There are now only 2.1 million borrowers or 4.22% of mortgages are in a forbearance plan. This is down from last week’s 4.36%.

    Forbearance by Stage:

    • 11.9% of borrowers are in the initial stage of forbearance and new requests dropped down to their lowest level since March of 2020.
    • 83% of borrowers are on extension, up from previous weeks. Over 50% of borrowers on extension have been in forbearance for over 12 months.
    • 5.1% of borrowers are re-entries, also up from previous weeks.

    Forbearance Exits from June 1, 2020 through May 9, 2021:

    46.5% of borrowers continued making their payments, got caught up upon exit, or paid off the loan with a refinance or sale upon exit. This number has declined slightly in recent weeks.

    15% of borrowers exited their plan, still behind on their payments and without a loss mitigation plan in place. It is critical for struggling borrowers who are nearing the end of their forbearance plan to call their lender or loan servicer to discuss the options. There are options.

    Delinquencies:

    Remember in December when there were roughly 10 million Americans behind on either rent or mortgage payments? By March that number dropped to 5 million!

    Single Family Rentals:

    Two of the country’s largest single-family rental REITs upped their rates on vacant homes in April by a lot. American Homes 4 Rent increased 11% and Invitation Homes increased by 10%.

    Housing Shortage:

    From 1959 to 2006 builders built an average of just over 1.1M single-family homes a year. From 2007 to 2020 they built an average of just over 700,000 homes a year. This has created a 5.5M home shortfall nationwide. In 2020; 990,500 homes were started, still below the average prior to 2006. Based on this math, if builders build 2M houses a year, it will take 6 years to make up for the shortfall.

    Another way to look at it for all residential building:

    Employment:

    • ASU’s WP Carey School of Business predicts that Arizona will add nearly 117,000 jobs this year putting us ahead of our pre-pandemic numbers; a significant feat considering in April of 2020 Arizona lost over 331,000 jobs.
    • Today we have roughly 7,367,000 job openings, which is about 5.5 million more than we had at the lowest point of the great recession.

    April’s employment numbers were so disappointing that the U.S Chamber of Commerce, the nation’s largest lobbying group, urged Congress to end the $300-a-week federal unemployment benefits, claiming that people being paid not to work were keeping consumers from returning to the labor force.

    Employers are having to offer higher wages to get people to come back to work. When wages increase quickly, it drives even more inflation which would put further pressure on mortgage rates which would add to the affordability challenges in housing.

    Today, locally, our median appreciation rate is at 30%!!! It is due to the supply/demand imbalance as our supply is still over 76% below normal while our demand is over 7% above normal. This extreme appreciation rate is expected to fall as inventory continues to grow, it is increasing at an almost imperceptible rate, and as demand continues to decline.

    Elliot Eisenberg’s Scary Scenario. On Tuesday, the economist wrote:

    “Aside of a bad Covid recurrence, here’s how a recession could occur. Due to supply chain problems and labor shortages, consumer prices and wage inflation rise quickly, spooking markets. Powell resists raising rates, but the pressure is too great and he caves. In response, equities, bonds, commodities, and other assets decline. This also pushes leveraged firms into bankruptcy, hurts emerging economies, and we accidentally end up in a mild recession.”

    Lydia Discussed:

    Retro BPO, or a historic BPO looks at the valuation of a home and the comparables at a specific timeframe in the past. They are often used when potential fraud is suspected.

    Servicers do not believe there will be any further extensions for the foreclosure or eviction moratoriums and no further forbearance extensions. There is also a continued increase in inspection requests.

  • Greater Phoenix Real Estate Update 5/14/2021

    Once again, today is all about the AZ market. On Wednesday, Lawyers Title hosted a presentation with Tina Tamboer with the Cromford Report. She always shares pertinent and timely information. Below I have combined a lot of her information from her presentation, along with additional information from my research.

    Inflation:

    According to Reuters, consumer price inflation increased by 0.8% from March to April, the largest increase since June 2009. It increased by 4.2% year over year, the highest since September of 2008. Experts blame supply chain challenges and last spring’s weak readings. Many economists believe has taken the brunt of inflation already. Consumers call it appreciation and economists call it inflation.

    Why Do We Have a Housing Shortage?

    From 2000 to 2009 we over-built for the population. From 2010-2020 we under-built for the population. In 2004-2006, speculation building on credit caused huge problems. When the lending dried up, we had huge price declines. This is not a gap that can be closed easily.

    Housing unit counts will be released at the end of May.

     New Construction:

    Material prices are going up. Lumber has increased the most at roughly 430% year over year. Eye On Housing is a great blog with lots of information. The increased cost of materials for the average new home is nearly $36,000. Condos are up $1,300. Apartments are up $119 a month. Builders pass the costs to the consumers. Builders are begging appraisers to take into consideration the increased material when appraising. If an appraisal doesn’t come in at contract then the builders will struggle to sell.

    Personal income growth soared in 2020. People did not take fancy vacations, spent less on gas, spent less on eating out, etc. This helps offset the rise in prices.

    Single-family permits through March are up 26.7%, year over year. We are at elevated levels. People are afraid of all the building. We haven’t seen this many permits since 2006. The builders may not build all the houses they have permits for.

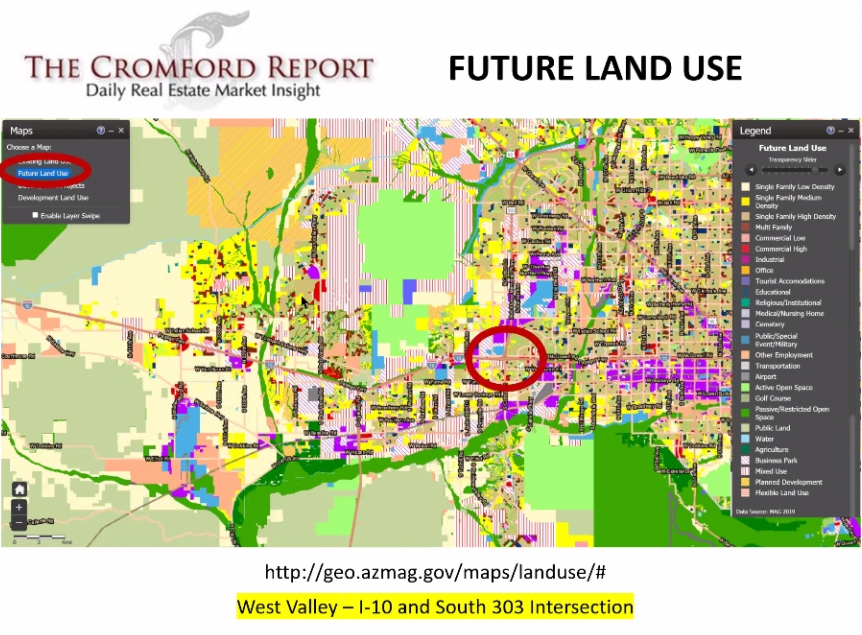
    To see the existing and future planned developments visit http://geo.azmag.gov/maps/landuse/

    Blue is vacant land, which there is a lot of in the northwest valley by the I-17 and 303. The future land use shows upcoming development. A lot is going in around the Taiwan Semiconductor Manufacturing Company.

    Yellow is SFR. High density is tan. Pale yellow is low density, yellow is medium density. Affordable housing to come in the NW valley also. Green is agricultural land, light green is passive land use. Tons of SFR building on the west side. Lots of industrial, which brings lots of jobs.

    Many people are worried about water. The future plans show development in place of agriculture. Agriculture uses far more water than developments do.

    DR Horton is buying large quantities of land as far south as Eloy and that huge Superstition Vistas area just south of Apache Junction.

    Employment:

    US unemployment rate: 6.1%

    AZ unemployment rate: 6.7%

    The labor force increased. Our base has recovered for people who are already working. The numbers don’t look great but we are improving. A lot of service sector jobs are coming back and restaurants and hotels are hiring.

    • Month over month, Arizona nonfarm employment increased by 16,000 jobs.
      • Nine of the eleven major sectors gained jobs.
    • Year over year, Arizona nonfarm employment declined by 2.9%, while US nonfarm employment declined by 4.4% YoY.
    • Year over year, ten major sectors lost jobs; one major sector gained jobs.
    • The Arizona unemployment rate decreased to 6.7% in March 2021 from 6.9% in February 2021.
    • Month over month, the Arizona labor force increased by 6,749 individuals
    • As of March 2021, the Arizona labor force is larger than it was prior to the COVID-19 pandemic.

    Population:

    US population grew by 0.4% we grew by 1.8%. Losing population slows housing growth because fewer people are in houses and buying houses. Our growth came from domestic migration with the largest populations coming from CA, IL, WA.

    Forbearance:

    When forbearance ends it will not rain houses.  There are about 2.2 million mortgages or about 4.2% in an active forbearance plan. There have been huge improvements in forbearance counts. 54% have successfully exited the plan. If all states are equal, each would have about 46,000 properties in forbearance.

    Lots of people are exiting and are current, about 47% are ok. The struggling amount is about 16.4% and that leaves us 7,128 new listings for all of them if they are all struggling and need to sell right away. That is not enough to cause a problem.

    Greater Phoenix economic council has diversified employment over the past 10 years. NV, TX, LA, FL, NJ are going to have more issues with forbearance exits because of the business. We will probably not even have as many as 7,000.

    For more information on forbearance, check out my latest AZ Forbearance Update, here. Properties that are late and in forbearance are still counted in the delinquency numbers. For more info on delinquencies, check out my AZ Forbearance Update from the end of April, here.

    Inflation:

    Overall including gas is 2.6%. (April came out Wednesday) People are stressed, gas has seen an impact. The overall long-term inflation rate is 3%. We are within range. We were at 2.9% right before the pandemic. We have been under 2% and have gotten spoiled. We like low inflation. Low inflation usually follows not-so-great times in our lives. There is no real correlation between inflation and appreciation. When we are in a balanced market appreciation matches the rate of inflation, when it is low, things are not good. Probably won’t have an impact on housing.

    Luxury Market:

    The luxury market and Bitcoin have spiked in 2021. Luxury increased in 2020, but this year it is crazy. It is not just from the CA buyers. The $2 million market is booming! Only Bitcoin and luxury real estate have exploded to this extent. No supporting data, only circumstantial.

    Recording only tells us whether or not they have a loan. Not how they paid for it, with USD or crypto

    Bitcoin is the only thing that has gone up as fast as real estate, if it drops off, will we see a drop off?

    Bitcoin in real estate has been a big headliner for a year. People are buying with crypto. Who are we attracting to Phoenix? A lot of tech companies from CA. Again based on circumstantial info.

    Cromford Market Index:

    Available on the main page of the Cromford Report: https://cromfordreport.com/ (without a subscription)

    • 100 is balanced and prices rise at the rate of inflation, below 100 is a buyer’s market, above 100 is a seller’s market, prices drop below 90, prices rise at 110.
    • On 2/5/2020 we were at 215.1
    • On 3/20/2020 we were at 241
    • On 5/15/2020 we were at 145.2
    • Yesterday we were at 461.2
    • We peaked on 3/14/2021 at 514.9
    • Prior to this run, the previous peak was 312.9 in the spring of 2005.
    • CMI is the predictor, it moves first and then appreciation follows. Cannot predict the CMI.

    The CMI is declining. This is where we see the shift taking shape. Demand is not falling as fast as it was earlier in the year. Since December demand has been dropping but inventory was dropping faster, keeping the CMI high. When the CMI started declining it was at a rate of about 8 points a month, then 5 points and now we are at 2.3 points a month. Demand has stopped dropping and actually increased yesterday, supply has actually risen which is great news. When demand goes below normal is when we see fewer transactions. Homes are still appreciating. It is good to see demand level off. Under 90 is low demand.

    There are still multiple offers and many sales over asking. Measure the temperature 514.9 degrees to 461.2 degrees; the market is still super-hot.

    How long will it take us to get to balance? It took 8 months to drop in 2005. If we stay at this rate, we are looking at 11.5 months to get to balance, which is May of 2022. It is measuring like 2005 which only means that prices are going up at a slower rate.

    Appreciation rates respond to markets. Appreciation rates will continue rising for the next 3-6 months. Annual appreciation rates rise when CMI drops. Price is a lagging indicator. It shows us where we were. CMI is a leading indicator, it tells us will happen.

    Yes, it is still a good time to buy because you always want to buy in a seller’s market, it is a winner’s market. Watch the equity grow. If it drops, it is ok because you have a down payment. Buyer’s markets are losers markets, everyone loses in a buyer’s market, and prices keep dropping during a buyer’s market.

    Just because it goes up does not mean that it will go down. The worst case is going down to balance. Nothing is indicating a decline in prices and no one is predicting one. If supply and demand come together and demand is below balance, the market will be slow and boring with fewer transactions. If supply and demand come together with demand above balance, then the market will be fast-moving, exciting, and have lots of transactions.

    There are 5 cities with increasing CMIs: Fountain Hills, Glendale, Goodyear, Paradise Valley, and Surprise. The factor for downward trend is affordability and pent up demand that created a surge, and buyer fatigue.

    Affordability:

    Affordability in Q1 2021 did not drop below 60, which is the bottom of the unaffordable range. The median family income is $79,000 a year. The national affordability score is 63.1 and for Phoenix, it is 62.8.

    Rentals are not affordable, mortgages are but not rents year over year. Affordability will be tough on rentals. With FHFA 7% portfolio limits for 2nd homes, any added expense will be pushed to the renter, further challenging renters.

    Supply:

    Inventory is rising. It doesn’t usually rise in May, going against the local seasonality trends. This is something to watch. People aren’t going to notice it yet. When you are supposed to be going down and are going up instead it shows a shift in the marketplace.

    Demand:

    • Restrained by lack of supply, not so much by demand.
    • 57.1% of sales closed over asking in April.
    • $16,100 median over asking amount.
    • Larger homes are appreciating more and faster. This is not normal for us or really anywhere.
    • The median sales price for single-family homes has reached $418,500, which is a 33% year over year appreciation rate.

    Summary:

    • The seller’s market is weakening. Sellers won’t notice but we do.
    • Supply: 77% below normal but increasing.
    • Demand: 7.6% above normal, leveling off.
    • 57% of April sales closed over asking for a median amount of $16,000.
    • The median days on market is 6 (hasn’t changed in 7 weeks)
  • This Week in Real Estate 5/10/2021

    In this 10 minute video, Amber Kovarik and I discuss the latest in real estate and lending.

    Real Estate Headlines:

    Many of you may read Inman News and last week they ran a series entitled “Bubble Trouble.” While the headlines are to get our attention, the articles really aren’t about the market crashing. If anyone wants to see any of them, let me know and I will send you the info. Don’t let the headlines scare you or your clients. The market is starting to get more normal, it is not crashing. Demand continues to exceed supply. Here in Phoenix, in March we had 10 buyers for each listing, today we have 5 buyers for each listing, prices are still going up. The decline in demand is allowing some buyers to actually get a contract accepted, which is good. While houses are selling quickly, buyers are educated, now is not the time to push the market. Overpriced listings are sitting and we are seeing more price reductions. This is healthy and good. The roughly 24% year over year appreciation is way too much and unsustainable.

    In economics, it all comes down to supply and demand. In real estate, it is about supply, demand, and equity. In 2005 we had a lack of supply, high demand, and no equity. Today, we have even lower inventory, solid demand, and tons of equity. Supply has started increasing slowly, but we are still about 77% below normal. Demand remains nearly 8% above normal.

    Eviction Ban Lifted? Nope.

    On Wednesday a federal judge lifted that the CDC’s eviction ban, which is set to expire on June 30, after a 7-month lawsuit filed by the Alabama and Georgia Association of Realtors. Within hours the DOJ filed an emergency appeal on the case and issued a stay effectively prohibiting any evictions until the appeals process is over. Legal housing experts are recommending against any evictions prior to June 30th.  FTC and CFPB issued a statement to landlords stating they would be held accountable for moving forward with any evictions.

    Too Interesting Not to Share:

    Loans that originated from 2005-2008 make up only 2% of existing loans but those loans make up 5x the seriously delinquent rate when compared to loans that originated since 2009. Those loans are still haunting us!

    Lending:

    Interest rates increased quickly earlier this year and then came back down quickly. They remain right around 3%.

  • AZ Forbearance Update 5/5/2021

    In this 13 minute video, Lydia Wietsma and I discuss the latest in forbearance, delinquencies, servicing, and federal rulings.

    Bull vs Bubble Market

    There is a lot of panic and tons of headlines about a bubble. Today’s market is a bull real estate market, not a bubble.

    • Is it true or false demand? Are the properties occupied by either renters or owners? True demand is when people are living in the property. False demand is when investors park money in the asset with no plans of using the property. Today homes are lived in.
    • Not only that but today we have among the best buyer demographics. There are about 32M American nationwide aged 27-34, prime home buying age. It is expected the buyer demand will remain elevated through the end of 2024, despite what interest rates do.
    • Are rents increasing with sales prices? Rents, like sales prices, increase with greater demand and less supply and decrease with less demand and increased supply. Rental rates decreased during 2004-2006 and today they are increasing faster than sales prices in greater Phoenix.
    • Huge increases of speculative buying on credit (bubble) versus cash buyers and down-payment buyers (bull). Credit worthy borrowers.

    Everything comes down to supply and demand. The market did peak. It did so in the middle of March. Demand has been dropping, slowly since then. Here locally it remains 7% above normal while supply is 77% below normal. Until supply exceeds demand we will stay in an appreciating market.

    With home prices continuing to appreciate and the economy mending from the pandemic, there are few signs of a looming foreclosure crisis. Even though nearly 2 million homeowners are three months or more behind on their mortgage payments, many homeowners who entered into forbearance early in the pandemic are now resuming payments paying their mortgages off.

    Forbearance Numbers:

    Forbearance has been a successful program. When it was initially created it was expected there would be 30 million borrowers in forbearance, we peaked at 8 million and as of last week, we are down to 2.23 million or 4.47% of borrowers, down from the previous week’s 4.49%.

    Forbearance by Stage:

    • 12.8% of loans in forbearance are in the initial stage, down from the previous week’s 12.9%.
    • 82.3% are on extension, down from last week’s 82.4%.
    • The remaining 4.9% are re-entries, up from the previous week’s 4.8%.

    Forbearance Exits from June 1, 2020 through April 25, 2021

    47.2% of borrowers continued making their payments, got caught up upon exit, or paid off the loan with a refinance or sale upon exit. Down slightly from the previous week’s 47.3%.

    14.6% of borrowers exited their plan, still behind on their payments and without a loss mitigation plan in place. This number remained flat from the last 2 weeks.

    Breaking News:

    The federal court’s ruling that lifted the CDC’s ban on nationwide evictions has been overturned and is still set to expire at the end of June.

  • Greater Phoenix Real Estate Update 4/30/2021

    Yesterday one of my clients excitedly called to tell me she had accepted an offer on her home for $1.2M more than she paid for it about two years ago. She then said, “Now what do we do? Rent, buy, flip?” I paused, gathered my thoughts, considered the numbers, and answered, “Don’t rent. Buy.”

    Logan Mohtashami recently wrote about why we are not in a housing bubble, “These Americans who are outbidding others and getting the home are doing very well financially. I am not talking about cash buyers or investors. I am talking about primary resident mortgage homebuyers. They have enough home-buying power to win the house. The market is unhealthy because we shouldn’t be having this much competition for shelter, but it’s not speculation demand at all.”

    Economy:

    Yesterday, Elliot Eisenberg wrote, “GDP grew at a pleasantly fast 6.4% annualized rate in 21Q1 and is now just 0.9% below its inflation-adjusted level on 12/31/19. It will surpass that level in mid-May 2021. By contrast, it took more than three years for real GDP to fully recover in the last recession. 21Q2 and 21Q3 GDP should easily exceed 21Q1’s 6.4%, and GDP growth in 2021 will, baring disaster, be the best since 1984.”

    Lending:

    With forbearance and delinquencies declining, 16.4% of homeowners got caught up on their mortgage in March, lessening the severity of the ultimate impact of these programs. There are still about 1.5M 90+ day late borrowers, which is not insignificant, however many are in forbearance and are protected for the time being. Over 47% of the borrowers exiting their forbearance plan never missed a payment, were caught up upon exit, or paid off the loan with a refinance or sale. For more info, check out my forbearance update from Wednesday.

    Purchase mortgage applications, a leading indicator, decreased 4% week over week, last week. This is the result of frenzied demand normalizing, low inventory, and significant home-price growth.

    “The purchase market’s recent slide comes despite a strengthening economy and labor market. Activity is still above year-ago levels, but accelerating home-price growth and low inventory has led to a decline in purchase applications in four of the last five weeks.”

    Joel Kan, MBA’s Associate Vice President of Economic and Industry Forecasting

    National Real Estate:

    After two months of declines, pending home sales increased by 1.9% from February to March. NAR projects a 10% year over year increase of existing home sales in 2021 with prices increasing by 9%.

    “Low inventory has been a consistent problem, but more inventory will show up as new home construction intensifies in the coming months, as well as from a steady wind-down of the mortgage forbearance program. Although these moves won’t immediately replenish low supply, they will be a step forward.”

    Dr. Lawrence Yun, NAR’s Chief Economist

    After new home sales declined by 18.2% from January to February, they increased by 20.7% from February to March and were up 66.8% year over year, the highest rate since 2006.

    Last week we had our first teaser with a slight inventory increase, this week available single-family listings declined by 2,000 down to 310,039. The steep decline in inventory is leveling out. Inventory is expected to grow for the next few months.

    The chart below doesn’t show the roughly 100,000 new listings that hit the market each week. About 28,000 went under contract in less than 24 hours and another 42,000 went under contract in less than a week. Sales are expected to remain at an elevated pace through June.

    The AZ Market:

    Inventory levels remain at historic lows but it stopped dropping. It is down 76% from two years ago and 69% from last year. Monthly sales are 11% above where they were two years ago and 29% above where they were last year.

    New Construction: The median new home price in greater Phoenix is now up to $403,000, according to Zonda. That is a 16% year over year price increase and sales are up 17% year over year. Lately, prices of new homes have been increasing 3% a month. While it seems like new homes are going up everywhere, there are actually 100 fewer active new subdivisions this year than there were last year. There is a total of 427 active subdivisions in Maricopa and Pinal Counties, the lowest in seven years.

    Case-Shiller Index: February’s Case-Shiller Index (the report that many large builders, Wall Street, and the US Census to track appreciation) shows that greater Phoenix continues to lead the pack with the highest year over year appreciation rate in the country at 17.4%. The national year over year appreciation was 12%, the highest year over year gain since February of 2006. Phoenix’s month-over-month gain was 2.03% while the national average was 1.05%. Tucson just barely beat Phoenix for the top spot for the largest year-over-year single-family rental appreciation at 11.2% and 11.1%, respectively.

    Policy:

    American Families Plan: On Wednesday, President Biden announced his proposed policy to provide free pre-Kindergarten and community college. The funding would come from taxing capital gains and inherited properties as well as eliminating the 1031 exchange program. This plan most significantly impacts real estate investors to the tune of $41B over the course of four years. Read more here. The proposal will likely evolve as it goes through Congress.

    First-Time Homebuyer Act: Congressmen from CA and OR introduced a bill that provides a tax credit for first-time homebuyers of up to 10% of the purchase price or $15,000. Buyers may not have owned a home in the past three years and make no more than 160% of the median income for the area.

    Zillow Browsing:

    A recent study shows that Zillow, like many social media platforms, can be addictive. According to the study: 53% of people looked up their boss’s house, 30% browse to daydream about houses they can’t afford, 62% checked out the value of their neighbor’s house, and 27% said they browse Zillow to relax. Additionally, browsers admitted to:

    Real Estate News:

    • Asset management companies, Altas Real Estate and DivcoWest have created a joint venture for single-family rentals and will spend $1B “acquiring and renovating homes in high-growth states including Colorado, Arizona, Idaho, Nevada, and Utah,” according to a press release.
    • Lumber prices increased again, now triple what they were 12 months ago, adding an estimated $36,000 to the average price of a new construction single family home.

    Final Thoughts:

    Elliott Pollack & Company wrote on Monday, “Housing will continue to make headlines for the foreseeable future. This level of activity and interest has not been seen since the mid-2000s. It is difficult not to compare these two periods. We went through our first recession since the Great Recession and the effects of that recession are still fresh in our minds. Yet, this is different. Measures were taken to keep people afloat and avoid a large number of foreclosures so far. Job growth has been steady and has made a significant recovery since last year. The number of listings is at a decade low and demand is outpacing supply, causing upward pressure on prices. Mortgage rates remain at historical lows and have allowed buyers to buy more and maintain affordability (Greater Phoenix and Greater Tucson) to a certain extent. And housing does not appear to be slowing down yet. We have seen an increase in permitting activity across the country and in Arizona, especially in its biggest metro areas.”

    Copyright 2021 Sarah Perkins

  • AZ Forbearance Update 4/28/2021

    In this 10 minute video, Lydia Wietsma and I discuss the latest in forbearance, delinquencies, and loan servicing.

    Consumer Finance Protection Bureau (CFPB)

    The CFPB has put loan servicing companies under a microscope. It is watching the servicers to ensure that borrowers in forbearance have been handled properly.

    “I think the math speaks for itself how well the forbearance program has worked, and it’s one of the few times in my career that I have seen a government-initiated program adopted as well and executed as well by the industry as this one,” said Rick Sharga, executive vice president of RealtyTrac.

    Forbearance Numbers:

    After 2 weeks of large drops, we had a small drop in total loans in forbearance. As of April 18, about 4.49% of loans were in forbearance, a slight decline from 4.50%. This is a decline of nearly 5,000 borrowers to about 2.25 million.

    Forbearance by Stage:

    • 12.9% of loans in forbearance are in the initial stage, down from the previous week’s 13.1%
    • 82.4% are on extension, up from last week’s 82.1%. More than 40% of borrowers on extension have now been in a forbearance plan for over 12 months.
    • The remaining 4.7% are re-entries, down from last week’s 4.8%.

    Forbearance exits from June 1, 2020 through April 18, 2021

    47.3% of borrowers continued making their payments throughout the forbearance plan, got caught up upon exit, or paid off the loan with a refinance or sale.

    14.6% of borrowers exited their plan, still behind on their payments and without a loss mitigation plan in place. This number remained flat from last week.

    Delinquencies:

    • Over the past 20 years, delinquencies have fallen by nearly 10% on average in March due to tax return and other seasonal funds being used by homeowners to pay down past-due mortgage debt
    • Despite March’s strong performance, some 1.9 million mortgage-holders – including those in active forbearance that are behind on their payments – are at least 90 days past due on payments
    • There are 1.5 million more such serious delinquencies than at the onset of the pandemic, nearly five times pre-pandemic levels

    New Low-Income Refinance Option:

    This morning FHFA announced a new refinance option for low income borrowers.

    To qualify for this option, beyond owning a GSE-backed mortgage, a borrower must have an income at or below 80% of the area’s median income and have been current of their payments for the last six-months, with no more than one payment missed in the last 12. Borrowers must also not have a mortgage with an LTV ratio greater than 97% and a DTI no higher than 65%. Lastly, borrowers must have a FICO score no lower than 620.

    Now, the FHFA said the new refi option could save borrowers an average of between $100 and $250 a month. 

    Under the new refi option, lenders must ensure that the borrower saves at least $50 a month in their mortgage payments while simultaneously dropping their interest rate by at least ½ of a percent or 50 basis points. This could potentially knock an already historically great rate such as 3.5% down to 3% with the new product.

    Loan Servicing:

    Lydia’s servicing company has added another local iBuyer to its list of clients they are doing inspections for. Opendoor has been hiring this company since July for its inspections.

    Inspections have been consistent.

    While foreclosures remain at a standstill, servicing companies are doing more inspections on properties that were inspected 12 months ago.

  • Greater Phoenix Real Estate Update 4/23/2021

    The pandemic created involuntary savings. People simply couldn’t spend the way they had in the past, and all of a sudden they had money for a down payment. Along with historic low mortgage rates and the ability to work remotely; the extra savings enabled super strong demand. As the economy opens up and people are able to spend their money on more services like concerts, eating out, and traveling the buyer demand is likely to subside modestly. Today’s ideal demographics (see last week’s post for details) will keep replacement buyers steady through 2024. As the demand fades to slightly elevated from crazy hot, the market will return to normal sales cycles.

    Despite movement towards normal, sales prices continue to grow. While yes, inventory has increased, locally it remains over 77% below normal and demand has decreased, it is still over 8% above normal. This supply/demand imbalance is so severe, it will take years to correct, and is why sales prices continue increasing at an appreciation rate of nearly 22%, year over year.

    Bull versus Bubble:

    There is a difference between a bull market and a bubble market. Real estate experts agree, we are currently in a bull market. Here are some basic indicators to illustrate the differences:

    • Is it true or false demand? Are the properties occupied by either renters or owners? True demand is when people are living in the property. False demand is when investors park money in the asset with no plans of using the property. Today homes are lived in.
    • Are rents increasing with sales prices? Rents, like sales prices, increase with greater demand and less supply and decrease with less demand and increased supply. Rental rates decreased during 2004-2006 and today they are increasing faster than sales prices in greater Phoenix. There are some markets, like San Francisco, where rents are falling while sales prices are increasing indicating the market is overvalued.
    • Huge increases of speculative buying on credit (bubble) versus cash buyers and down-payment buyers (bull).
    • What are the fraud levels? The higher the fraud levels, the higher the likelihood of a bubble market. If you were in the business during 2004-2006, chances are good you know someone in prison. Today, there are exhausted buyers and sellers who are unsure where they will go; the price appreciation is based on supply and demand, not collusion.

    National Real Estate:

    Existing homes sales declined by 3.7% from February to March, a smaller decline than the 6.6% decline from January to February. Both declines are attributed to the low inventory levels.

    “Consumers are facing much higher home prices, rising mortgage rates, and falling affordability, however, buyers are still actively in the market. The sales for March would have been measurably higher, had there been more inventory. Days-on-market are swift, multiple offers are prevalent, and buyer confidence is rising.”

    -Dr. Lawrence Yun, NAR’s Chief Economist

    It happened – for the first time in 52 weeks – not only did inventory not drop last week, it increased by 5,000 listings so now we are up to 312,000 available single family listings nationwide, which is an increase of 1.6%.

    Demand remains high; immediate sales also increased, up 3,000 from last week to 26,000 new single-family listings hit the market and went under contract in less than 24 hours.

    The high demand delayed the normal season cycle by about a month, normally by mid-March inventory starts climbing for peak buying season, which is normally March – June. In housing, normal is ideal.

    In addition to buyers having more options, an increase in available listings allows more time for appraisals.  So appraisers can get caught up and increases the likelihood of homes coming in at value.

    This week, the national median sales price increased by $5,000 week over week to $380,000 and the median asking price of new listings increased by $10,000 week over week to $360,000. Sales prices will keep climbing until about June 30th. Then they start to slow because cheaper homes tend to sell more in the 2nd half of the year.

    Homeownership Rates:

    In 2020, homeownership grew by 2.6% or by 3.9M new homeowners to 67.4% and the majority of that gain took place during Q2 2020 and Q3 2020.

    From 3Q 2019 to Q3 2020, Arizona’s homeownership rate increased by 4.1%, up to 71%. Arkansas had the biggest gain at a 7.1% increase, while New Jersey’s homeownership rate declined by 4.4%. West Virginia has the highest homeownership rate at 78.6%.

    The AZ Market:

    According to Redfin, nationwide luxury home sales increased by 41.6% in Q1 2021, year over year. In greater Phoenix, luxury home sales prices are up 25% in Q1 2021, year over year.

    New Construction:

    Nationwide, single-family permits increased from February to March by 4.6%. Single-family completions increased from February to March by 5.3%.

    Housing starts, considered an economic leading indicator, increased by 37% in March, year over year, and increased by 19.4% from February to March, though February’s level was lower than expected due to the winter storms.

    “In nearly every market, 20% more inventory means 20% more home sales. Today’s news on the new home construction surge is, therefore, highly welcomed, especially in light of major challenges on material costs and soaring lumber prices.”

    -Dr. Lawrence Yun, NAR’s Chief Economist

    According to Freddie Mac, builders need to build 3.8 million single-family homes just to meet current demand levels. The lag of new construction over the past decade has contributed to today’s low inventory.

    In 2020 builders built about 65,000 entry-level homes while 2.38 million renters became first-time homeowners.

    “As we navigate our way through the year and get beyond the pandemic, we expect the housing supply shortage to continue to be one of the largest obstacles to inclusive economic growth in the U.S. Simply put, we must build more single-family entry-level housing to address this shortage, which has strong implications for the wealth, health and stability of American communities.”

    -Sam Khater, Freddie Mac’s Chief Economist

    Commercial Real Estate:

    • The local office market has suffered four straight months of increased vacancies putting the vacancy rate at the end of Q1 2021 at 19.1%!

    “A year-plus of forced acceptance of remote services in every sector has carved permanent change into our behavior. And, few sectors have seen a more radical transformation than office work.”

    -Scott Galloway, Author & NYU Business Professor
    • Many major companies are making plans to reduce their commercial real estate footprint. JP Morgan Chase is planning to significantly reduce its commercial space as 10% of its employees will work from home permanently. CEO Jamie Dimon said, “Remote work will change how we manage our real estate.”
    • Office rents are expected to decline by 15% nationwide.

    Lending:

    • Purchase mortgage applications increased by 7% last week from the previous week and are up 57% year over year. We still have a few more weeks of year over year data comparing last year’s lockdown market to this year’s high demand/low inventory market.
    • Despite expectations of interest rates reaching 3.7% this year, the Mortgage Bankers Association is forecasting a 16.4% year over year increase in purchase mortgage volume which would set a new record at $1.67 trillion.

    “The housing market is incredibly strong this year, with robust housing demand in nearly every part of the country, driven by the improving economy, households seeking more indoor and outdoor space, millennials reaching their prime homebuying years, and still low mortgage rates. A lack of supply is the biggest hurdle to an even larger increase in home sales. The widening imbalance of supply and demand is driving up home-price growth and eroding affordability – especially for entry-level buyers.”  

    -Mike Fratantoni, MBA’s Chief Economist and Senior Vice President

    Real Estate News:

    • According to a recent Harvard report, due to last year’s lockdowns about 76% of homeowners completed at least one home remodeling project. The complexity and scope of the projects are increasing as homeowners are willing to spend more as home values rise. It is expected that in 2022 homeowners will spend $370 billion on home improvements.
    • iBuyer acquisitions are nearing their Q1 2020 numbers. While Phoenix remains the national leader in iBuyer activity, the margin of that lead is shrinking and Atlanta is catching up. Meanwhile, the two cities have significant leads ahead of the four remaining largest iBuyer markets in the country: Dallas, Charlotte, Las Vegas, and Raleigh.

    Final Thoughts:

    As one of my favorite housing economists, Logan Mohtashami with HousingWire recently wrote, “The nature of yellow journalism in our society is that fear and loathing sell. Impending doom is somehow sexy and gets many eyeballs and clicks, whereas the standard economic truth does not. People like myself who spend their time yammering on about demographics, prime-age employment to population levels, and how much shelter inflation can move Core CPI, are pleasant to listen to when the double martini doesn’t do the job of putting you to sleep. I get it. Stick to the facts, don’t get sidelined by the sideshow, and we will all be better off.”

    Copyright 2021 Sarah Perkins

  • AZ Forbearance Update 4/21/2021

    In this 13 minute video, Lydia Wietsma and I discuss the latest in the economy, forbearance, and borrower options.

    The most important takeaway from today’s video is that struggling borrowers have options and many people who entered a forbearance plan do not understand what forbearance is. If a borrower has questions about their situation, they need to call their mortgage servicer to discuss options. Time is of the essence.

    The CFPB created this page full of information for struggling homeowners and renters.

    Economy:

    Economically speaking, we are in very good shape. Things are improving across the board and residential real estate remains the strongest sector. The market is just beginning to show signs of normalcy, which is very good. Demand, while still strong, is calming down. Fatigued buyers are just now getting a few more options.

    The pandemic created involuntary savings. People simply couldn’t spend the way they used to so all of a sudden they had money for a down payment or that down payment they were saving for reached the target amount. This enabled super strong demand. As the economy opens up and people are able to spend their money on more services like concerts, eating out, and traveling the buyer demand is likely to subside some. This will also help bring us back to closer to normal sales cycles. Despite movement towards normal, sales prices and appreciation continue to grow. While yes, inventory has increased, it remains over 77% below normal and demand has decreased it is still over 8% above normal. This supply-demand imbalance is so severe, it will take years to correct which is why sales prices continue increasing around 18% year over year.

    Unemployment is improving. When all kids go back to school next fall, provided that happens, the unemployment rate will get even better. There are over 11 million students K-12 in the US. A lot of parents had to choose between their kid and their job.

    Forbearance Numbers:

    Two weeks ago, we had a big drop in total loans in forbearance, and last week we had another large drop. We are now down to 4.50% of loans or 2.3 million homeowners in a forbearance plan. Two weeks ago, it was 4.9% of loans.

    Forbearance by Stage:

    • 13.1% of loans in forbearance are in the initial stage, down from two weeks ago when it was 13.7%.

    • 82.1% are on extension, down from two weeks ago when it was 84.1%. More than 36% of borrowers on extension have now been in a forbearance plan for over 12 months.

    • 4.8% are re-entries, up from two weeks ago when it was 2.2%.

    Forbearance exits from June 1, 2020, through April 11, 2021:

    • 40.1% of borrowers either continued making their payments throughout their forbearance plan or got caught up upon exit. This is down from two weeks ago when it was 41.2%.

    • 14.6% of borrowers exited their plan, still behind on their payments and without a loss mitigation plan in place. This is an increase from two weeks ago when it was 13.9%.

    There are other methods for exiting forbearance such as loan modification, refinance, sale, loan deferral, etc. Mike Fratantoni, MBA’s Senior Vice President and Chief Economist said this about the exits:

    “In terms of performance, more than 88 percent of homeowners who have exited into deferral plans, modifications, or repayment plans were current on their loans at the end of March, compared to 92 percent of all homeowners. The accelerating economic recovery in March helped more homeowners recover and become current on their mortgages, in addition to helping other homeowners with more stable financial situations exit forbearance.”

    BPOs are increasing a lot.

    A borrower did not realize that forbearance was a loan modification. He did not know that he had options. He thought he had a year of not making his payments and didn’t think he had to pay it back.

    The biggest unknown is the lack of information. The lenders are not necessarily charging late fees, but they are charging penalties. Each month the lenders and servicers are paying the impounds which are the taxes and insurance to keep the property protected and prevents tax liens. There has been no moratorium on taxes.

  • This Week in (Greater Phoenix) Real Estate 4/19/21

    In this 12 minute video, Amber Kovarik and I discuss the latest in real estate trends and lending from the past week.

    It is almost daily I hear people talking about how they will get into the market when prices go back down. And they do not like my follow-up question asking why they think the market will go down. They don’t like my question because they cannot give me an answer. They tell me they are afraid things are like they were in the 2005 bubble.

    Today’s market is nothing like the 2005 bubble. We have real demand. We have real appreciation due to people actually wanting to move here and live in houses here. Economic cycles are based on supply and demand.

    Our market peaked on March 14th. What does that mean? It means that demand is falling faster than supply. What does that mean? It means that we are moving towards a more balanced, healthy market. Balance and healthy are good. Demand remains slightly elevated, at about 9% above normal. Supply is rising, so we are now only below normal by 77.4%!!! That is an increase from 78% below normal. Demand needs to fall below supply in order for prices to drop. That is not happening anytime soon.

    When you combine basic supply and demand it is important to think about where demand comes from. There are more than 32,400,000 Americans aged 27-33. This is the largest group, in the largest generation and this is the prime time for getting married, having babies, and buying houses. This demand is expected through 2024.

    Even with increasing prices and increased interest rates, there are still enough replacement buyers for the listings even if some buyers are removed from the market.

    Another fear I hear about is overbuilding. Builders are not overbuilding, they are attempting to pick up from the underbuilding that has taken place for the past decade. Builders learned a very tough lesson in the 2008 crash and they shifted their business models and will not overbuild. Business is good for builders right now.

    Institutional investors are another reason we have tight supply. Since the end of the Great Recession, institutional investors have purchased over 7M single-family homes to keep as rentals. These buyers are home rental firms, like Invitation Homes which owns about 80,000 houses in 16 markets, private equity, pension funds, sovereign wealth funds, etc.

    According to John Burns Real Estate Consulting, institutional investors are currently purchasing about 20% of all single-family homes in the US. Due to the continuously climbing rental rates in Phoenix, these buyers are purchasing about 30% of the single-family supply. They pay cash and will go over the asking price in order to secure the property; something many buyers simply can’t compete with. Additionally, these properties are held longer than a typical owner stays, meaning these properties are being completely removed from the market.

    With forbearance numbers improving, we’re down to about 2.3 million borrowers in forbearance and Mike Fratantoni Senior Vice President of the MBA said, “In terms of performance, more than 88 percent of homeowners who have exited into deferral plans, modifications or repayment plans were current on their loans at the end of March, compared to 92 percent of all homeowners.” 

    A recent article shared insight into Google search queries. People asking, “When is the housing market going to crash?” increased by 2,450% in the past 30 days.

    The market is actually starting to normalize and a semblance of seasonality is starting to emerge. These are good things. If you or your clients have questions on where the market indicators are pointing, let’s talk. Recoveries are fragile and misinformation is toxic.

    There are a lot of strategies available for buyers who are looking to make strong, over asking offers.