Category: AZ Real Estate

  • AZ Forbearance Update 3/17/2021

    In this 15 minute video, Lydia Wietsma and I discuss the latest in mortgage forbearance, delinquencies, and declining demand (not prices).

    Forbearances:

    We have some good news and progress in regards to forbearance and delinquencies. The rates of mortgages in forbearance declined again week over week. We are now down to 5.14% from 5.20% keeping the number about 2.6 million.

    Forbearance by Stage:

    • 14.1% are in the initial stage, down from last week’s 14.6%.
    • 83.3% are on an extension, an increase from just below 83% last week.
    • 2.6% are re-entries, the same as last week

    Forbearance exits from June 1, 2020 through March 7, 2021:

    • 42.3% of forbearance exits are current upon exiting their plan.
    • 14.1% represented borrowers who did not make all of their monthly payments and exited forbearance without a loss mitigation plan in place yet.

    Delinquencies:

    Remember unpaid loans in forbearance are also counted in the mortgage delinquency numbers. The following information comes from the Black Knight Mortgage Monitor report. For the full report, click here.

    From December to January total delinquent loans decreased by 3.82% to 5.9% of loans are delinquent. This is the first time it has been below 6% since March 2020.

    Early-stage delinquencies continue to stay below pre-pandemic levels, with the number of borrowers with a single missed payment down 24% and 60-day delinquencies down 6%.

    However, despite some slight improvement in January, the 2.1 million serious delinquencies (90+ days) remain 5X or 1.7 million more than their pre-pandemic levels.

    Here in AZ, we have had an increase of 2.8% in seriously delinquent loans, year over year. That is lower than most states. Hawaii has the highest rate at 5.2% and Idaho has the lowest 1.6%.

    Black Knight Mortgage Monitor – January 2021

    370,000 borrowers who were current on their mortgage became 30 days delinquent in January, marking the lowest inflow in the past 12 months.

    However, the number of borrowers rolling from 30-to-60 and 60-to-90 days delinquent were up 31% and 75% year-over-year respectively as borrowers may be rolling to later stages at higher rates because of participation in forbearance plans.

    While the rate of improvement could accelerate/decelerate based on broader economic factors, borrowers have limited incentive to leave forbearance plans early and we could see just a 20% decline in serious delinquencies between now and the end of Q3 2021 if current trends hold true.

    Not only does this place continued pressure on servicing entities, but forborne interest as well as tax and insurance payments have a negative impact on borrowers’ equity positions.

    The industry must now walk the fine line of providing ample borrower protections while at the same time trying to limit equity erosion and servicer advance risk. Which is why it is important for struggling borrowers to get into a forbearance plan within their specific loan’s guidelines. The timelines are a little confusing too.

    Timelines:

    Anyone can get started in a forbearance now, borrowers have until June 30, 2021 to get started. Then each loan type has different timelines for extensions. We will post the dates for each loan type.

    VA, FHA & USDA borrowers:

    • On February 16, 2021, the U.S. Department of Housing and Urban Development (HUD), the U.S. Department of Veterans Affairs (VA) and the U.S. Department of Agriculture (USDA) extended moratoriums on single-family evictions and foreclosures to June 30, 2021.
    • They also announced that borrowers who have been on a COVID-19 forbearance plan on or before June 30, 2020 may request up to six months of additional mortgage payment forbearance, in three-month increments, which provides up to 18 months of deferment.
    • HUD extended the deadline for the first legal action against FHA borrowers and the reasonable diligence time frame to 180 days from the date of expiration of the foreclosure and eviction moratorium.

    Fannie Mae & Freddie Mac borrowers:

    • On February 25, 2021, the Federal Housing Finance Agency (FHFA) extended moratoriums on single-family evictions and foreclosures to June 30, 2021.
    • It also announced that borrowers who are on a COVID-19 forbearance plan on or before February 28, 2021 may request up to three months of additional mortgage payment forbearance, which provides up to 15 months of deferment.

    Demand:

    We will likely have fewer transactions in the 2nd half of the year due to low inventory but also dropping demand partially due to rising prices and rising interest rates and the market is trying to stabilize. Demand is currently dropping faster than supply. Nationwide supply did not drop last week, for the first time in a year. Dropping demand is hard to notice when you go from 50 offers to 15 offers, or even 15 offers to 3 offers. This does not mean that prices are dropping or will drop. It just means sales will not be as far above asking and it is not the time for sellers to overprice their listings. Expect increased competition in the coming months.

  • Greater Phoenix Real Estate Update 3/12/2021

    One year ago yesterday, the World Health Organization officially declared the coronavirus a worldwide pandemic. Despite our efforts, no one accurately predicted the following 366 days. The light at the end of the tunnel is getting brighter. Kids are going back to school, vaccines are being distributed, the economic conditions are improving, and residential real estate – the sector that carried the entire economy for a year.

    Real Estate Disruption:

    Two weeks ago I wrote about real estate becoming less grassroots, more Wall Street, and Zillow’s new Zestimate. You can read the update here. On Wednesday, Brad Inman wrote about 8 of the 10 largest real estate firms being publicly traded. Those firms represent nearly 45% of all Realtors. There are upsides and downsides to Wall Street in real estate. Read his article here.

    Last year Compass lost $270 million (details below). Zillow’s iBuyer and Opendoor combined lost $607 million in 2020. In 2019 they lost a combined $650 million. How is it that two companies can lose over $1.2 billion dollars in two years and remain in business? These companies are spending big money fighting for market share in the strongest sector in the economy. Why? Because US residential real estate is valued at $39.3 trillion, which is nearly double the 2019 US GDP ($21.4 trillion) and it is the nation’s most valuable asset. It is followed by equities at $37.2 trillion and commercial real estate at $20.4 trillion. With so much value in residential real estate and it being an industry that dodged disruption for a long time, Wall Street and Silicon Valley will continue to create and fund disruptors until they can figure out how to turn a profit.

    Compass:

    Compass, one of the fastest-growing real estate firms in the country has made a lot of waves over the past few years spending big money on advertising and up to $250,000 agent signing bonuses. CEO, Robert Reffkin has raised millions from investors like Softbank, Opendoor’s biggest investor before going public. Compass is spending money buying tech companies and Realtors. They recently filed their IPO and showed that despite bringing in $3.7 billion in revenue in 2020, it had a net loss of over $270 million. The filing notes stated, “may not be able to achieve profitability and we may continue to incur significant losses in the future.” Reasons given are market expansion costs, declines in real estate sales, and increased competition in the market. Compass is counting on its tech investments to drive profits.

    Opendoor:

    On its recent earnings call, CEO Eric Wu said that Opendoor’s offer requests have increased 50% year over year. By the end of 2021, Opendoor will have doubled number of markets and will continue entering new markets, with a goal of being in 100 markets and serving 70% of US homes. In order to gain market share the company has expanded its buy box and is continuing to build its vertical integration by offering title, escrow, and mortgage services along with traditional brokerage services.

    REX’s Lawsuit:

    On Tuesday, discount brokerage, REX, filed an anti-trust lawsuit against Zillow, Trulia, and NAR. The company charges roughly 2% commission, 1% goes to the brokerage and 1% to the listing agent. It is not a member of any MLS and does not pay buyer’s agents a commission. REX markets all of its listings online, including on Zillow and Trulia. The complaint states that NAR’s rules, enforced by the MLSs, requires that a seller pay a buyer agent’s commission. Now that Zillow is also a licensed brokerage it has joined the MLSs and must follow local MLS rules. As Zillow has adjusted its platform to be compliant, non-agent listings are now in a different section from the agent-represented listings. Zillow’s spokesperson said Zillow’s goal is to change the MLS rules so that all available listings would be located in one place on the site, allowing for easier searching. However, currently, the MLS does not allow for that.

    National Real Estate:

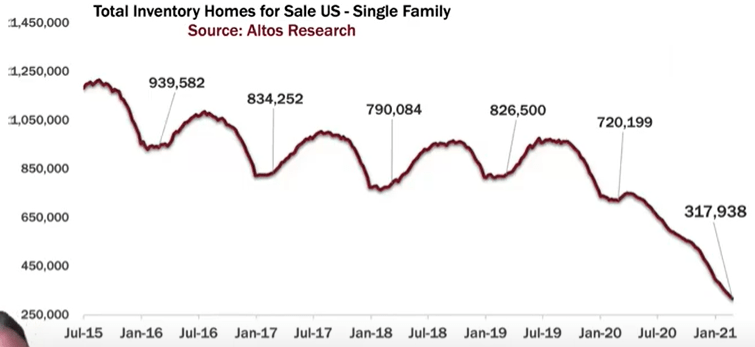
    Nationwide there are just under 318,000 active single family listings, a 55% decrease year over year.

    One of the reasons for our low inventory nationwide is due to the low interest rates we have had for over 10+ years. 5% in 2009 was a record low. While our housing market recovered slowly after the Great Recession, many people moved up but kept their previous homes as rentals. Since 2013 about 7 million single family residences have become rentals, removing their availability from the resale market.

    The supply to demand imbalance continues to push up sales prices and more properties are selling for over asking than ever before. Nationwide we hit a record low for the amount of homes taking a price reduction, the average is about 35% of active listings have at least one price drop before going under contract. Today it is just under 17%.

    The AZ Market:

    Here in Phoenix 44% of sales in the past 30 days closed over asking.

    Greater Phoenix has fewer than 3800 active listings and only 2700 active single family homes available which explains our 19.5% year over year appreciation.

    Join us today for a Zoom meeting at 11am for a deep dive in the Greater Phoenix market with Tina Tamboer with the Cromford Report. To register, click here.

    Lending:

    Mortgage interest rates tend to follow the 10-year treasury yield so it is often used to predict mortgage rates. This chart shows them moving together for the past 50 years.

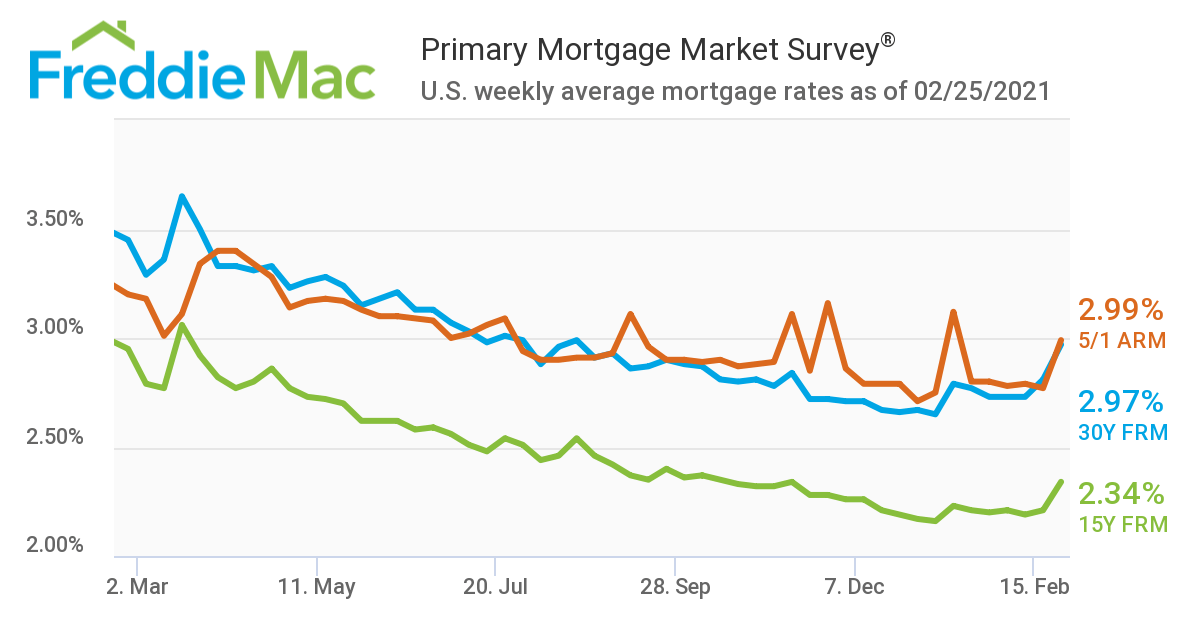
    Going deeper, here they are for the past 10 years. The 10-year treasury rate has been increasing since October and interest rates only started catching up in February. An increasing treasury rate means a growing economy because as the treasury rate goes up, investors become more confident in the market.

    Last week purchase mortgage applications were up 7% week over week and 2% year over year. Demand remains higher than supply, both nationally and locally. It is impressive that applications increased when rates have increased as quickly as they have. A big reason for the continued demand, according to several leading economists, is based on today’s demographics. The largest group of the largest generation is about 26-34; prime home-buying age. These ‘Replacement buyers’ as some call them, will keep demand high through the end of 2024.

    For forbearance and foreclosure news, check out my update and video from Wednesday, here.

    Real Estate News:

    • UWM, the country’s largest wholesale lender recently announced it will not work with mortgage brokers who work with Rocket Mortgage or Fairway Mortgage. Does this set a precedent of big companies stating, “If you do business with them, I will not do business with you.”?
    • Walmart is partnering with Ribbit Capital, a fintech investment firm to create a new fintech that will offer “innovative and affordable” financial products. They even hired the head of Goldman Sachs’ consumer unit to run it. This is in addition to Walmart’s debit, credit, and check cashing services. While they haven’t specifically said they are going into mortgages, many experts in the field believe that is exactly what Walmart is creating, affordable mortgages.
    • Two weeks ago Federal judge in Texas ruled that the CDC’s eviction moratorium is unconstitutional. The court stated that Congress lacked the authority to give the CDC power to halt evictions, and that the moratorium infringes upon landlords’ rights under state law. The DOJ promptly filed a notice to appeal the ruling.
    • Initially created for apartment complexes, SmartRent (based in Scottsdale), which offers home technology services just announced a $31 million partnership with home builder, Lennar. One of SmartRent’s features is self-guided tours which allows the perspective buyer to tour the property at any given time (scheduled a little as 1 minute ahead of time, online). The company’s website states this allows builders longer tour hours and reduces a builder’s Realtor costs.
    • Another commercial property management company, Jones Lang LaSalle, is getting into the single family rental market.

    Final Thoughts:

    Logan Mohtashami of HousingWire said, “Once schools are open again, parents will be free to re-enter the job force: By September 2022 or earlier, we should have regained all the jobs lost to COVID-19. These positive economic factors warrant higher mortgage rates as we are no longer in recession in America. Now, we want to get all the jobs back that COVID-19 took from us.”

    Please share this with your colleagues and clients.

    Copyright 2021 by Sarah Perkins

  • AZ Forbearance Update 3/10/2021

    In this 12 minute video, Lydia Wietsma and I discuss forbearance, demand, specific industries, and our one-year anniversary.

    Last week was our final week of having normal year over year comparisons. As of this week, the one year anniversary of our economy beginning to shut down, the year over year comparisons will get weird.

    What we do know is that last week purchase mortgage applications were up 7% week over week and 2% year over year. Demand remains higher than supply, both nationally and locally. I am impressed to see the application increase when rates have increased as quickly as they have. The reason for the continued demand, according to several leading economists, is based on today’s demographics. The largest group of the largest generation is about 26-34; prime home-buying age. These ‘Replacement buyers’ as some call them, will keep demand high through the end of 2024.

    We need to keep the expected, elevated demand in mind when we look at the forbearance numbers and speculate about foreclosures.

    Forbearance:

    Currently, there are about 2.6 million borrowers in forbearance or about 5.2% of loans. While this number has stayed flat over the past few months, it did decrease to a new low since the forbearance plans were introduced last March in the CARES act.

    Forbearance by Stage:

    • 14.6% of forbearance plans are in their initial stage, which is either 3 or 6 months depending on loan specifics.
    • Nearly 83% of all plans are on extension.
    • 2.6% are re-entries.

    Forbearance exits from June 1, 2020 through February 28, 2021

    • Nearly 43% of all forbearance plan exits are current on their mortgage upon plan exit.
    • 13.8% of forbearance exits, exit without a loss mitigation plan in place.

    Foreclosures:

    There is increasing talk of foreclosure challenges coming. While, yes I do expect there to be an increase in foreclosure filings, because there are virtually none now, I do not expect a huge amount of foreclosures going to auction. 90% of borrowers have equity and these homeowners will have the ability to do a normal sale and walk away with money in their pocket. We are not in the overleveraged situation we were in 12 years ago. And with the replacement buyers, there will be buyers to purchase the properties as they come on the market.

    Remember over the past 22 years, on average there are about 67,000 foreclosures a month nationwide. They are to be expected but we will not see a wave for foreclosures.

    Stimulus:

    The latest stimulus package, which is being debated in the House today, has several provisions for housing and how those provisions are implemented could impact struggling borrowers, landlords, renters, and future buyers. We will know more about the specifics very, very soon.

    Lydia did a deep dive into the travel industry and what is happening, particularly with airline employment. The newest stimulus does have more provisions that are industry-specific. The stimulus is back in the House now and once it is approved it goes to the White House for President Biden’s approval to be signed into law. It will happen soon.

    For more details on the TSA travel numbers, check out this website.

    Also, Lydia’s inspection requests have decreased. After reaching nearly 10 a day recently, they have dropped down to 1 or 2 a day. We are looking into the reasons for such a dramatic decrease and will have more info for you next week.

  • Greater Phoenix Real Estate Update 3/5/2021

    Today is all about the AZ market. Recently, Lawyers Title hosted a presentation with Tina Tamboer with the Cromford Report. She always shares pertinent and timely information. Below I have combined a lot of her information from her presentation, along with additional information from my research.

    What affects supply?

    • New Homes
    • FSBOs
    • Appreciation/Depreciation (equity)
    • Foreclosures/Household Formation (shrinking)
    • Relocation (Outbound)
    • Divorce/Illness/Death/Job Losses/Tragedy
    • Consumer Sentiment

    What affects demand?

    • Interest Rates
    • Appreciation/Depreciation (affordability)
    • Relocation (inbound)
    • Employment/Income
    • Loose/Tight Lending Practices
    • Population Growth
    • Household Formation (growing)
    • Consumer Sentiment – this could be the most important of them all.

    What affects luxury demand?

    • Stock Market Performance
    • Corporate Profits
    • Exchange Rates
    • Consumer Sentiment

    Employment:

    • Initial and continuing unemployment remains elevated but has dropped more quickly than experts initially predicted.
    • We still need to drop again by 50% in order to get to where we were a year ago.
    • The pandemic has negatively affected low-income earners and renters far more than it has homeowners, which is why despite the high levels of unemployment real estate continues to be the strongest sector in the economy.
    • Mid-level managers had the highest initial claims, according to the most recent update.

    Forbearance:

    There are people who think it will be raining homes when the forbearance period ends. This is not going to happen.

    Every 3 months we see an improvement, as more borrowers exit their forbearance plans. But the past few months have been flat. Hovering around 2.6 million borrowers in a plan.

    Foreclosures:

    What happens with the moratoriums are lifted? We will see a wave of foreclosure filings but not of short sales. After 18 months of no foreclosures, there will be a backlog. According to KCM, on average nationwide there are about 69,000 foreclosure a month, during normal times.

    When the foreclosures are filed, homeowners will likely sell as they have equity, which is why we will not see short sales. The vast majority of borrowers do not have loans greater than the value of their house. Tina expects that we will not see a lot of properties actually being foreclosed upon because the owners can easily sell.

    This will not be a big issue nor will it last very long. It is more about pent-up demand than it is about a wave of foreclosures. These homes will be absorbed quickly and will not have a negative impact on prices.

    Stock Market Performance:

    This impacts the luxury market which has been crazy busy because the stock market is doing so well.

    There was a pause in March, a dip at the election, and then a slight drop for Gamestop and now we have a nice smooth curve. Things are looking good and driving nice corporate profits.

    iBuyers are also impacted by the stock market.

    Population:

    AZ is in the top 3 states for population increase along with Texas and Florid. This shows population changes from July 2019 to July 2020.

    CA lost 70,000 residents. This is the first time it has had declines 150 years.

    LA has been the #1 spot for AZ’s inbound migration for 20 years. This chart shows where people are searching from only.

    Several moving companies share the data of the moves they service. They are all slightly different but show consistent trends. Arizona is usually in the top 5 for inbound relocations nationwide.

    This shows the most people coming here are still coming here to retire. The 55+ group got larger.

    63% of the inbound migration have an annual income of $100,000 or more.

    We are on the low side of international inbound. It is nearly all domestic migration.

    Household Formation:

    Household formation creates demand. In 2020 household formation spiked across the country. The work from home movement drove this train. Now you don’t need to live where you work so people left and got their own space. When you can live anywhere the world opens up.

    Affordability:

    The ideal range for housing affordability is 60-75. Through Q4 2020 in Phoenix someone earning the median income, they can afford 60.6% of what is for sale. In LA it is 9.1% and San Francisco it is 11%.

    Taxes:

    Why are all of the rich people coming here? It only took the threat of CA increasing the income tax from 13% to 16% to create a mass exodus. It created a wealth flight. High tax states are seeing outbound migration to lower tax states.

    Outbound states: CA, IL, NY, NJ

    Inbound: AZ, TX, FL, ID

    Business taxes, corporate taxes, individual income taxes, sales taxes, and property taxes are

    are the highest in those outbound states. AZ, while not the lowest in all of those, competes for being quite low in most of those. Sales tax tends to be the highest because it is the easiest to raise.

    Where are all of the rich people going?

    Maricopa county association of governments, shows demographics, click here for the demographics map. Density is increasing in new luxury areas. South Chandler, a lot of Gilbert, east Mesa, and South Mountain are getting bluer. Showing new emerging luxury markets.

    Job Centers:

    Jobs are created by freeways. The heavier the employment area the bluer. A lot of job growth, biomedical, and tech fueling demand, bringing in people who make a lot of money. Click here for the interactive map.

    The Cromford Market Index:

    Available on the main page of the Cromford Report: http://cromfordreport.com/ (without a subscription)

    • 100 is balanced and prices rise at the rate of inflation, below 100 is a buyer’s market, above 100 is a seller’s market, prices drop below 90, prices rise at 110.
    • On 2/5/2020 we were at 215.1
    • On 3/20/2020 we were at 241
    • On 5/15/2020 we were at 145.2
    • Yesterday we were at 513.6.
    • Prior to this run, the previous peak was 312.9 in the spring of 2005.
    • CMI is the predictor, it moves first and then appreciation follows. Cannot predict the CMI.

    At balance, or 100, values rise at the rate of inflation. We are not at balance. Demand is 18% above normal. Supply is 77% below normal.

    Demand is now dropping faster than supply. The CMI slows as demand decreases. When the index goes flat prices do not drop. Supply remains shockingly low.

    In order for prices to stop rising, the CMI has to be at 100. If it starts on the way down, prices rise more slowly. When will it go down? We can’t know that until it stops rising. In order for prices to start dropping we will have at least 8 to 10 months and that is only after the CMI stops increasing.

    What will slow it down? Affordability.

    Tina thinks we have dropped below 60, the level of demand doesn’t start dropping until we are below 60. How long will it take to get to lower demand? It could take months, who knows. Demand, once it goes to the low side of normal and then we will see supply go up.

    Property values will not go down. As long as demand is above supply, prices rise. When demand and supply come together, below balance, transaction volume declines.

    Appreciation: 

    Prices have increased 22.5% year over year, is it really a good time to buy? It is always a good time to buy in a seller’s market and it is good for sellers to sell in a seller’s market. Buying and selling in a seller’s market is winning.

    Interest rates have impacted affordability. Payments have gone up $72 for an increase buying power of $77,000.

    Rents:

    Rents are more expensive than mortgages. Rents are rising quickly. The median house rents for $250 more a month than the going rate for a mortgage for the same house.

    Rents are rising = not a bubble, rents decline due to false demand. Rents are declining in San Francisco while houses are still rising, equating to false demand. San Francisco could be considered over-valued.

    Supply:

    Supply is down 54% year over year. The end of forbearance plans (summer 2022) will have little impact in adding supply. All price points are down.

    This year is lower than last year and last year was a record. We do not have enough coming in to maintain supply.

    Population Growth and New Builds:

    We overbuilt for 10 years before we started underbuilding for another 10 years and population growth outpaced building. In 2019 we ate up the last of the glut of housing.

    Developments:

    Without new listings we have to look at new construction which is a challenge due to labor shortages and lumber prices are up 170%, adding, on average an additional $16,000 in cost to the average new build.

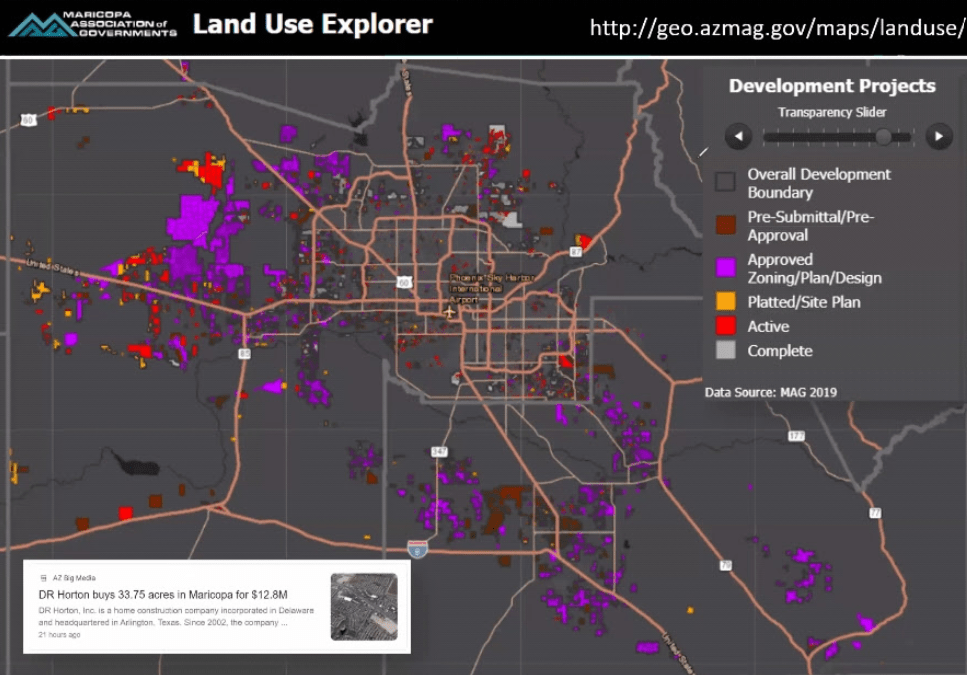
    Most developments are going into the south and west, due to cheaper available land. Very little in the north. Values are increasing the most in the north. Click here for the interactive map.

    Single Family Permits are Up!

    • Avondale at 428% year over year.
    • Coolidge at 182% year over year.
    • Glendale at 123% year over year.
    • Casa Grande at 84% year over year.

     Multi Family Permits are Up too!

    • Overall increase of 28% year over year.
    • Mostly they are not for sale, build to rent movement is huge.
    • Gilbert is up 434% year over year.
    • Mesa is up 236% year over year.
    • Chandler is up 142% year over year.

    Demand:

    • 50% of all accepted contracts were on the market for only 6 days.
    • Contract activity is booming.
    • Busiest February ever.
    • As of 2/26 there were 12,072 properties in escrow. Normal is 10,000.
    • In February, the contract ratio was 239, meaning for every 100 active listings there are 239 in escrow.
    • In 6 weeks, many areas moved from $200,000 to $300,000 for average sales prices

    Final Thoughts:

    • Supply is down 59% from last year.
    • New listings, year to date, are down 11% from last year.
    • Demand is 18% above normal.
    • Sales prices are not going to decline this year.
    • There will likely be fewer sales in 2021 than in 2020 due to the low inventory levels.
  • This Week in Greater Phoenix Real Estate 3/1/21

    In this 9 minute video, Amber Kovarik and I discuss the latest in real estate and lending.

    M & A and Industry Changes:

    There is news of new mergers and acquisitions nearly every week. Two weeks ago it was Zillow’s $500 million acquisition of ShowingTime and last week it was Redfin’s $608 million acquisition of RentPath.

    Many companies are spending big money on PropTech investments and acquisitions. Their end goal is to create the end to end platform for real estate transactions. That may look different from company to company, state to state but for real estate, the speed of new tech adoption is increasing drastically.

    Zillow announced last week that in 20 markets, including Phoenix, their Zestimate will also be their iBuyer offer from Zillow Homes, as long as the property qualifies. In order to qualify, a property must fit Zillow’s buy box which is an average sized home, around the median price, that only needs light renovations.

    Regardless of the reality of the situation, consumers will now expect, at a minimum listed Zestimate. It now seems like an initial offer and not an opinion. This is all about perception; not the reality that a property has to qualify. Because now, sellers see a clear bottom price. Why would they ever accept an offer less than the Zestimate? Yes, in today’s market, getting above the Zestimate, even above the appraised value, is not difficult. However, this too shall pass; nothing lasts forever, especially not in real estate.

    If you do not already, I highly encourage you to check out the Zestimate before going on another listing appointment. Sellers do their homework and they know that number when you arrive.

    The Zestimate live offer feature is available to qualifying homes in Phoenix and Tucson, AZ; Charlotte and Raleigh, NC; Miami, Jacksonville, Orlando and Tampa, FL; Portland, OR; Denver, Colorado Springs and Fort Collins, CO; Nashville, TN; San Diego, Los Angeles, Riverside and Sacramento, CA; Dallas, Houston and San Antonio, TX; Las Vegas, NV; Atlanta, GA; and Minneapolis, MN.

    Inventory:

    Inventory remains low. Crazy low. Demand, which has been elevated is now dropping faster than inventory. Our demand is now about 19% higher than normal and inventory is over 76% below normal. Prices continue to go up with no end in sight. The limited inventory is the cause of the decreasing number of pending listings each month. We are still running 13% above last year when we had significantly more listings available.

    Notarize:

    Notarize is offering free notarizations to update old documents, like CC&Rs, to remove racist language in an effort to fight systemic racism in real estate. Learn more here and here.

    Lending:

    Amber discusses the rise of interest rates and the reasons why. A stronger economy, lower unemployment, more confidence, the light at the end of the tunnel. There is a lot of activity and the markets are responding favorably.

    As the economy gains strength, expect the Fed to pull back on its mortgage backed securities. This is all part of the normalization of the market. The low rates were manipulated to aid the economy during the height of the pandemic but as there is improvement, the Fed will back off and rates will normalize at the levels that match the market.

    Continue setting expectations with buyers and make sure that they prepared for the day-to-day changes happening in housing and lending.

  • Greater Phoenix Real Estate Update 2/26/2021

    While real estate remains local; the big business behind it is anything but. 2021 has seen many mergers and acquisitions and we expect to see many, many more this year. The journey towards the undefined end-to-end platform continues on, gaining speed in the form of millions and billions of dollars.

    What is end to end? Is it buying a house with a click of a button? Is it bundling real estate, title, and mortgage services from one company? Is it the Zestimate value as the offer amount? Real estate isn’t a grassroots industry anymore.

    The New Zestimate:

    Zillow’s Zestimate is 15 years old and provides a valuation for about 100 million properties nationwide. In recent years Zillow has put a lot of effort into increasing the accuracy of the Zestimate. It uses tax records, machine learning, and artificial intelligence that pulls data from photos. Despite all of that Realtors could easily explain the Zestimate inaccuracy. That was until January 1, 2021. That was when Zillow Homes, the brokerage joined NAR and the local MLS’s. Now armed with an IDX feed, the accuracy improved overnight.

    Yesterday Zillow announced the follow up from a recent promise; the Zillow Zestimate (in 20 markets and on homes that quality) is now a live offer from Zillow Homes; the iBuyer. The company claims only a 1.9% error rate.

    Jeremy Wacksman, Zillow’s Chief Operations Officer said, “There’s a set of houses where we’re getting really confident because there’s a lot of houses like it, or we have a lot of data about your house. Ultimately the offer that Zillow Offers makes is intended to be the actual, precise market value of your house once you tell us more about and we come to see it.”

    The Zestimate live offer is available for qualifying homes that fall within Zillow’s “buy box” which is basically, an average-sized home, around the median price, that only needs light renovations.

    Despite the specific buy box, this impacts how all homeowners will now view the Zestimate. It now seems like an initial offer and not an opinion. For example, a CMA can say a house is worth $350,000 but Zillow just said they’d write a check for $340,000. This is all about perception; not the reality that a property has to qualify. Because now, seller’s see a clear bottom price. Why would they ever accept an offer less than the Zestimate? Yes, in today’s market, getting above the Zestimate, even above the appraised value, is not difficult. However, this too shall pass; nothing lasts forever, especially not in real estate.

    If you do not already, I highly encourage you to check out the Zestimate before going on another listing appointment. Sellers do their homework and they know that number when you arrive, so you should too.

    This impacts FSBOs. They will no longer need help pricing the property. This impacts flippers and do-it-yourself iBuyers, who often purchase for less than the major iBuyers. This impacts the major iBuyers. Redfin has a valuation option already. Opendoor will build one. Could it impact how you build a CMA or how an appraiser appraises? Likely.

    The Zestimate live offer feature is available to qualifying homes in Phoenix and Tucson, AZ; Charlotte and Raleigh, NC; Miami, Jacksonville, Orlando and Tampa, FL; Portland, OR; Denver, Colorado Springs and Fort Collins, CO; Nashville, TN; San Diego, Los Angeles, Riverside and Sacramento, CA; Dallas, Houston and San Antonio, TX; Las Vegas, NV; Atlanta, GA; and Minneapolis, MN.

    Real Estate News:

    • Notarize is offering free notarizations to update old documents, like CC&Rs, to remove racist language in an effort to fight systemic racism in real estate. Learn more here and here.
    • Redfin is getting into the rental market through its $608 million acquisition of RentPath, owner of Rent.com and ApartementGuide.com. The FTC recently rejected CoStar’s attempt to acquire RentPath.
    • On Monday, Josh Team, President of Keller Williams announced he is leaving the company. Hours later, Marc King, a 20 year KW veteran, was announced as Team’s successor.
    • From February 8 – February 14, Manhattan luxury real estate had its best week in 5 years with 38 sales over $4 million for a total volume of $351.6 million.
    • First time home buyers made up 33% of home sales in January, up from 31% in December.

    New Construction:

    • 2020 new construction sales outpaced 2019 by 18.7%.
    • January sales increased 4.3% month over month and 19.3% year over year.

    “New home sales activity started 2021 at a strong pace, with purchase mortgage applications for newly constructed homes jumping nearly 19 percent compared to last January. These results are consistent with the still-increasing pace of single-family housing starts and permitting activity reported over the last several months. The low supply of existing homes on the market, and changing household preferences toward newer, larger homes, continue to spur buyer demand.”  

    Joel Kan, MBA’s Associate Vice President of Economic and Industry Forecasting

    The AZ Market:

    Housing Policy:

    There are two major features of the latest proposed stimulus bill that impact housing. The $15,000 first time home buyer tax credit, while a definite benefit for buyers, will move demand higher eroding some of that benefit. Logan Mohtashami said, “The best economic sector in the world with rates this low doesn’t need government assistance.”

    The second, likely to have a greater impact, is the repeal of 1031 exchanges for investors making over $400,000 a year. This 100 year old tax law allows investors to exchange property and defer capital gains taxes. Surveys from NAR and Ernst & Young reveal a potential economic slowing, GDP reduction, damages small businesses, and 96% of Realtors surveyed said it would decrease both sales quantity and value.

    National Real Estate:

    “Sales easily could have been even 20% higher if there had been more inventory and more choices. Home sales continue to ascend in the first month of the year, as buyers quickly snatched up virtually every new listing coming on the market.”

    -Dr. Lawrence Yun, Chief Economist for NAR

    • Although we cannot see it or feel it; on a national level, weekly new listings are increasing. They are still being absorbed as quickly as they are listed, leaving us with a total of 336,924 active single-family listings nationwide.
    • Another way to look at the market is the rate of price increases on flipped properties. In some markets, it is upwards of 20%. Nationwide the average is 7.4%, double the average.

    Final Thoughts:

    Housing is 17% of the GDP; a massive number. The industry is changing. Yesterday, Rob Hahn wrote, “The big picture remains the same: certainty, speed, convenience. Consumers want them. We as an industry have to provide them to the best of our abilities. They want to be able to count on us like one, two, three. Provide that, and we should be able to count on them like four, three, two. Zillow has taken a step; now we see how everyone else reacts.” And it isn’t just about Zillow. This applies to everything.

    Please share this with your colleagues and clients.

    Copyright 2021 by Sarah Perkins

  • This Week in Phoenix Real Estate (video) 2/22/2021

    In this 11 minute video, Amber Kovarik and I discuss the latest in real estate, lending, and the economy. There are some major emerging trends that were predicted for 2021 and they are all happening now; only 6 weeks into the year. Rates have moved up slightly, and Amber talks about why.

    2021 Megatrends:

    Mike DelPrete said at a recent Inman presentation “The industry is moving very slowly, but it’s never moved this fast.” And he is right! At the national level, there is a lot of activity right now. We are seeing leadership changes, Josh Team announced today that he is leaving his position as the president of Keller Williams and is leaving the company entirely. Last week Redfin announced its $608 million acquisition of RentPath and Zillow made some serious waves with its recent announcement of its $500 million acquisition of ShowingTime.

    During the same presentation DelPrete discussed the 5 megatrends to watch for in 2021. Given that we are hardly 2 months into the year and his megatrends are pretty apparent.

    1. Portals are moving closer to the transaction. Zillow and Showingtime. Zillow Homes the brokerage that launched in Phoenix and other markets on January 1 are two examples.
    2. Agents as employees. Homie, Redfin, Zillow, Rex Homes all have employee agents. It is all about control.
    3. New models are here to stay, iBuyers, despite not yet being profitable are not going away. When Opendoor went public in late December they came into $1 billion cash to use to get profitable.
    4. The battle for adjacent services; while the most lucrative are title and lending; these also include moving concierge services, renovation, and inspection services. Homie has done a very good job of selling its adjacent services and quickly became a profitable startup.
    5. Asymmetric disruption: likely to be the biggest trend of the year, big outside companies entering the real estate space, funded by venture capital, meaning they do not need to make money. For example Zillow can stand to lose $600 million without losing its foothold on the industry.

    DelPrete went on to say, “That sets the trend, that’s what you’re competing against, a company that doesn’t have to make money.”

    Good Time to Buy? Yes!

    With fewer than 4400 active listings on the market, the seller’s market is intense. BUT it is still a great time to buy. Rates are still low but have started to move up slowly.

    Even with the rate increases; rates remain near all-time lows and it is a great time to buy. It is important to proactively educate your clients. They need to know what it takes to get an offer accepted in today’s environment. Buyers with loans can still have the winning offer over cash buyers when the offer is structured properly.

    Why Are Rates Going Up?

    Amber Kovarik shared, “As the markets attempt to predict when the Fed will begin to taper their stimulus, they are watching the key economic metrics of the employment rate and the inflation rate. The simple math of increasing daily vaccinations will mathematically push down the daily counts of new infections, possibly at an accelerating decline.  As this happens, businesses will re-open, jobs will come back, consumer spending will go up, vaccinated people will begin to travel and inflation rates will go up. These forces will be further supported by the largest series of economic stimulus package spending in the history of the U.S. economy. 

    As the economy recovers this will naturally push bond prices down (which causes interest rates to rise) through normal forces of supply and demand. When the inflation rate picks up, this will create further pressure to push interest rates up. The large stimulus package soon to be approved by Congress will further push down the demand and the price for bonds, and will add an increased pressure to push inflation rates higher. All of these forces combined create significant and very powerful market forces to push interest rates higher.

    Then on top of these very powerful forces above, when the Fed decides to taper their daily mortgage-backed security purchases, this will add an additional and very powerful pressure pushing down bond prices (causing higher interest rates) on top of the above normal market forces. When the Fed began buying mortgage-backed securities, this had a huge impact on prices. The reverse will happen when they exit. Nobody knows when the Fed will officially taper their purchases, but the markets know that it will happen, it is just a matter of when.”

    This chart shows the past 6 months of interest rates. The all-time low was reached on 1/4/21.

  • Greater Phoenix Real Estate Update 2/19/2021

    Low-interest rates keep housing demand high while available supply continues to dwindle. Today’s market is tough on buyers yet it is still a great time to buy; so we must continue to encourage them. And we must do the same for the sellers as well.

    Stories of 75 offers in one weekend or a fixer selling as-is for $50,000 over asking come almost daily. Real estate is not for the faint of heart nor is it boring.

    Real Estate News:

    Inventory:

    Inventory is low. Everywhere. With fewer than 2,500 active single-family homes on the market in Maricopa County, we are 77% below the average listing count over the past 4 years. This makes everyone sensitive to small changes in inventory levels.

    When big companies, like Opendoor, manipulate their own inventory levels it is important to take notice. For example, from November 10 to December 10 Opendoor did not list a single property anywhere in the country. They continued purchasing properties though. An easy assumption is that they were stock piling houses to release to the market after they went public on December 21 and to give their investors a strong Q1 2021 due to all of the closings pushed into the new year. They created a stock pile of artificial inventory.

    It was only for a short period, listings are withheld in 23 markets for 4 weeks, yet it shows how much power one company has to dictate the market. What if they hold them all for a year? What if they hold them to inflate the market? What if the other iBuyers do the same, like when Zillow and Opendoor both simultaneously decreased buyer agent commissions to 2.25% from 3% last summer?

    Opendoor is a publicly traded company. Wall Street is motivated by money. And now Opendoor has shown the ability to and willingness to, withhold listings in the tightest housing market in history. Are they still selling convenience to the consumer or doing what is best for their bottom line?

    National Real Estate:

    Typically about 25% of active listings take at least one price reduction before selling. Today that number has dropped to only 18.7%.

    Current active inventory of single family homes on the market stands at just 344,415 this week. That’s down another couple percent from last week.

    The AZ Market:

    • The median sales price is up 18% year over year.
    • Available inventory is down 61% year over year.
    • Monthly mortgage payments for the median house is roughly $150-$250 cheaper than rents for the same property.
    • 37% of closings so far in February closed for more than asking.
    • At this point in 2021, luxury sales of properties from $1M-$3M are up 102% year over year and sales over $3M are up a whopping 140% year over year.
    • Join us next Friday as Tina Tamboer does a deep dive into the AZ market. Click here for details and registration.

    Winning Phoenix:

    Greater Phoenix is highly desirable and still considered affordable. An estimated 83,000 new residents moved here in 2020 and with it, they brought bigger budgets. Local buyers’ budgets averaged $509,000 while new buyers coming from out of state had an average budget of $627,000; 23% higher!

    In a recent Zillow survey, Phoenix ranks second in 2021’s hottest market. The Sunbelt is leading the housing pack.

    Phoenix ranks #7 in the Milken Institute Best-Performing Cities Index. According to the ranking, in 2020 San Francisco ranked #1 and this year it did not even make the list. To quote directly from the index:

    “For years, Phoenix has been topping lists of the most rapidly expanding cities in the country — jobs grew 17.6 percent between 2014 and 2019 while wages increased by 34.2 percent in the same period. 

    Although home values are responding to the economic boom and spiking accordingly, the city continues to attract a healthy balance of economic power players and people looking for a more affordable place to make a start in life.

    ‘The metro continues to grow at unprecedented rates, including top-tier one-year job (sixth) and wage growth (15th),” reads the report. “Phoenix also improved five ranks in high-tech GDP concentration (47th), while its seven high-tech industries land it at 37th, highlighting a deepening high-tech economy.’”

    New Construction:

    Continues to be plagued by high materials costs, especially for lumber which increased over 150% last summer, then dropped and increased again, due to supply chain shortages, massive fires, labor shortages, closed mills, COVID, and larger homes under construction.

    “While the market remains solid, median home prices are increasing due to higher building material costs, most notably softwood lumber, and a shift to larger homes.”

    Robert Dietz, chief economist for the National Association of Home Builders

    Forbearance:

    The latest forbearance numbers show improvement. The total number of loans in a forbearance program is around 5.29% or about 2.6 million, a decrease of about 100,000 in the last 2 weeks.

    The foreclosure, forbearance, and eviction moratorium have all been extended through June 30, 2021.

    Forbearance Exits from June 1, 2020 – February 7, 2021:

    • 43.6% of forbearance exits are paid up and current.
    • The number to watch remains at 13.8% of forbearance exits are doing so without a loss mitigation plan in place.
    • This means that if all 2.6 million borrowers exited their forbearance plan today, about 348,000 would leave with no plan in place.

    For more details see my recent AZ Forbearance Update from Wednesday.

    Delinquencies:

    In Q4 2020 the mortgage delinquency rate, which includes those in forbearance who are behind, was 6.73%, a 0.92% decrease from Q3 2020 but still nearly 3% above this time last year. This nearly 1% quarterly drop is the biggest decrease since the Mortgage Bankers Association started tracking this data in 1979.

    The 30-day lates reached their lowest since tracking began in 1979, while both 60 and 90 days lates also decreased. 90+ day lates remain the largest delinquent group at just above 5% of all mortgages.

    Total mortgage delinquencies across the three loan types – conventional, FHA, and VA – and across the major stages of delinquency – 30-day, 60-day, and 90-day – declined from last year’s third quarter.

    3D Printed House:

    The nation’s first 3D printed house hit the market in Riverhead, New York with an asking price of $299,999. It is 1,500 square feet and made out of concrete.

    Final Thoughts:

    Supply and demand are the foundation of economics. Real estate is no different. In order for something to change either demand will subside or supply will increase. When that happens it doesn’t mean that our market will crash or values will go down, it means that appreciation will slow to a rate more favorable to buyers and sellers will have to negotiate.

    Only then can we get out of what Mark Fleming with First American so gracefully explained, “This is what we call the homeowner prisoner’s dilemma. There’s nothing to buy because nobody is selling, but nobody is selling because there’s nothing to buy.”

    Please share this with your colleagues and clients.

    Copyright 2021 by Sarah Perkins

  • AZ Forbearance Update 2/17/2021

    AZ Forbearance Update 2/17/2021

    In this 16 minute video, Lydia Wiestma and I discuss the latest in forbearance, delinquencies, extensions, and inventory.

    We do these videos to share the real information with real estate professionals and consumers about what is going on in this sector of real estate. There is a lot of fear behind forbearance and the moratoriums, and bad advice being given. While there is no reason to panic, it is important to be informed.

    CFPB & Servicers:

    As we discussed recently, the CFPB is breathing down the necks of the loan servicers and they know in order not to be fined, they have to follow all of the rules by the book. That is a good thing for struggling borrowers. The days of the lax info on forbearance from the servicers are numbered. The one piece of advice I would give any borrower when they call their servicer, get everything discussed in writing. Track and document EVERYTHING.

    Forbearance Numbers:

    The latest forbearance numbers show improvement. The total number of loans in a forbearance program is around 5.29% or about 2.6 million, a decrease of about 100,000 in the last 2 weeks.

    Mike Fratantoni with the Mortgage Bankers Association said, “2.6 million homeowners remain in forbearance plans. MBA expects the rollout of the vaccines to boost economic growth through the course of the year, leading to a stronger job market and a greater ability for more struggling homeowners to get back on their feet. We do believe that additional support is needed until they have regained their jobs and incomes.”

    Forbearance by Stage:

    • The initial stage decreased to 16.07%
    • Extensions increased to 81.42%
    • Re-entries decreased to 2.52%

    Forbearance Exits from June 1, 2020 – February 7, 2021:

    • 43.6% of forbearance exits are paid up and current.
    • The number to watch remains at 13.8% of forbearance exits are doing so without a loss mitigation plan in place.
    • This means that if all 2.6 million borrowers exited their forbearance plan today, about 348,000 would leave with no plan in place.

    Delinquencies:

    In Q4 2020 the mortgage delinquency rate, which includes those in forbearance who are behind, was 6.73%, a 0.92% decrease from Q3 2020 but still nearly 3% above this time last year. This nearly 1% quarterly drop is the biggest decrease since the Mortgage Bankers Association started tracking this data in 1979.

    The 30 day lates reached their lowest since tracking began in 1979, while both 60 and 90 days lates also decreased. 90+ day lates remain the largest delinquent group at just above 5% of all mortgages.

    Total mortgage delinquencies across the three loan types – conventional, FHA, and VA – and across the major stages of delinquency – 30-day, 60-day, and 90-day – declined from last year’s third quarter.

    Timeline Changes:

    The foreclosure, forbearance, and eviction moratorium have all been extended through June 30, 2021

    • Extend the foreclosure moratorium for homeowners through June 30, 2021
    • Extend the mortgage payment forbearance enrollment window until June 30, 2021, for borrowers who wish to request forbearance
    • Provide up to six months of additional mortgage payment forbearance, in three-month increments, for borrowers who entered forbearance on or before June 30, 2020.

    Final Thoughts:

    The longer they push the can down the road, the less equity these homeowners will have to work with. The one saving grace for them is the huge amount of appreciation we are currently experiencing. With inventory levels where they are today, many expect prices to continue to increase at rapid levels.

  • Greater Phoenix Real Estate Update 2/12/2021

    I was recently interviewed for an Inman article that came out earlier this week. I was one of 5 contributors discussing the challenges of differentiation for traditional brokerages. Click here for the article.

    Real estate is dominating many headlines; from the low-interest rates, low inventory, high demand, big news at Zillow, another commission lawsuit, national policy changes, to CFPB leadership changes there is a lot going on!

    National Real Estate:

    “Pending home sales contracts have dipped during recent months, but I would attribute that to having too few homes for sale. There is a high demand for housing and a great number of would-be buyers, and therefore sales should rise with more new listings.”

    Dr. Lawrence Yun, Chief Economist for NAR
    • According to Ivy Zelman of Zelman and Associates the size of the market will depend on the number of listings coming to market, not the size of the inventory. The job is to bring more listings to market, not to focus on the size of the inventory, which is tough to do.
    • Inventory is in crisis, there are only 354,900 active single-family residences on the market nationwide. 50,000 new listings went straight under contract, only listed as active for hours, and therefore never make it into active inventory counts. We have less than half of the inventory we had a year ago and it was crazy low then. No real end in sight right now. Prices continue moving up again this week.

    The AZ Market:

    Elliott Pollack’s Monday Morning Quarterback covered our market in great detail, this is what he wrote:

    “Locally, all eyes are on the housing market. Month after month, numbers being reported in the resale market are reminiscent of the housing bubble in 2005. There is a record low number of listings. According to The Cromford Report, as of February 1st, only 5,180 homes were for sale, a 56.7% decline from last February and a 14.5% decline from just last month. This equates to a 15-day supply of homes. In a normal market, you would expect about a two-and-a-half-month supply. The squeeze becomes much worse when you remove the luxury segment of the market. There is only a 10.4-day supply for homes under $500,000 and only an 8.5-day supply for homes under $350,000. 

    This means that it is very difficult to find a home to buy and that prices are increasing rapidly. Indeed, the median resale home price at the end of January was 20% higher than just one year ago ($342,000 vs. $285,000). And rapid price appreciation will continue in 2021 until more supply is made available. 

    This should all bode well for the new home market, which has seen a much more sustainable rate of price appreciation. According to Information Market, over the last 12 months, median new home prices have increased 4.5%. This has caused the gap in pricing between new homes and resale homes to shrink dramatically and will help the sales volume increase among new home subdivisions. In January 2020, there was a 22% premium comparing new home prices to resale home prices. Now, there is only an 11% premium. 

    As a result of both lack of supply and the rapid price appreciation of existing homes, people have been drawn to the new home market. And homebuilders have been responding. According to RL Brown, new home permits increased over 21% in 2020 to nearly 29,000 permits. We expect permits to surpass the 30,000-permit mark this year, which will break a 13-year streak of less than 30,000 permits.

    And that has been the difference between what is happening now and what occurred between 2005 and 2007. We are severely undersupplied in both existing homes and new homes. We are not building excess inventory and we have completely absorbed all of the excess that was previously built. This is not a bubble that will come crashing down. But, though we are currently still one of the most affordable major markets out there, a rapid decline in affordability could cause its own issues. Overall, however, the new home market should continue to do extraordinarily well for the foreseeable future.”

    Zillow:

    Headlines can be very misleading, like “Zillow Homes makes $27 million in profit in Q4 2020 and making an average of nearly $23,000 per home the iBuyer sold.” That is only true when they do not include all of the costs of running a business, paying employees, marketing, technology, and even paying interest on loans. When all costs are considered, both Zillow Homes and Opendoor lost $300 million in 2020. Zillow’s actual return on it’s iBuyer properties is negative $72,000 PER HOUSE. Opendoor’s figures show an $11,000 per home gain in 2020. The $105 million paid in interest was omitted when running those numbers.

    Despite the claims of transparency, many numbers are hidden and the whole story is not provided. Unfortunately for the rest of us in the industry, these companies manage to lose money each year yet keep their investors/shareholders happy. Wall Street plays by different rules. Mike DelPrete explains further here.

    There is one headline that is getting a lot of attention right now. “Zillow buys ShowingTime for $500 million.” Brad Inman wrote an article about why we shouldn’t worry about Zillow trying to take all of ShowingTime’s data. He is right, Zillow has more than enough data with 2.2 billion visitors to the site in Q4 2020 alone. While ShowingTime provides market stats for nearly 1 million Realtors, Zillow provided data for 9.6 billion users in 2020.

    Based on history though, Zillow may have other plans for ShowingTime.

    Nearly three years ago Mike DelPrete wrote about Zillow’s move as an advertising company, far from the real estate transaction, towards the transaction and encompassing more of the transaction.

    While Errol Samuelson, chief industry development officer for Zillow noted that “ShowingTime will remain an open platform available to all industry participants.” He also said Zillow is not in the leads business but in the “transaction generation” business. That was what the acquisition of ShowingTime is all about.

    Given Zillow’s huge push with Zillow Homes, its agent-employee brokerage which went active on January 1, does he mean iBuyer transaction generation? Further statements also mention increasing transactions for Premier Agents and also generating more transactions in general.

    I am less concerned about data, Zillow has plenty, but this does give Zillow even more control. Six years ago Zillow said it would not open a brokerage; it may indeed keep ShowingTime available for everyone, for now. Rich Barton is smart and Zillow knows how to make money; they are willing to take risks. I expect to see more acquisitions in the near future.

    IDX and Zillow:

    • Zillow is now an MLS and NAR member, therefore, has an IDX feed to all listings. This increases the accuracy of Zillow’s Zestimate and listing information. You can no longer write off Zillow info as bad data, it isn’t anymore.
    • Since it is using an IDX feed there is no way to opt not to syndicate your listings to Zillow. If you do not want your listings on Zillow, you must opt-out of IDX as a whole so the listings will not appear on personal websites or any other listing platform.

    Commission Lawsuit #4:

    • A fourth class-action lawsuit claiming that the MLS commission sharing practices violate antitrust laws was filed at the end of January, although this one claims that the price-fixing burdens the buyer who comes in with the funds versus the seller who pays out of the proceeds.
    • The bottom line is that the plaintiffs in all four suits want to have homebuyers pay their Realtor directly, rather than have listing agents share the commissions with the buyer agents.
    • Many people fear that this would completely upend the real estate industry. But think about companies like Rex Homes that are already doing this; Rex charges a 2% commission total: 1% goes to Rex and 1% to the listing agent and they are not members of NAR or the MLS. We have closed transactions with them; the buyer’s agent has a buyer broker agreement and the buyer has paid their agent’s commission.

    Lending:

    Final Thoughts:

    These past few years, especially 2020, taught us that real estate can pivot much more quickly than we ever had to in the past. We are up for the challenges of the changing times.

    Please share this with your colleagues and clients.

    Copyright 2021 by Sarah Perkins