Category: AZ Real Estate

  • Housing Affordability (video)

    Lydia Wietsma with Revelation Real Estate invited me to join her on her regular podcast to discuss housing affordability and what is going on with all of the incredible appreciation we are experiencing. Check out our 30 minute discussion.

    Key Takeaways:

    In order to understand affordability, we have to look at what is happening across the country and locally. Affordability is measured nationally but felt locally. Here in Arizona, we are in a very strong seller’s market.

    • AZ is a top destination
    • 250-300 new residents a day moving to Phoenix metro area
    • Majority of people coming to greater Phoenix Metro area are leaving southern California, mostly Los Angeles County and San Diego County. People are leaving NYC, Chicago, Southern CA, Seattle for cheaper living and sunshine.
    • Over 50% of the people moving here are over 55
    • People moving here can afford more expensive homes
    • 52% of incoming people make over $100K a year

    Arizona is running advertising campaigns inviting more and more people to leave the west coast for Arizona and it is working. Our job growth is nearly 2.5 times the rest of the country over the past 20 years.

    The demand is pushing sales prices up. After the 15 year roller coaster we have been on, many homeowners are not sure about selling right away. The average homeowner stays in their house about 7-8 years. It has increased. As people stay, inventory is locked up. We have incredibly low inventory right now. We have the same amount of homes from sale today as we did in early 2005, when we had half the population and half the housing stock. For Phoenix to be a healthy market with inventory to supply the consumers needs we would need 3x the amount of listings that we have today. With inventory this low, it would not be outrageous to believe we will have a 10% appreciation in 2020. Places like Chandler and Gilbert have seen a 50% appreciation over the past 3 years. This is putting our affordability in the spot light. Not only do we have people moving here, we have a severe shortage of single family  new home building. We have hardly surpassed where we were in the early 90s. Nationally we are being by 5 million new homes based on population growth and demand. This lack of building continues to push property values up, across the country and very much so here in Phoenix. The Arizona real estate market tends to run 8-12 months ahead of the rest of the country. Whatever is happening elsewhere already happened here.

    When people cannot afford to buy homes or to move up when they need a bigger home, we run into some big problems. One of the coolest things about home ownership is the path to wealth. Nothing creates wealth the way home ownership does.

    If our home ownership rates continue dropping as they have over the past 10 years, we have the potential of causing some massive changes to the US economy. The national homeownership rate is around 63%. It is a tough number to move because they are so many Americans. However, when you look at that number, a couple drops puts us close to the 50% mark. When we as a country hit 50% home ownership rates then it is likely that some of the extra perks of home ownership could go away. When you have a country that is made up of 50% renters, which means the voters will be 50% renters and likely many of the congressman will be renters. This could affect new policy and adjustments of current policy benefiting home ownership. As homeowners we love having our values rise but in order for real estate to continue to be 13% of GDP, we need to make it an option for renters to become home owners, and affordability is the biggest hurdle.

    If a renter expects to stay in the same place for 3-5 years, it is in their best interest to buy. Even if they have to pay a little more than what they could spend on a renting, they will come out ahead. Using the example below, if a renter pays about $200 more per month to buy the median home today in Maricopa County, without any increase in value, after 5 years the owner will have $40,000 in equity, and that is based on 0 appreciation. If there is modest appreciation, like 2%, after 5 years that same home owner now has $70,000 in equity!

    copyright 2020 by Sarah Perkins

  • Halloween & Tight Inventory

    Halloween & Tight Inventory

    Tight inventory in the Phoenix metro real estate market continues.

    We typically see a slow down in residential real estate this time of year. This is not only true in the Phoenix metro market but across the country. We have seen a slight increase in listings but not enough to balance out the demand. Tina Tamboer with the Cromford Report states that a market frenzy takes place when more listings go pending then go active. On Tuesday 10/30/19, in the southeast valley, there were only 66 new listings and 90 went pending. Only looking at a one day snapshot doesn’t show the whole story. The day of the week matters. Mondays and Tuesdays we see more properties go pending and Thursday and Friday we see more properties hitting the market. As it stands, looking at a full week, though, Friday 10/25/19 through yesterday, Thursday 10/31/19 we had 598 new listings with 638 going pending in the same time period. These numbers are for the southeast valley. We can clearly see that pendings are outpacing new listings. This will continue pushing up prices and making things a bit tougher for buyers, particularly those looking under $350,000.

  • Jaded: A Real Estate Story

    Jaded: A Real Estate Story

    As I fly home after a trip to see the in-laws in Iowa, I think about real estate. I suppose I always think about real estate, but that is besides the point. I hope that my sister-in-law’s house sale in New Jersey goes through sometime soon.

    My entire real estate experience is in Arizona. I am so grateful for how we do real estate in AZ because it is so much more efficient than it is just about anywhere else. In NJ they have 2 attorneys, one for the buyer and one for the seller, they have two Realtors, each for the same party, and they have the title company. No wonder she is so confused. There is always a delay in any request and at any given time she has no idea what is happening with the sale. In Arizona transactions everyone has options. I told her that either side can push the transaction forward or cancel for breach of contract.

    In Arizona, we do not have attorneys working on the files. We have two Realtors and one escrow officer (who also takes care of title). Things so much more efficient and, sure, there can be delays, but at least there is communication. In Arizona, the escrow officer is a non-biased third party who works for both the buyer and seller and executives the fully ratified contract. Realtors in Arizona are part of the entire transaction from start to finish. They walk their sellers through the listing process, negotiate the contract, and guide them through the escrow process.

    Hearing about my sister-in-law’s experience makes me truly understand the significance of the current law suit(s) and the 4 year old NAR Danger Report. The Danger Report, commissioned by the National Association of Realtors (NAR), is found here: https://www.dangerreport.com/usa/, outlines the biggest dangers facing the residential real estate industry. The #1 biggest danger is bad Realtors. Sure, there are sub-par “professionals” in every industry and weeding them out is a good thing. However, a job description as well known as “Realtor” comes with some expectations.

    In Arizona the extent of a Realtor’s role is very different than that in New Jersey. As I listened to her ordeal, I thought to myself, “if your transaction was taking place in Arizona, you wouldn’t be facing any of this.” We are days past her contracted closing date and she has no idea why it hasn’t closed. Her Realtor doesn’t know anything, her attorney doesn’t know anything. All she knows is that she moved into her new rental and is still on the hook for her house for who knows how long. I would like to guide her through the process, just to make her feel better but I cannot.

    As an outsider, all I can do is be thankful that I live and work in Arizona where the process makes sense. The commissions earned are just that, earned. The lawsuits shaking up the industry make more sense in other states. The most complicated part of a residential property transaction is the escrow period. Professional Realtors who guide their clients through the ENTIRE process very important. No matter what direction our industry goes in the coming years, we all need advisers to guide us through it.

    I hope my sister-in-law’s sale closes soon. Then she, her husband and daughters can move on. Hopefully they are not too jaded to refrain from once again becoming home owners.

  • Real Estate Market Update

    Real Estate Market Update

    Tina Tamboer, with the Cromford Report, recently presented on the residential real estate market in the Phoenix metro area.
    To subscribe to the Cromford Report, click here: http://cromfordreport.com/join-armls.html. The complete presentation is available to subscribers.
    Here are my notes:
    Forget everything that Tina said at the beginning of 2019, even forget what she said last quarter. Everything is different. Again.
    Cromford Market Index (CMI):

    • 100 is balanced, above 100 is a seller’s market, under 100 is a buyer’s market
    • Cromford Market Index 184.2 (strong seller’s market)
    • Supply 57.2 and dropping
    • Demand index 105.3
    • Every week the CMI has increased significantly
    • we are higher than we were last year
    • CMI hasn’t been this high since 2004
    • Currently tracking 2004 demand

    From February through June of 2019, we went from the weakest seller’s market in 5 years to the strongest seller’s market in 14 years! This happened in a span of 5 months (long term chart)!!
    2005 PTSD?

    • Despite the numbers tracking close to 2005, our market today is very different than in 2005
    • We have real demand today
    • 2005 was false demand
    • we have today something we didn’t have in 2005, skepticism. We are not there now
    • We are not in bubble range but are watching it closely

    Supply & Demand

    • When supply and demand move together, everything is great
    • When they move together above CMI of 100, there are lots of listings, lots of sales
    • When supply and demand move apart, things go crazy, everything becomes unstable
    • February 2019 supply and demand broke up, despite expectations of a flat, calm, easy market
    • 2004 saw higher transaction volume than today due to our low inventory
    • Prices will continue to rise as long as supply and demand move apart
    • Prices are expected to continue to rise through 2019 and into 2020

    Appreciation

    • We are not in a bubble but we are a bit high for regular appreciation
    • We moved above the regular appreciation level at the beginning of 2019
    • Properties asking $150-225K have the highest appreciation rate
    • Properties asking over $500K, 1-3% appreciation rate (balanced market, equals rate of inflation)
    • Properties asking $225-500K, 3-5% appreciation rate (above rate of inflation, seller’s market but not huge gains)
    • Properties asking $150-225K, 6-10% appreciation rate (lots of fix and flip investors, area with the most appreciation)
    • Properties asking under $150K, 2-5% appreciation rate
    • first half of 2019 was tracking behind 2018 for amount in escrow
    • turned in February, we are now tracking above 2018
    • tracking volume of 2017 but with higher price points
    • seasonally between May and December, we have a 30% drop of quantity of properties in escrow
    • best time to buy is the 2nd half of the year, the very best is the 4th quarter, buyers do not give up on the market, this is true for all price points

    What Effects demand?

    • interest rates
    • 2011-2014, 45% of purchases were for cash
    • mortgage rates have dropped, again
    • when rates went up slightly in March, buyers got off the fence. People thought rates hit the bottom.
    • appreciation/depreciation (affordability)
    • affordability index tracks affordability with the changes in wages
    • recent wage increases have put Phoenix back to being affordable
    • 2004 we were affordable, 2005 with a 45% increase we were no longer affordable
    • relocation (inbound)
    • employment/income
    • 2.2M people employed, largest it has ever been
    • Phoenix job growth is outpacing the rest of the country, by increasing 2-3%, nationally it is around 1%
    • 3 continuous months of wage increases (April, May, June)
    • click here for the interactive job-center map on the Maricopa County Association of Governments website: https://geo.azmag.gov/maps/azemployment/
    • loose/tight lending practices
    • population growth
    • tons of inbound relocation
    • Largest group is from southern California
    • #1 source of incoming people LA county
    • #2 San Diego county
    • #3 Chicago
    • Here is the map of to see where people are coming from: https://flowsmapper.geo.census.gov/map.html
    • cost to rent vs buy
    • people will rent when it makes more financial sense to do so
    • 2018 prices are up 8.1%, so far in 2019 prices are up 6.5%
    • people are thinking it is easier for them to rent
    • cost of sfr rent has increased 7.1%/ patio homes rent increased 7.8%
    • median rental $1700 monthly for 1802 square feet
    • Tina used the Zillow calculations to estimate equity over 5 years (60 months)
    • Using the median sales price of $288,000 for a 1805 square foot single family residence, here is the calculator: https://www.zillow.com/mortgage-calculator/ (schedule from Zillow, click full report, go to month 60)
    • If purchased for $246,452; after 5 years with no appreciation owners now have $41,500 in equity
    • Based on the current rate of inflation, with 5 years of payments adds $71,500 in equity
    • 2005 purchase prices increased, rent prices did not, sign of false demand
    • Today rents and purchase prices are rising, sign of true demand
    • consumer sentiment (how you feel about the market, which could trump everything else)
    • we are at historically low rates and everyone is getting raises
    • consumer sentiment is going up when people get raises
    • now people have moreconfidence and feel better about buying

    Fix & Flips

    • Biggest gains ($60,000 or 60% margins) in areas with cheap houses with up and coming employment centers
    • See https://geo.azmag.gov/maps/azemployment/
    • Luxury flippers are making up to 60% in Scottsdale on houses over $500,000
    • Headlines define flips as: a property purchased and sold within 2 years
    • 2013 was the biggest year for flippers
    • Flippers love sellers markets and retreat in balanced or buyers markets
    • iBuyers are doing most of their business between $200K-$250K
    • iBuyer purchases are considered a FSBO, which is $127 per square foot for $200K-$250K
    • iBuyer sells, on average, 7% more than the contract price. average on mls sales 9% increase between $200K-$250K

    What Effects Supply?

    • new home construction
    • appreciation/depreciation (equity)
    • foreclosures
    • relocation (outbound)
    • divorce/illness/death/job losses/tragedy
    • cost to renovate vs move up
    • consumer sentiment (feeling)

    Supply

    • 2019 brand new listings June-July 10.7% lower than in 2018. This is the first time this has happened since 2001
    • we had roughly half the number of employed people and half the number of houses in 2001
    • people don’t want to move
    • when we have sellers turning and buying again, then it is a wash on supply
    • 2010 lots of outbound relocation, loss of employment
    • 2014 was the year for Canadian buyers due to beneficial exchange rates
    • supply is plummeting, we are down 10.9% in supply, southeast valley 9.7% down inventory
    • new home construction eases up options but not a lot
    • properties over $2M inventory is up over 13%

    Prices

    • SE valley average sold price is between $100-400K
    • South Tempe is the only place in the SE Valley with an average over $500K
    • seller asking price is up 6.8% from year over year
    • Pendings are up 12% through July year over year
    • SE valley pendings are up 16% year over year
    • decline in offering closing costs
    • Q3 2015 27.9% of closings included seller concessions
    • today it is way lower
    • 30-40% of sales $150-250K have some sort of closing costs
    • 24-28% of those houses are selling over asking (making up the concessions paid)
    • outskirts of town sellers can negotiate more
    • Tina suggests checking out renovation loans
    • 19% sold over list price July 2019
    • correlates with June 2004
    • in May 2005 it was 38%

    Short Term Rentals

    • Are today’s false demand
    • AZ recently adjusted the regulation to not regulate. now you get a tax id.
    • PV & Sedona started the regulation movement
    • #1 risk of airbnb: everything is wonderful all the time
    • #2. we don’t know if this is the beginning of regulation. will taxes go up?

    Final Thoughts

    • interest rates dropped and everyone got a raise
    • Our market is still considered affordable
    • there is no end in sight for this seller’s market
    • prices have not come down and they are not projected to come down anytime soon. definitely not this year.
    • Next predicted recession is in 2020, will it effect real estate?
    • first thing to drop is tourism during a recession, will make an impact on Airbnb
    • 10% drop is the new definition of a crash. Always ask how a “market crash” is defined when people talk about a crash. Many of us think of the 50-60% days.
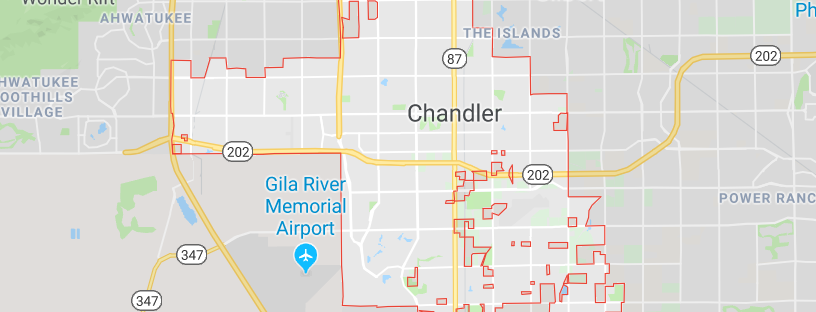
  • Chandler Update with Micah Miranda & Councilman Stewart

    Chandler Update with Micah Miranda & Councilman Stewart

    • Priorities
      • Fiscal Responsibility: AAA rating. lowest cost per service.
      • Water preservation & conservation: 100 years of water, they have made lots of arrangements. they do this for each project they do. They get it from the ground water from Gila reservation
      • Transportation
      • Infrastructure
      • Safe neighborhoods
      • Responsible development
    • Chandler Police Chief just won Police Chief of the year for entire USA
      • 2018 lowest crime rate since 1986
    • National awards
    • AAA bond ratings which helps get loans without having to raise taxes.
    • Huge population growth
      • Fewer multifamily projects in 2019 than 2018 Increased single family projects in 2019 Majority of growth is in southeast Chandler
    • Housing
      • 106,688 total housing units
      • 73.5% single family homes
      • 26.5% multi-family homes
      • 141 new houses added a month, on average
    • K-12 Education
      • Chandler Unified School District (CUSD) just won #1 school district in AZ (niche.com) vision 2030 is to be the #1 school district in USA voters approve school spending nearly 100% of the time
    • Currently modernizing Chandler Municipal airport, moving towards jets to accommodate business travelers and making it quieter. The hobby prop planes are louder.
    • Employment
      • economic development is all about bringing in more bodies
      • Existing employers
      • New businesses
      • New Banner hospital coming soon to 202 and Alma School
      • working to build a bigger variety of employment, not just semiconductors
    • Recently won best economic development department in AZ
    • Mica Miranda, head of the department, travels to businesses across the country to recruit to Chandler
    • Chandler is competing with Dallas, Tampa, Austin for businesses
    • By bringing in more businesses and jobs, taxes are subsidized so increases are not needed to support growing population
      • Price Corridor job creation zone Airport job creation zone
    • Commercial building fill rate/vacancy rate (page 17)
      • office 14% flex 7% industrial 5% retail all time low
    • Downtown Updates
    • Park Updates
      • 67 completed parks
      • 3 planned parks
      • 1200 acres of park space
      • talking about youth sports tourism (not a money maker but people want them)
      • adding to tumbleweed, move that towards a more competitive sports complex
      • also working with the schools to use their fields. adding more lights to tumbleweed
    • Lots of events to unify all of the different aspects of Chandler
    • Festivals to connect the old and the new
    • Follow City of Chandler on LinkedIn and Facebook to see updates
    • Sign Up for Chandler’s newsletter at https://www.visitchandler.com/about-chandler/enwsletter/