Category: Weekly Market Update

  • Greater Phoenix Real Estate Update 5/14/2021

    Once again, today is all about the AZ market. On Wednesday, Lawyers Title hosted a presentation with Tina Tamboer with the Cromford Report. She always shares pertinent and timely information. Below I have combined a lot of her information from her presentation, along with additional information from my research.

    Inflation:

    According to Reuters, consumer price inflation increased by 0.8% from March to April, the largest increase since June 2009. It increased by 4.2% year over year, the highest since September of 2008. Experts blame supply chain challenges and last spring’s weak readings. Many economists believe has taken the brunt of inflation already. Consumers call it appreciation and economists call it inflation.

    Why Do We Have a Housing Shortage?

    From 2000 to 2009 we over-built for the population. From 2010-2020 we under-built for the population. In 2004-2006, speculation building on credit caused huge problems. When the lending dried up, we had huge price declines. This is not a gap that can be closed easily.

    Housing unit counts will be released at the end of May.

     New Construction:

    Material prices are going up. Lumber has increased the most at roughly 430% year over year. Eye On Housing is a great blog with lots of information. The increased cost of materials for the average new home is nearly $36,000. Condos are up $1,300. Apartments are up $119 a month. Builders pass the costs to the consumers. Builders are begging appraisers to take into consideration the increased material when appraising. If an appraisal doesn’t come in at contract then the builders will struggle to sell.

    Personal income growth soared in 2020. People did not take fancy vacations, spent less on gas, spent less on eating out, etc. This helps offset the rise in prices.

    Single-family permits through March are up 26.7%, year over year. We are at elevated levels. People are afraid of all the building. We haven’t seen this many permits since 2006. The builders may not build all the houses they have permits for.

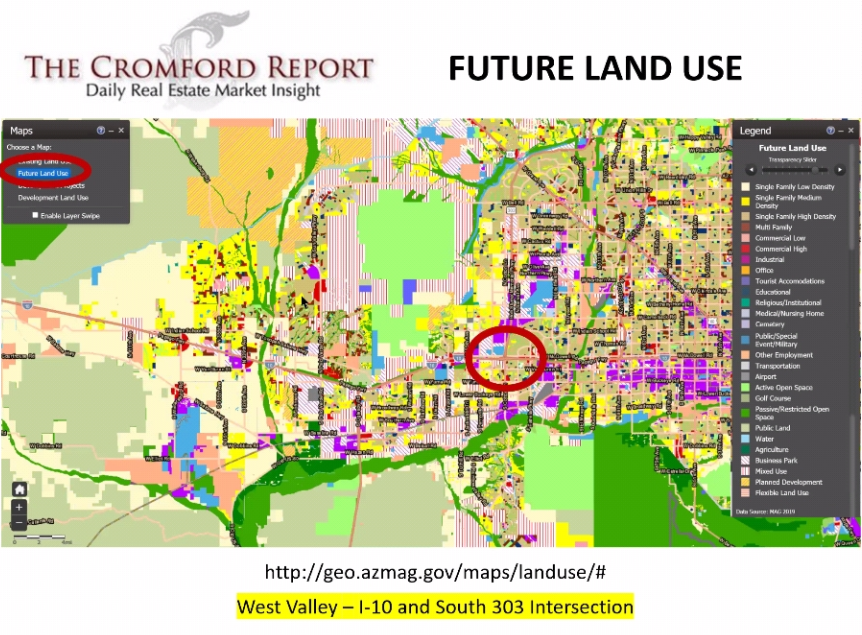
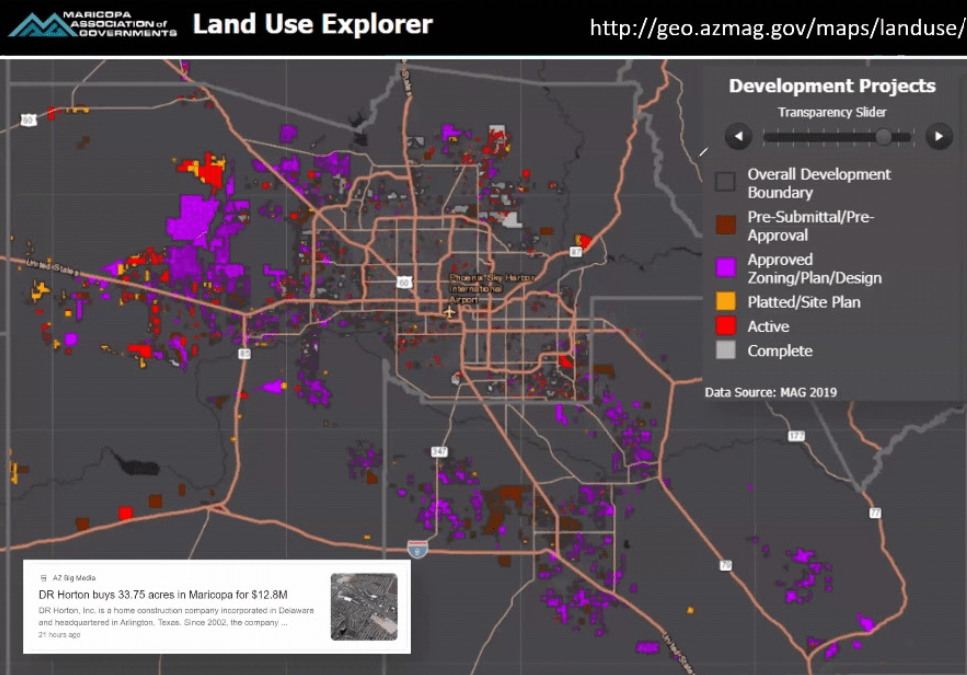
    To see the existing and future planned developments visit http://geo.azmag.gov/maps/landuse/

    Blue is vacant land, which there is a lot of in the northwest valley by the I-17 and 303. The future land use shows upcoming development. A lot is going in around the Taiwan Semiconductor Manufacturing Company.

    Yellow is SFR. High density is tan. Pale yellow is low density, yellow is medium density. Affordable housing to come in the NW valley also. Green is agricultural land, light green is passive land use. Tons of SFR building on the west side. Lots of industrial, which brings lots of jobs.

    Many people are worried about water. The future plans show development in place of agriculture. Agriculture uses far more water than developments do.

    DR Horton is buying large quantities of land as far south as Eloy and that huge Superstition Vistas area just south of Apache Junction.

    Employment:

    US unemployment rate: 6.1%

    AZ unemployment rate: 6.7%

    The labor force increased. Our base has recovered for people who are already working. The numbers don’t look great but we are improving. A lot of service sector jobs are coming back and restaurants and hotels are hiring.

    • Month over month, Arizona nonfarm employment increased by 16,000 jobs.
      • Nine of the eleven major sectors gained jobs.
    • Year over year, Arizona nonfarm employment declined by 2.9%, while US nonfarm employment declined by 4.4% YoY.
    • Year over year, ten major sectors lost jobs; one major sector gained jobs.
    • The Arizona unemployment rate decreased to 6.7% in March 2021 from 6.9% in February 2021.
    • Month over month, the Arizona labor force increased by 6,749 individuals
    • As of March 2021, the Arizona labor force is larger than it was prior to the COVID-19 pandemic.

    Population:

    US population grew by 0.4% we grew by 1.8%. Losing population slows housing growth because fewer people are in houses and buying houses. Our growth came from domestic migration with the largest populations coming from CA, IL, WA.

    Forbearance:

    When forbearance ends it will not rain houses.  There are about 2.2 million mortgages or about 4.2% in an active forbearance plan. There have been huge improvements in forbearance counts. 54% have successfully exited the plan. If all states are equal, each would have about 46,000 properties in forbearance.

    Lots of people are exiting and are current, about 47% are ok. The struggling amount is about 16.4% and that leaves us 7,128 new listings for all of them if they are all struggling and need to sell right away. That is not enough to cause a problem.

    Greater Phoenix economic council has diversified employment over the past 10 years. NV, TX, LA, FL, NJ are going to have more issues with forbearance exits because of the business. We will probably not even have as many as 7,000.

    For more information on forbearance, check out my latest AZ Forbearance Update, here. Properties that are late and in forbearance are still counted in the delinquency numbers. For more info on delinquencies, check out my AZ Forbearance Update from the end of April, here.

    Inflation:

    Overall including gas is 2.6%. (April came out Wednesday) People are stressed, gas has seen an impact. The overall long-term inflation rate is 3%. We are within range. We were at 2.9% right before the pandemic. We have been under 2% and have gotten spoiled. We like low inflation. Low inflation usually follows not-so-great times in our lives. There is no real correlation between inflation and appreciation. When we are in a balanced market appreciation matches the rate of inflation, when it is low, things are not good. Probably won’t have an impact on housing.

    Luxury Market:

    The luxury market and Bitcoin have spiked in 2021. Luxury increased in 2020, but this year it is crazy. It is not just from the CA buyers. The $2 million market is booming! Only Bitcoin and luxury real estate have exploded to this extent. No supporting data, only circumstantial.

    Recording only tells us whether or not they have a loan. Not how they paid for it, with USD or crypto

    Bitcoin is the only thing that has gone up as fast as real estate, if it drops off, will we see a drop off?

    Bitcoin in real estate has been a big headliner for a year. People are buying with crypto. Who are we attracting to Phoenix? A lot of tech companies from CA. Again based on circumstantial info.

    Cromford Market Index:

    Available on the main page of the Cromford Report: https://cromfordreport.com/ (without a subscription)

    • 100 is balanced and prices rise at the rate of inflation, below 100 is a buyer’s market, above 100 is a seller’s market, prices drop below 90, prices rise at 110.
    • On 2/5/2020 we were at 215.1
    • On 3/20/2020 we were at 241
    • On 5/15/2020 we were at 145.2
    • Yesterday we were at 461.2
    • We peaked on 3/14/2021 at 514.9
    • Prior to this run, the previous peak was 312.9 in the spring of 2005.
    • CMI is the predictor, it moves first and then appreciation follows. Cannot predict the CMI.

    The CMI is declining. This is where we see the shift taking shape. Demand is not falling as fast as it was earlier in the year. Since December demand has been dropping but inventory was dropping faster, keeping the CMI high. When the CMI started declining it was at a rate of about 8 points a month, then 5 points and now we are at 2.3 points a month. Demand has stopped dropping and actually increased yesterday, supply has actually risen which is great news. When demand goes below normal is when we see fewer transactions. Homes are still appreciating. It is good to see demand level off. Under 90 is low demand.

    There are still multiple offers and many sales over asking. Measure the temperature 514.9 degrees to 461.2 degrees; the market is still super-hot.

    How long will it take us to get to balance? It took 8 months to drop in 2005. If we stay at this rate, we are looking at 11.5 months to get to balance, which is May of 2022. It is measuring like 2005 which only means that prices are going up at a slower rate.

    Appreciation rates respond to markets. Appreciation rates will continue rising for the next 3-6 months. Annual appreciation rates rise when CMI drops. Price is a lagging indicator. It shows us where we were. CMI is a leading indicator, it tells us will happen.

    Yes, it is still a good time to buy because you always want to buy in a seller’s market, it is a winner’s market. Watch the equity grow. If it drops, it is ok because you have a down payment. Buyer’s markets are losers markets, everyone loses in a buyer’s market, and prices keep dropping during a buyer’s market.

    Just because it goes up does not mean that it will go down. The worst case is going down to balance. Nothing is indicating a decline in prices and no one is predicting one. If supply and demand come together and demand is below balance, the market will be slow and boring with fewer transactions. If supply and demand come together with demand above balance, then the market will be fast-moving, exciting, and have lots of transactions.

    There are 5 cities with increasing CMIs: Fountain Hills, Glendale, Goodyear, Paradise Valley, and Surprise. The factor for downward trend is affordability and pent up demand that created a surge, and buyer fatigue.

    Affordability:

    Affordability in Q1 2021 did not drop below 60, which is the bottom of the unaffordable range. The median family income is $79,000 a year. The national affordability score is 63.1 and for Phoenix, it is 62.8.

    Rentals are not affordable, mortgages are but not rents year over year. Affordability will be tough on rentals. With FHFA 7% portfolio limits for 2nd homes, any added expense will be pushed to the renter, further challenging renters.

    Supply:

    Inventory is rising. It doesn’t usually rise in May, going against the local seasonality trends. This is something to watch. People aren’t going to notice it yet. When you are supposed to be going down and are going up instead it shows a shift in the marketplace.

    Demand:

    • Restrained by lack of supply, not so much by demand.
    • 57.1% of sales closed over asking in April.
    • $16,100 median over asking amount.
    • Larger homes are appreciating more and faster. This is not normal for us or really anywhere.
    • The median sales price for single-family homes has reached $418,500, which is a 33% year over year appreciation rate.

    Summary:

    • The seller’s market is weakening. Sellers won’t notice but we do.
    • Supply: 77% below normal but increasing.
    • Demand: 7.6% above normal, leveling off.
    • 57% of April sales closed over asking for a median amount of $16,000.
    • The median days on market is 6 (hasn’t changed in 7 weeks)
  • Greater Phoenix Real Estate Update 4/30/2021

    Yesterday one of my clients excitedly called to tell me she had accepted an offer on her home for $1.2M more than she paid for it about two years ago. She then said, “Now what do we do? Rent, buy, flip?” I paused, gathered my thoughts, considered the numbers, and answered, “Don’t rent. Buy.”

    Logan Mohtashami recently wrote about why we are not in a housing bubble, “These Americans who are outbidding others and getting the home are doing very well financially. I am not talking about cash buyers or investors. I am talking about primary resident mortgage homebuyers. They have enough home-buying power to win the house. The market is unhealthy because we shouldn’t be having this much competition for shelter, but it’s not speculation demand at all.”

    Economy:

    Yesterday, Elliot Eisenberg wrote, “GDP grew at a pleasantly fast 6.4% annualized rate in 21Q1 and is now just 0.9% below its inflation-adjusted level on 12/31/19. It will surpass that level in mid-May 2021. By contrast, it took more than three years for real GDP to fully recover in the last recession. 21Q2 and 21Q3 GDP should easily exceed 21Q1’s 6.4%, and GDP growth in 2021 will, baring disaster, be the best since 1984.”

    Lending:

    With forbearance and delinquencies declining, 16.4% of homeowners got caught up on their mortgage in March, lessening the severity of the ultimate impact of these programs. There are still about 1.5M 90+ day late borrowers, which is not insignificant, however many are in forbearance and are protected for the time being. Over 47% of the borrowers exiting their forbearance plan never missed a payment, were caught up upon exit, or paid off the loan with a refinance or sale. For more info, check out my forbearance update from Wednesday.

    Purchase mortgage applications, a leading indicator, decreased 4% week over week, last week. This is the result of frenzied demand normalizing, low inventory, and significant home-price growth.

    “The purchase market’s recent slide comes despite a strengthening economy and labor market. Activity is still above year-ago levels, but accelerating home-price growth and low inventory has led to a decline in purchase applications in four of the last five weeks.”

    Joel Kan, MBA’s Associate Vice President of Economic and Industry Forecasting

    National Real Estate:

    After two months of declines, pending home sales increased by 1.9% from February to March. NAR projects a 10% year over year increase of existing home sales in 2021 with prices increasing by 9%.

    “Low inventory has been a consistent problem, but more inventory will show up as new home construction intensifies in the coming months, as well as from a steady wind-down of the mortgage forbearance program. Although these moves won’t immediately replenish low supply, they will be a step forward.”

    Dr. Lawrence Yun, NAR’s Chief Economist

    After new home sales declined by 18.2% from January to February, they increased by 20.7% from February to March and were up 66.8% year over year, the highest rate since 2006.

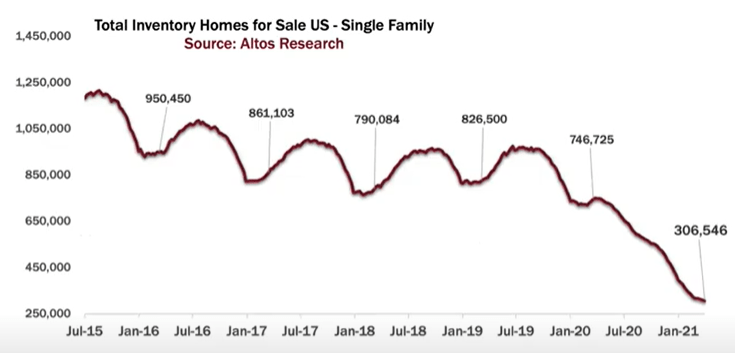
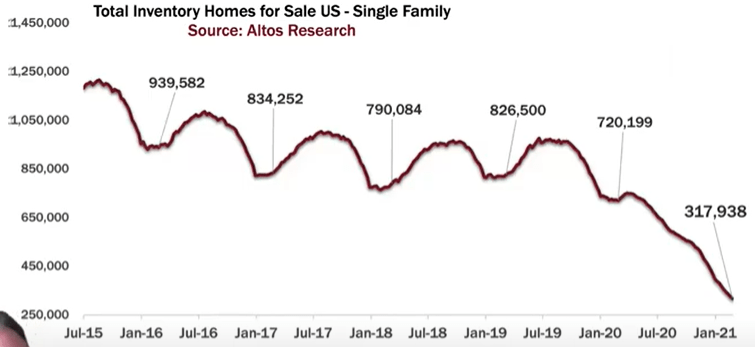
    Last week we had our first teaser with a slight inventory increase, this week available single-family listings declined by 2,000 down to 310,039. The steep decline in inventory is leveling out. Inventory is expected to grow for the next few months.

    The chart below doesn’t show the roughly 100,000 new listings that hit the market each week. About 28,000 went under contract in less than 24 hours and another 42,000 went under contract in less than a week. Sales are expected to remain at an elevated pace through June.

    The AZ Market:

    Inventory levels remain at historic lows but it stopped dropping. It is down 76% from two years ago and 69% from last year. Monthly sales are 11% above where they were two years ago and 29% above where they were last year.

    New Construction: The median new home price in greater Phoenix is now up to $403,000, according to Zonda. That is a 16% year over year price increase and sales are up 17% year over year. Lately, prices of new homes have been increasing 3% a month. While it seems like new homes are going up everywhere, there are actually 100 fewer active new subdivisions this year than there were last year. There is a total of 427 active subdivisions in Maricopa and Pinal Counties, the lowest in seven years.

    Case-Shiller Index: February’s Case-Shiller Index (the report that many large builders, Wall Street, and the US Census to track appreciation) shows that greater Phoenix continues to lead the pack with the highest year over year appreciation rate in the country at 17.4%. The national year over year appreciation was 12%, the highest year over year gain since February of 2006. Phoenix’s month-over-month gain was 2.03% while the national average was 1.05%. Tucson just barely beat Phoenix for the top spot for the largest year-over-year single-family rental appreciation at 11.2% and 11.1%, respectively.

    Policy:

    American Families Plan: On Wednesday, President Biden announced his proposed policy to provide free pre-Kindergarten and community college. The funding would come from taxing capital gains and inherited properties as well as eliminating the 1031 exchange program. This plan most significantly impacts real estate investors to the tune of $41B over the course of four years. Read more here. The proposal will likely evolve as it goes through Congress.
    First-Time Homebuyer Act: Congressmen from CA and OR introduced a bill that provides a tax credit for first-time homebuyers of up to 10% of the purchase price or $15,000. Buyers may not have owned a home in the past three years and make no more than 160% of the median income for the area.

    Zillow Browsing:

    A recent study shows that Zillow, like many social media platforms, can be addictive. According to the study: 53% of people looked up their boss’s house, 30% browse to daydream about houses they can’t afford, 62% checked out the value of their neighbor’s house, and 27% said they browse Zillow to relax. Additionally, browsers admitted to:

    Real Estate News:

    • Asset management companies, Altas Real Estate and DivcoWest have created a joint venture for single-family rentals and will spend $1B “acquiring and renovating homes in high-growth states including Colorado, Arizona, Idaho, Nevada, and Utah,” according to a press release.
    • Lumber prices increased again, now triple what they were 12 months ago, adding an estimated $36,000 to the average price of a new construction single family home.

    Final Thoughts:

    Elliott Pollack & Company wrote on Monday, “Housing will continue to make headlines for the foreseeable future. This level of activity and interest has not been seen since the mid-2000s. It is difficult not to compare these two periods. We went through our first recession since the Great Recession and the effects of that recession are still fresh in our minds. Yet, this is different. Measures were taken to keep people afloat and avoid a large number of foreclosures so far. Job growth has been steady and has made a significant recovery since last year. The number of listings is at a decade low and demand is outpacing supply, causing upward pressure on prices. Mortgage rates remain at historical lows and have allowed buyers to buy more and maintain affordability (Greater Phoenix and Greater Tucson) to a certain extent. And housing does not appear to be slowing down yet. We have seen an increase in permitting activity across the country and in Arizona, especially in its biggest metro areas.”

    Copyright 2021 Sarah Perkins

  • Greater Phoenix Real Estate Update 4/23/2021

    The pandemic created involuntary savings. People simply couldn’t spend the way they had in the past, and all of a sudden they had money for a down payment. Along with historic low mortgage rates and the ability to work remotely; the extra savings enabled super strong demand. As the economy opens up and people are able to spend their money on more services like concerts, eating out, and traveling the buyer demand is likely to subside modestly. Today’s ideal demographics (see last week’s post for details) will keep replacement buyers steady through 2024. As the demand fades to slightly elevated from crazy hot, the market will return to normal sales cycles.

    Despite movement towards normal, sales prices continue to grow. While yes, inventory has increased, locally it remains over 77% below normal and demand has decreased, it is still over 8% above normal. This supply/demand imbalance is so severe, it will take years to correct, and is why sales prices continue increasing at an appreciation rate of nearly 22%, year over year.

    Bull versus Bubble:

    There is a difference between a bull market and a bubble market. Real estate experts agree, we are currently in a bull market. Here are some basic indicators to illustrate the differences:

    • Is it true or false demand? Are the properties occupied by either renters or owners? True demand is when people are living in the property. False demand is when investors park money in the asset with no plans of using the property. Today homes are lived in.
    • Are rents increasing with sales prices? Rents, like sales prices, increase with greater demand and less supply and decrease with less demand and increased supply. Rental rates decreased during 2004-2006 and today they are increasing faster than sales prices in greater Phoenix. There are some markets, like San Francisco, where rents are falling while sales prices are increasing indicating the market is overvalued.
    • Huge increases of speculative buying on credit (bubble) versus cash buyers and down-payment buyers (bull).
    • What are the fraud levels? The higher the fraud levels, the higher the likelihood of a bubble market. If you were in the business during 2004-2006, chances are good you know someone in prison. Today, there are exhausted buyers and sellers who are unsure where they will go; the price appreciation is based on supply and demand, not collusion.

    National Real Estate:

    Existing homes sales declined by 3.7% from February to March, a smaller decline than the 6.6% decline from January to February. Both declines are attributed to the low inventory levels.

    “Consumers are facing much higher home prices, rising mortgage rates, and falling affordability, however, buyers are still actively in the market. The sales for March would have been measurably higher, had there been more inventory. Days-on-market are swift, multiple offers are prevalent, and buyer confidence is rising.”

    -Dr. Lawrence Yun, NAR’s Chief Economist

    It happened – for the first time in 52 weeks – not only did inventory not drop last week, it increased by 5,000 listings so now we are up to 312,000 available single family listings nationwide, which is an increase of 1.6%.

    Demand remains high; immediate sales also increased, up 3,000 from last week to 26,000 new single-family listings hit the market and went under contract in less than 24 hours.

    The high demand delayed the normal season cycle by about a month, normally by mid-March inventory starts climbing for peak buying season, which is normally March – June. In housing, normal is ideal.

    In addition to buyers having more options, an increase in available listings allows more time for appraisals.  So appraisers can get caught up and increases the likelihood of homes coming in at value.

    This week, the national median sales price increased by $5,000 week over week to $380,000 and the median asking price of new listings increased by $10,000 week over week to $360,000. Sales prices will keep climbing until about June 30th. Then they start to slow because cheaper homes tend to sell more in the 2nd half of the year.

    Homeownership Rates:

    In 2020, homeownership grew by 2.6% or by 3.9M new homeowners to 67.4% and the majority of that gain took place during Q2 2020 and Q3 2020.

    From 3Q 2019 to Q3 2020, Arizona’s homeownership rate increased by 4.1%, up to 71%. Arkansas had the biggest gain at a 7.1% increase, while New Jersey’s homeownership rate declined by 4.4%. West Virginia has the highest homeownership rate at 78.6%.

    The AZ Market:

    According to Redfin, nationwide luxury home sales increased by 41.6% in Q1 2021, year over year. In greater Phoenix, luxury home sales prices are up 25% in Q1 2021, year over year.

    New Construction:

    Nationwide, single-family permits increased from February to March by 4.6%. Single-family completions increased from February to March by 5.3%.

    Housing starts, considered an economic leading indicator, increased by 37% in March, year over year, and increased by 19.4% from February to March, though February’s level was lower than expected due to the winter storms.

    “In nearly every market, 20% more inventory means 20% more home sales. Today’s news on the new home construction surge is, therefore, highly welcomed, especially in light of major challenges on material costs and soaring lumber prices.”

    -Dr. Lawrence Yun, NAR’s Chief Economist

    According to Freddie Mac, builders need to build 3.8 million single-family homes just to meet current demand levels. The lag of new construction over the past decade has contributed to today’s low inventory.

    In 2020 builders built about 65,000 entry-level homes while 2.38 million renters became first-time homeowners.

    “As we navigate our way through the year and get beyond the pandemic, we expect the housing supply shortage to continue to be one of the largest obstacles to inclusive economic growth in the U.S. Simply put, we must build more single-family entry-level housing to address this shortage, which has strong implications for the wealth, health and stability of American communities.”

    -Sam Khater, Freddie Mac’s Chief Economist

    Commercial Real Estate:

    • The local office market has suffered four straight months of increased vacancies putting the vacancy rate at the end of Q1 2021 at 19.1%!

    “A year-plus of forced acceptance of remote services in every sector has carved permanent change into our behavior. And, few sectors have seen a more radical transformation than office work.”

    -Scott Galloway, Author & NYU Business Professor
    • Many major companies are making plans to reduce their commercial real estate footprint. JP Morgan Chase is planning to significantly reduce its commercial space as 10% of its employees will work from home permanently. CEO Jamie Dimon said, “Remote work will change how we manage our real estate.”
    • Office rents are expected to decline by 15% nationwide.

    Lending:

    • Purchase mortgage applications increased by 7% last week from the previous week and are up 57% year over year. We still have a few more weeks of year over year data comparing last year’s lockdown market to this year’s high demand/low inventory market.
    • Despite expectations of interest rates reaching 3.7% this year, the Mortgage Bankers Association is forecasting a 16.4% year over year increase in purchase mortgage volume which would set a new record at $1.67 trillion.

    “The housing market is incredibly strong this year, with robust housing demand in nearly every part of the country, driven by the improving economy, households seeking more indoor and outdoor space, millennials reaching their prime homebuying years, and still low mortgage rates. A lack of supply is the biggest hurdle to an even larger increase in home sales. The widening imbalance of supply and demand is driving up home-price growth and eroding affordability – especially for entry-level buyers.”  

    -Mike Fratantoni, MBA’s Chief Economist and Senior Vice President

    Real Estate News:

    • According to a recent Harvard report, due to last year’s lockdowns about 76% of homeowners completed at least one home remodeling project. The complexity and scope of the projects are increasing as homeowners are willing to spend more as home values rise. It is expected that in 2022 homeowners will spend $370 billion on home improvements.
    • iBuyer acquisitions are nearing their Q1 2020 numbers. While Phoenix remains the national leader in iBuyer activity, the margin of that lead is shrinking and Atlanta is catching up. Meanwhile, the two cities have significant leads ahead of the four remaining largest iBuyer markets in the country: Dallas, Charlotte, Las Vegas, and Raleigh.

    Final Thoughts:

    As one of my favorite housing economists, Logan Mohtashami with HousingWire recently wrote, “The nature of yellow journalism in our society is that fear and loathing sell. Impending doom is somehow sexy and gets many eyeballs and clicks, whereas the standard economic truth does not. People like myself who spend their time yammering on about demographics, prime-age employment to population levels, and how much shelter inflation can move Core CPI, are pleasant to listen to when the double martini doesn’t do the job of putting you to sleep. I get it. Stick to the facts, don’t get sidelined by the sideshow, and we will all be better off.”

    Copyright 2021 Sarah Perkins

  • Greater Phoenix Real Estate Update 4/16/2021

    Despite our fear of change, humans are quite resilient and are far more flexible than we realize. Quite often, change is good. Demand is declining and seasonality is beginning to emerge in the market. I am hearing stories about an FHA buyer who finally had a contract accepted and a seller who agreed to a few concessions. This is good news for our exhausted buyers; they need some wins too. This is how the machine is supposed to work.

    Demographics:

    The post-2008 market crash recovery was the weakest recovery in real estate history. Nationally we have been in a seller’s market since 2012, here in AZ it has been since 2014 (we had a deeper hole to climb out of than most of the country). From 2017-2020 resale closings ranged from 5,340,000 (2018) to 5,640,000 (2020); that is not a huge variation.

    There are more than 32,400,000 Americans aged 27-33. This is the largest group, in the largest generation and this is the prime time for getting married, having babies, and buying houses. Logan Mohtashami, senior economist at HousingWire says, “This is when people date, mate, and buy real estate.”

    The demand wasn’t here 10 years ago but it is here now and likely to stay elevated through the end of 2024. The combination of high demand and low inventory indicates we will stay in a strong seller’s market for years to come. The biggest problem buyers face today is declining affordability.

    New Construction:

    Builders have been underbuilding since 2009 due to the extremely slow recovery. The baselines for months of inventory for new homes is different from resale. At 6.5 months, builders stop building. At 4.4-6.4 months builders are ok as long as sales are consistent. Under 4.3 months builders are happy and building as fast as possible. Nationwide there is a 3.3 month supply of new homes. The building frenzy is warranted.

    While many are looking to builders to solve our inventory crisis and therefore aid in slowing this massive appreciation, builders will not overbuild. Builders are sellers, they want to maximize profits too. Like many of us, they too remember the pain of the crash and adjusted their business models accordingly.

    Lumber costs are the most notable, having nearly tripled in the past 12 months, but other material costs have increased also. Combine that with the labor shortages and huge demand, costs continue to rise for builders, who then push the additional costs to the buyers.

    Institutional Investors:

    Since the end of the Great Recession, institutional investors have purchased over 7M single-family homes to keep as rentals. These buyers are home rental firms, like Invitation Homes which owns about 80,000 houses in 16 markets, private equity, pension funds, sovereign wealth funds, etc.

    According to John Burns Real Estate Consulting, institutional investors are currently purchasing about 20% of all single-family homes in the US. Due to the continuously climbing rental rates in Phoenix, these buyers are purchasing about 30% of the single family supply. They pay cash and will go over the asking price in order to secure the property; something many buyers simply can’t compete with. Additionally, these properties are held longer than a typical owner stays, meaning these properties are being completely removed from the market.

    National Real Estate:

    Many industry experts predict that 2021 will have more sales than 2020 despite the low inventory. NAR predicts 6.5M resale closings, which is significantly up from 2020’s 5.64M resale closings. We do have strong demand and the market is, very slowly inching towards thinking about maybe trying to get closer to being normal, demand is not booming, which makes me doubt that 6.5M sales projection.

    Single-family active listings declined by another 3,000 listings this week so we are now down to 306,546. We may have another week or two of declines and by May, it is likely we will start to see an increase in inventory. Inventory levels are expected to stay low for years but not at these low historically low levels.

    Prices have stabilized, for the past 3 weeks, the median new listing asking price has remained at $350,000. Expect this to fall as we get later into the year. During normal cycles, more expensive homes are listed in the first half of the year.

    While prices and inventory have started to stabilize, the speed of homes going under contract has not. 38% of single-family homes went under contract within hours of listing and 70% sold in less than a week on the market.

    The AZ Market:

    The Case-Shiller Index measures residential values using a very specific set of data and guidelines and runs a couple of months behind the current market. Many large institutions, including the US Census, use it to gauge appreciation. The most recent data is from January and it shows, for 20 months straight, that Greater Phoenix has the highest appreciation rate in the country. January came in at 15.8%. More info on Case-Shiller click here and here.

    Demand is dropping, as of yesterday, it is 9.2% above normal. And inventory is increasing, it now only 77.7% below normal. Active listing supply is down over 70% from last year (during lockdown protocols). The median sales price is up over 18% year over year to $360,000.

    Remember in January 2020, when Tina Tamboer with the Cromford Report told us to expect a 10% appreciation in 2020 and it was shocking? I do. A lot has changed since then.

    Lending:

    • Many experts believe that despite rising interest rates (with the exception of the past 2 weeks) buyer demand will not dampen. In a press release from March, Fannie Mae stated that while some buyers are being pushed out of the market, an ample amount of buyers remain.
    • For the second week in a row, 30 year fixed mortgage rates declined. Despite the drop Freddie Mac expects rates to rise slowly throughout 2021.
    • While interest rate increases often make people nervous, remember the largest home purchase year in history was 2005 and rates were about 7.5%.

    Forbearance:

    The forbearance numbers saw one of their largest improvements this past week, dropping down to about 2.3 million borrowers or 4.66% of loans. That is down from 4.9% the previous week.

    “Almost 32 percent of borrowers in forbearance extensions have now exceeded the 12-month mark. In terms of performance, more than 88 percent of homeowners who have exited into deferral plans, modifications or repayment plans were current on their loans at the end of March, compared to 92 percent of all homeowners. The accelerating economic recovery in March helped more homeowners recover and become current on their mortgages, in addition to helping other homeowners with more stable financial situations exit forbearance.”

    Mike Fratantoni , MBA senior vice president and chief economist

    Policy:

    President Biden’s first-time homebuyer tax credit has evolved and was submitted to Congress on Wednesday. In the current iteration of the legislation, it is less of a tax credit and more of a down payment assistance program offering up to $25,000. Eligibility requirements include but are not limited to buyers who have not owned a house in the past 3 years, none of the borrowers’ parents may have owned a house unless they lost it due to foreclosure or short sale, income limits, and additional funds are available to groups recognized as socially disadvantaged. For more information click here.

    Real Estate News:

    • After multiple failed attempts to acquire CoreLogic, CoStar, which is heavily involved in commercial real estate, plans to acquire Homes.com for $156M as it continues to enter the residential space.
    • California Regional MLS, the country’s largest MLS with 104,000 members, has declared Saturday a business day. Some suspect it is to prevent a loophole in the Clear Cooperation Policy.
    • The SEC is warning investors about an increase in “lawsuits alleging inadequate disclosure by SPACs.” Going public via SPAC has been perceived as a cheaper, easier process than via IPO. However, in November, Harvard published a study showing that SPACs are more expensive than an IPO and investors are paying those added costs, for now.

    Final Thoughts:

    Today’s market is nothing like that of 2005 but the intensity of it feels very similar. As the market begins to cool, fear will rise, the 2008 crash wasn’t THAT long ago, right? A lot has happened in 13 years.

    That hasn’t stopped the housing fear Googling though. Searches asking, “When is the housing market going to crash?” increased by 2,450% in the past 30 days. Searches asking, “Why is the market so hot?” doubled in the past week. And searches asking “How much over asking price should I offer on a home 2021?” increased by 350% in the past week.

    Let’s spread the word, housing is, hopefully, starting to normalize which is good for everyone. Prices will continue to rise but at a slower rate.

    Copyright 2021 Sarah Perkins

  • Greater Phoenix Real Estate Update 4/9/2021

    Now, this is a headline that says it all, “Who’s Lying About The Housing Market? The housing market is heating and cooling at the same time, depending on the data in question. Who’s telling the truth?  Actually, maybe everyone…” Author, Matthew Graham explains that prices are appreciating faster than they have in 15 years, homes are selling in minutes, and bidding wars are commonplace all while demand is actually falling. Demand was THAT high and remains above normal.

    National Real Estate:

    • 36% of newly pending sales were immediate, meaning they went pending either before they hit the market or within 24 hours of going active.
    • 64% of newly pending sales were on the market for one week or less.
    • Nationwide there are only 309,883 active single-family listings available. The decline in inventory has slowed over the past 4 weeks.
    • As the market moves towards typical seasonality, it is likely that inventory will increase towards the end of April. Anything moving towards “normal” is good.
    • The supply/demand imbalance drove the 15% year over year appreciation leading to 58% of all households, or about 71.1 million, could not afford to buy the median-priced new home.
    • The median sales price last week increased to $374,000, a new all-time high. As typical seasonal cycles emerge, prices are expected to keep rising through June. More sales usually happen in the first half of the year which is why October through December 2020 had record-breaking sales.
    • The newly listed cohort asking price is flattening at $350,000 and will continue to flatten as more listings come to market and there is more competition. This is also normal for this time of year, again seasonality is good.

    The AZ Market:

    For one week only – from April 10 through April 17 – local home builder, Fulton Homes, is allowing buyers under contract to cancel and receive a full refund. They did this because of the 1 to 6+ month building delays due to supply chain shortages, lumber costs, labor shortages, etc. While yes, this benefits buyers with specific timelines but the builder is also benefitting. This will lead to more spec homes to sell allowing the builder to capitalize on the 1-3% of monthly appreciation our market is experiencing.

    The Greater Phoenix housing market and the overall economy have been a top performer throughout the pandemic. The affordable housing we have enjoyed for many years has brought much business to Arizona from more expensive cities. However, now after many months of having the highest rental appreciation in the country and among the highest sale appreciation, we are not so affordable anymore.

    On Monday, Elliott Pollack & Company wrote, “So while the local economy is performing better than any other in the country at the current time, demand for housing is pushing costs beyond the reach of some, even with low-interest rates. Housing cost is something to watch over the next couple of years with the hopes it does not detract from our competitive advantages.”

    With 5 buyers for every available listing and 18-20% year over year appreciation, this concern is very real. While demand is declining – we no longer have 8 buyers for every listing – prices continue to increase and will continue increasing for the foreseeable future.

    Lending:

    • The Data has yet to show that rising interest rates are hurting buyer demand. The current closings are with buyers who locked in at a lower rate; we may see the impact in the coming weeks. The segment to watch is the second home market because those loans just got a lot more expensive.
    • Purchase applications decreased by 4% last week from the week before. They are up 51% year over year; keep in mind that one year ago we were in the middle of the 8-week downturn in the market.
    • Sam Khater, Freddie Mac Chief Economist said, “After moving up for seven consecutive weeks, mortgage rates have dropped due to the recent, modest decline of U.S. Treasury yields. As the economy recovers, it should experience a strong rebound in the labor market. Combined, these positive signals will continue to bolster purchase demand.”

    The Economy & Employment:

    • Yesterday, economist Elliot Eisenberg wrote, “The economy continues to roar back to life. The Institute for Supply Management’s services index rose to a record high of 63.7 in March, and in the process blew away the previous high of 60.9 of 10/18. This is great news as the recovery in services has, for obvious reasons, lagged well behind the manufacturing renaissance, and that index hit 64.7 in March, its best reading in nearly 40 years!”
    • The Fannie Mae Home Price Sentiment Index reached 81.7 in March, nearly exceeding pre-pandemic numbers for the first time in a year. It is up 0.9 points year over year and up 5.2 points from February.
    • Between decreasing unemployment, increased vaccine distribution, and the latest round of stimulus checks consumers are optimistic about the economy. Doug Duncan, Fannie Mae senior vice president, and chief economist said. “Home-selling sentiment experienced positive momentum across most consumer segments – nearly reaching pre-pandemic levels and generally indicative of a strong seller’s market.”
    • About 62% of jobs lost last year have been recovered. Today, there are still about 4 million more people unemployed than in February 2020.
    • The real estate industry added 10,000 jobs in March which was a huge improvement after losing 4,500 jobs in February.

    “There’s a seismic shift going on in the U.S. economy. Fear is subsiding, and American households are sitting on a lot of cash from saved stimulus checks and other money people would normally spend on travel or going out. That’s going to support spending, especially in the services sector.”

    Beth Ann Bovino, a Ph.D. economist at S&P Global, told the Wall Street Journal.

    CFPB Proposal:

    On Monday, the CFPB proposed a ban on foreclosure starts through the end of 2021. This means that lenders and servicers could not even start the foreclosure process until January 1, 2022. Different states have different timelines for the foreclosure process. Here in AZ, the process takes 90 days so we would not see any properties go to auction until about April 2022.

    The CFPB’s foreclosure rules state that a borrower needs to be at least 120 days delinquent before the foreclosure process can start. They extended timelines because they are concerned that borrowers in forbearance will exit forbearance and then immediately go into foreclosure.

    Of the roughly 2.5 million borrowers in a forbearance plan, about 2.1 million are on a plan extension, meaning they have been in forbearance for at least three months (timelines depend on loan type and/or servicer). The CFPB’s proposal does not take into consideration that about 41% of forbearance plan exits are current on their payments at the time of exiting. For more forbearance data, check out my AZ Forbearance Update from Wednesday.

    A number of industry leaders are questioning the proposal stating that the CFPB is violating legal contracts and agreements that are currently in place.

    “I was surprised we went all the way to the end game. Candidly, I’m not sure the CFPB has the legal standing to disrupt a contract law across the country, especially as some of these are private loans and there is a contract made between the borrower and lender. This is the first time the CFPB has really tried to interject itself in this dramatic manner. So I do suspect if they come out with this ruling, we might see legal challenges to it by somebody in the industry.”

    -Rick Sharga, RealtyTrac

    The proposal is open for public comments through May 11. To comment, email: 2021-NPRM-COVID-Mortgage-Servicing@cfpb.gov. Include Docket No. CFPB-2021-0006 in the subject line of the message.

    Real Estate News:

    • For 1.5% of the sales price, Offerpad will allow sellers to stay in the property up to 60 days after close of escrow.
    • Announced Monday, Redfin finalized its $608 million acquisition of RentPath, the parent company of ApartmentGuide.com, Rent.com, and Rentals.com. Rental listings will be available on Redfin by 2022.
    • Eight new real estate executives joined the ranks of the roughly 200 real estate executives on this year’s Forbes Billionaire List. Zillow co-founders Rich Barton and Lloyd Frink and eXp founder Glenn Sanford are now among the 2,755 richest people in the world.
    • Last summer New York City reached its highest vacancy rate in 14 years. Sales in Q1 2021 in New York City increased by 58% year over year and reached the highest total first-quarter sales in 14 years.
    • According to a Zillow survey released on Tuesday, 11% of Americans moved during the pandemic accelerating the trend which began in 2018 of people moving to smaller, less expensive cities in the Sun Belt. From January through November 2020 Phoenix, Charlotte, and Austin had the highest inbound moves from expensive, high-tax cities.
    Zillow

    Final Thoughts:

    Residential real estate is indeed heating and cooling at the same time. Homeowners have gained serious equity, savings rates are high, and economists are optimistic. 2020 created more billionaire real estate executives while 9.7 million people remain unemployed.

    Copywrite 2021 Sarah Perkins

  • Greater Phoenix Real Estate Update 4/2/2021

    The human condition versus efficiency.

    Real estate disruption is all about creating efficiency. As we lead busier and busier lives, fast and efficient is appealing, right? In theory, buying and selling a property with Amazon-like ease sounds great. In reality, our human condition drives us to desire human input, not just in reading interesting articles but in being able to talk to someone about specifics.

    For example, in a recent HousingWire article about where Realtors fit into Zillow’s plans, Matthew Blake writes, “Zillow wants to do it all in real estate. And the role of agents in this isn’t nothing. But agents’ role seems more like one worker on an assembly line, instead of a hand-holder amid the dynamic, stressful and inefficient process that is the home sale.” Does an assembly line strategy best serve the consumer? Unlikely. Yes, the industry definitely has inefficiencies to improve but in order to create greater efficiency do we also have to give up individual guidance for the consumers who want it? I don’t think so.

    On Tuesday, Brad Inman wrote, “In this fast-changing world, the digital face off will become more pronounced for the consumer. Advertising dollars are flowing into the digital alternatives, giving the customer more choices with a mix of competing benefits. Efficiency versus human touch; higher versus lower fees; and the old way versus something new and often untested.”

    IPOs, SPACs, and Unicorns:

    • Knock hired Goldman Sachs to take them public either via IPO or SPAC with a goal of a $2 billion valuation.
    • Compass successfully completed its IPO and went public yesterday giving it an $8 billion valuation and about $450 million in capital (roughly half of the goal outlined in the initial S-1 filing). Investors and real estate professionals alike are closely watching Wall Street’s reaction to the IPO. Compass has positioned itself as a tech company like Redfin or Zillow with valuations of $28.7 billion and $32 billion, respectively. But many in the industry consider it a traditional brokerage more like Realogy with a valuation of $1.78 billion or RE/MAX with a valuation of $1.19 billion. (despite the huge variation in valuations Realogy and RE/MAX are profitable while the others aren’t) While it is not unusual for valuations to fluctuate, we will soon know how Wall Street defines Compass.
    • WeWork, a co-working company, announced it is going public via SPAC in Q3 2021 with an expected valuation of $9 billion. In 2019 WeWork attempted and failed to go public via IPO and its valuation dropped from $47 billion to $3 billion.
    • To be considered a “unicorn” a company must reach a $1 billion valuation (there are about 600 on the planet) and the frequency of real estate tech companies reaching unicorn status is increasing, here are three examples:
      • Side a back office brokerage and technology platform that keeps teams and agents front-facing.
      • Pacaso creates co-owner opportunities for second homes.
      • Divvy Homes offers rent to own solutions and down payment options.

    National Real Estate:

    • Pending home sales declined by 10.6% from January to February; mostly due to low inventory.

    “The demand for a home purchase is widespread, multiple offers are prevalent, and days-on-market are swift but contracts are not clicking due to record-low inventory. Only the upper-end market is experiencing more activity because of reasonable supply. Demand, interestingly, does not yet appear to be impacted by recent modest rises in mortgage rates.”

    -Dr. Lawrence Yun, NAR’s chief economist
    • Demand increased in March as people rushed to lock in their rates as they rose. It is too early to see the true impact the rising interest rates will have on buyer demand.
    • After two weeks of staying relatively flat, this week’s active single family listings nationwide decreased by about 3,000 listings to 312,872.
    • According to Realtor.com, nationwide, the median sales price in March reached $370,000; up 15.6% year over year. The highest median sales price ever, even above the highs of the 2005 bubble.
    • Asking prices for new listings has just started to level off after the giant run-up. Leveling off at the end of March/early April is normal seasonal behavior. We will likely see it start to fall towards the end of April, which is also part of the normal seasonal real estate cycle.
    • Price reductions increased slightly to 16.3% from last week’s all-time low of 16.1%. The number of price reductions is a great way to gauge buyer demand, which based on these numbers remains extremely high.

    “Only higher rates will result in more days on the market and thus larger inventory. We need these two things in order for buyers to have more choices and more reasonable price growth. Again, the question remains if rates will get high enough to have this effect on the market before more price damage is done. Right now home prices aren’t high enough to impact demand in a major way.”

    -Logan Mohtashami, HousingWire’s lead analyst
    • As sales prices climb, homeowner equity rises too. According to this chart homeowners in CA and VT have the most equity. It also shows that 32.5% of Arizona’s homeowners have at least 50% equity.

    The AZ Market:

    Cromford Market Index (CMI): Is the best leading indicator available (balance is 100, above 100 is a seller’s market, below 100 is a buyer’s market, prices rise at 110, and drop at 90). Yesterday it was 502.7. On 3/20/2020, it reached the pre-COVID peak of 241 and on 5/15/2020 it bottomed out at 145.2 and started increasing continuously until 3/14/2021 when it reached 514.9. It was then that demand continued decreasing while inventory finally stopped dropping, albeit at 78% below normal. As of yesterday demand is 11% above normal.

    The supply versus demand imbalance has pushed the median sales price up to $358,250 giving us a 19% year over year appreciation.

    The Milken Institute recently published a report ranking top US cities. The ranking is based on jobs, wages, tech growth, housing affordability, and broadband access. Phoenix ranked #7 and is the largest population. Phoenix isn’t just for cowboys, retirees, and spring break. We have a growing high-tech economy with a highly educated workforce.

    Elliott D. Pollack & Company

    Lending:

    • For more on forbearance, foreclosures, and inflation check out my update from Wednesday, here.
    • Purchase mortgage applications declined last week by 1% week over week, mostly due to low inventory. They are 39% higher, year over year. Throughout April, year over year numbers will be will not be a good market indicator since last April we were on lock down and had a curfew.
    • Freddie Mac announced yesterday that despite the low interest rates, buyer demand has started to pullback. At the beginning of 2021 demand was 25% above pre-pandemic levels and now demand is at 8% above pre-pandemic levels.

    “We even see that purchase demand is diminished today as compared to late May and early June of 2020, when mortgage rates were the same level. This is confirmation that while purchase demand remains strong, the marginal buyer is feeling the affordability squeeze resulting from the increases in mortgage rates and home prices we’ve experienced in recent months.”

    -Sam Khater, Freddie Mac’s chief economist

    Federal Policy:

    Real estate groups are praising President Biden’s proposed $2 trillion infrastructure plan because it of its focus on housing. The plan calls for funding for repairs and upgrades to buildings, roads, bridges, the electrical grid, water systems, and more including:

    • $213 billion for affordable housing.
    • $40 billion to improve public housing.
    • $20 billion in tax credits for affordable housing.
    • $10 billion to modernize federal buildings.
    • Create grant programs for cities and towns that remove barriers for building affordable housing (like exclusionary zoning laws).

    Real Estate News:

    Final Thoughts:

    The real estate market will not stay like this forever. Today the story of a $275,000 fixer in suburban DC that received 88 offers, 76 of which were cash, and 15 sight unseen and sold for $460,000 is surprising. Six months ago it would have been shocking. A year ago, no one would have believed it.

    Inventory will increase, appreciation will slow, buyers will once again have options, and sellers will list their houses without the fear of having nowhere to go.

    As Ella, my family’s nanny, reminds us regularly, this too shall pass. Strike while the iron is hot, save for tomorrow, and hope for the best.

    Copywrite Sarah Perkins 2021

  • Greater Phoenix Real Estate Update 3/26/2021

    “There are decades when nothing happens, and then there are years when decades happen,” Notarize CEO Pat Kinsel said after raising $130 million in funding.

    National Real Estate:

    Inventory remained flat again this week, now two weeks in a row. We have 316,073 active single-family listings nationwide. This is a good thing for buyers and means that our market is moving towards a more balanced environment. It is less good for sellers; especially those expecting to sell for $50,000 or more over asking. It is normal for inventory to stay low through March, it usually starts climbing by late March, or at least by April 1. Last year our inventory peaked on April 3 at about 750,000 active single family listings. After that inventory started plummeting for 50 weeks straight.

    The percent of homes with price reductions is currently at record lows at 16.1%. Enough contracts are coming in over-asking which means very few sellers are reducing their asking price. For Realtors working with sellers and potential sellers, the next 3-4 weeks is likely going to be the absolute peak. The rest of the year will continue to have strong buyer demand and increasing prices, but the absolute peak of the demand frenzy is likely happening right now. So now is the time for sellers to get the biggest premium.

    According to Freddie Mac, rates reached 3.17% yesterday, the highest they have been since June.  A year ago they were 3.5%. As interest rates increase, home buyers are spending less on discretionary items, like certain upgrades in new homes or waiving inspections or appraisals in resale homes.

    About 50% of mortgage borrowers in the US have interest rates at or below 4%. Ivy Zelman is concerned that if rates go too far above 4% that it will lock a lot of homeowners in their current properties, unwilling to take a higher rate which would further reduce inventory.

    About 40% of the 138 million residential properties nationwide are owned free and clear. And nearly 57% have at least 50% equity. (KCM)

    Market Headlines:

    Existing home sales declined 6.6% from January to February. No need to panic though, sales were up 9.1% year over year and the market was strong during February 2020. The decline is due to the low inventory combined with the 15.8% year over year appreciation.

    New home sales dropped 18.2% from January to February but are still up 8.2% year over year. New home sales are usually impacted more by interest rates than are existing home sales. Builders are impacted by rising costs too, due to labor shortages, supply chain issues, and lumber costs. A new home now costs $24,000 more, on average, a cost that is pushed to the buyer.

    “Despite the drop in home sales for February — which I would attribute to historically-low inventory — the market is still outperforming pre-pandemic levels,” 

    Dr. Lawrence Yun, NAR’s chief economist

    Many economists and housing experts are talking about the inflation impacting our market, not inflation of goods and services but inflation in housing. Anyone wondering when we will be impacted by inflation doesn’t need a crystal ball. It is here and happening now. Every single home buyer looking in this market will agree.

    The AZ Market:

    • At 2.1% of all home sales, Phoenix had the largest number of iBuyer sales in Q4 2020.
    • New home permits in Greater Phoenix increased by 24% year over year in February, while nationwide permits decreased by over 10% year over year. (Elliott Pollack)
    • Locally, inventory has stopped dropping also. Here is some perspective; in January 2019 we had over 18,000 active listings and in January 2021 we had just over 6,000.
    • As long as there are more pending listings than active listings, we will be in a market frenzy, the extent of that frenzy is based on how wide the gap is.

    Forbearance:

    For info on forbearance, buyer confidence, and a surprising move by some landlords, click here for my update from Wednesday.

    Another Commission Lawsuit:

    NAR, a few CA MLS associations, and several large national brokerages were named in the 5th class action lawsuit going after commissions that was filed last week. The plaintiffs in all five lawsuits want to have homebuyers pay their agent directly rather than having the listing agent share their commission.

    NAR/DOJ Settlement:

    In November the DOJ filed a lawsuit and settlement against NAR requiring 5 changes for NAR to implement by the end of Q1 2021. The most notable change is that the commission offered to the buyer’s agent is to be made public. RE/MAX, Redfin, and a few MLS’s have started making the info available. On Tuesday a spokesperson from NAR said these changes may take months to process. There is no ETA for the actual implementation of these changes and from the sounds of things, they are still working on the details of those changes.

    GSE Second Home Policy:

    On Tuesday, the Mortgage Bankers Association sent a letter to Treasury Secretary and the FHFA director expressing concern over recent amendments including the 7% limit on the GSE’s portfolio for second home loans, a rate well below the current percentage. The MBA asked for a meeting to discuss the potential “unnecessary disruptions in the housing finance system.” For more information on the portfolio limits, check out my video and post from Monday, here.

    Demand for investment properties and vacation homes has risen 84% year over year – more than double the demand for a primary home.

    Real Estate Disruption:

    Zillow had 9.6 billion visits to its website in 2020, by far the most of any real estate company or portal. This is why real estate was the top performing sector in the entire economy.

    Is Zillow becoming a verb? According to a Google Trends report, more people in 2020 searched “Zillow” than “real estate.”

    Real estate tech strategist and iBuyer guru Mike DelPrete said, “The point is not that these business are unprofitable and therefore must be bad. Spending (and losing) money to gain market share is a well-worn path. The point is that these companies are actively doing it, and if you’re in the real estate industry, concerning yourself with disruptors willing to lose billions is a good use of time.”

    Pete Flint co-founder of Trulia said, “I often say that if something can be commoditized, it will be commoditized, and I look at the financing, title and escrow and all these components of the real estate industry that will get digitized, and will get somewhat commoditized. But if you’re providing value as an agent, which cannot be commoditized, then I think you’re going to be fine.”

    Real Estate News:

    • Offerpad announced it is going public through a SPAC created by former Zillow CEO and co-founder, Spencer Rascoff. Ironically, after Rascoff’s departure, Rich Barton, the current Zillow CEO and co-founder, began heavily investing in Zillow’s iBuyer. After going public, Offerpad expects a $3 billion valuation and will receive up to $650 million in cash. They will use the funds to expand to new markets and increase advertising spends in existing markets.
    • Homie is hiring 1,000 new buyer (employee) agents nationwide.
    • The CFPB reversed policies from January 2020 which limited its power. The CFPB plans on exercising greater enforcement “consistent with the full scope of its statutory authority under the Dodd-Frank Act.”
    • According to CoreLogic, American homeowners gained about $1.5 trillion in equity in 2020.
    • Target plans on spending about $4 billion a year expanding and improving its real estate portfolio. After sales in 2020 grew by more than $15 BILLION, more than the previous 11 years combined.

    Final Thoughts:

    For anyone, buyer or seller, on the fence about what to do next; the answer is clear. Buy now, rates and home prices are going up. Sellers sell now, increased inventory is coming and that will create more competition and, likely, more time spent on the market.

    Copywrite Sarah Perkins 2021

  • Greater Phoenix Real Estate Update 3/19/2021

    Once again, today is all about the AZ market. Recently, Lawyers Title hosted a presentation with Tina Tamboer with the Cromford Report. She always shares pertinent and timely information. Below I have combined a lot of her information from her presentation, along with additional information from my research.

    What affects supply?

    • New Homes
    • FSBOs
    • Appreciation/Depreciation (equity)
    • Foreclosures/Household Formation (shrinking)
    • Relocation (Outbound)
    • Divorce/Illness/Death/Job Losses/Tragedy
    • Consumer Sentiment

    What affects demand?

    • Interest Rates
    • Appreciation/Depreciation (affordability)
    • Relocation (inbound)
    • Employment/Income
    • Loose/Tight Lending Practices
    • Population Growth
    • Household Formation (growing)
    • Consumer Sentiment – this could be the most important of them all.

    The recent announcement that Fannie Mae and Freddie Mac must restrict second home and investment property loans to only 7% of their total portfolio (far less than it is currently) may negatively impact demand. This move could force second home buyers to pay higher interest rates on their loans.

    Employment:

    • AZ is on track to see 11% job growth over the next 2 years.
    • 519 new companies came to AZ in the past 5 years.
    • The AZ job market has diversified a lot in the past 12 years. We have gone from the majority of our population working in hospitality and housing to also have an emphasis on tech, biotech, manufacturing, health care, etc. 
    • Arizona’s unemployment rate is 6.3% and the national rate is 6.7%. 5% is considered full employment.
    • Initial claims were at 4,108 the first week of March, normal is 3,807.
    • Continuing claims remain significantly heightened. We are running 65,000 continuing claims a week and normal is about 19,000.
    • People will less education have been more negatively impacted than have those with a college degree or higher.

    Renters:

    Due to the high unemployment rates for younger workers and less-educated workers; renters are struggling more than homeowners. In addition to the additional renter’s assistance in the latest stimulus plan, Arizona has quite a few options for rental assistance. Landlords are able to register on behalf of their tenants. For more information visit: https://des.az.gov/ERAP

    Forbearance:

    There are people who think it will be raining homes when the forbearance period ends. This is not going to happen.

    Every 3 months we see an improvement, as more borrowers exit their forbearance plans. But the past few months have been flat. Hovering around 2.6 million borrowers in a plan. The recovery continues making slow progress. At the end of March, we will likely see a lot of forbearance plan exits. There have been additional filing extensions. For more information on forbearance, delinquencies, and demand please see my forbearance update from Wednesday, here.

    Foreclosures:

    What happens with the moratoriums are lifted? We will see a wave of foreclosure filings but not of short sales. After 18 months of no foreclosures, there will be a backlog. But they will mostly be sold normally as owners have more equity today. According to KCM, on average nationwide there are about 69,000 foreclosure a month, during normal times.

    Population:

    • Population growth is creating demand.
    • When you lose population, you have extra homes, when you gain it, you have insufficient supply.
    • AZ is #2 for incoming migration behind Idaho.
    • All of the moving companies agree, people are leaving CA, NY, IL, WV and are moving out to AZ, ID, and TX.

    The majority of AZ’s population growth is from people moving here domestically. It is not from lots of babies or international migration. 

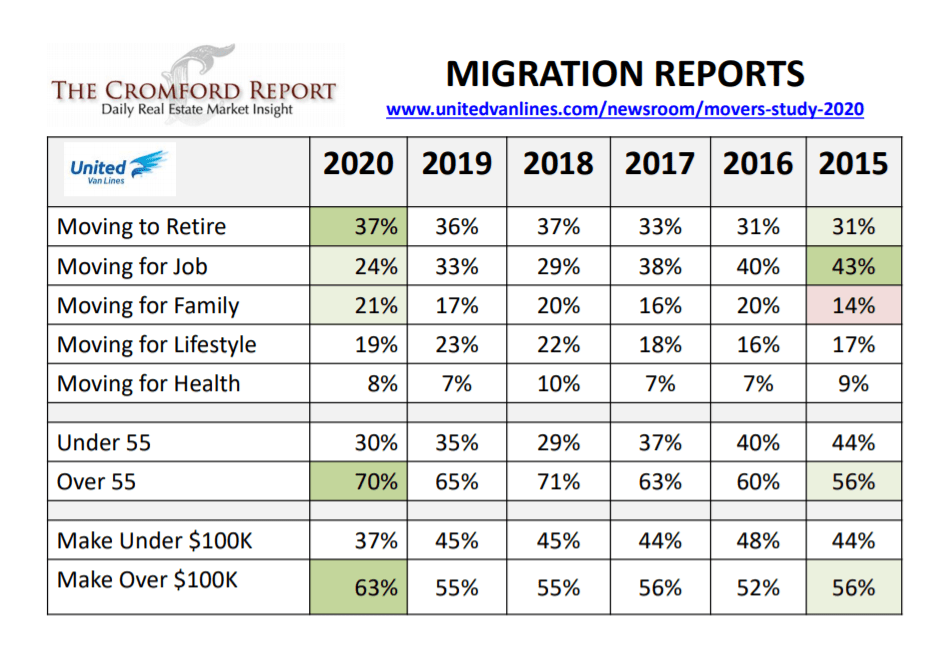
    Most people started moving here to retire versus people moving here for a job in 2018. Look at the ages of the people moving here, their income, and retirement. Our domestic migration is older, wealthier, highly trained, more experienced population and finishing up their career and then retiring.

    Affordability:

    The ideal range for housing affordability is 60-75. Through Q4 2020 in Phoenix someone earning the median income, they can afford 60.6% of what is for sale. In LA it is 9.1% and San Francisco it is 11%.

    Household Income:

    Maricopa county association of governments, shows demographics, click here for the demographics map. Density is increasing in new luxury areas. South Chandler, a lot of Gilbert, east Mesa, and South Mountain is getting bluer. Showing new emerging luxury markets.

    Job Centers:

    Jobs are created by freeways. The heavier the employment area the bluer. A lot of job growth, biomedical, and tech, fueling demand, bringing in people who make a lot of money. Click here for the interactive map.

    The Cromford Market Index:

    Available on the main page of the Cromford Report: http://cromfordreport.com/ (without a subscription)

    • 100 is balanced and prices rise at the rate of inflation, below 100 is a buyer’s market, above 100 is a seller’s market, prices drop below 90, prices rise at 110.
    • On 2/5/2020 we were at 215.1
    • On 3/20/2020 we were at 241
    • On 5/15/2020 we were at 145.2
    • Yesterday we were at 512.6.
    • We peaked on 3/11/2021 at 514.9
    • Prior to this run, the previous peak was 312.9 in the spring of 2005.
    • CMI is the predictor, it moves first and then appreciation follows. Cannot predict the CMI.

    Demand is 14.5% above normal and supply is 77.7% below normal. Despite demand dropping by one percentage point a week and faster than supply is dropping, the market is still in a frenzy. As inventory stabilizes, which it will, this market is unsustainable, things will calm down. Buyers will once again be able to get a house without having to write 10+ offers before one is accepted.

    With the CMI dropping, prices will not go down, they will increase more slowly, which is what we want. This appreciation rate is not sustainable. This doesn’t mean that we will crash. Indicators wants to be together. Markets want to be balanced. Buyer’s markets do not happen because it is time. There are reasons for buyer’s markets, there has to be a cause. Demand needs to be lower than supply in order for prices to drop.

    Is it a good time to buy? Yes! It is best to buy and sell in a seller’s market. Sellers make money and buyers see appreciation right away.   

    What will slow it down? Affordability.

    Affordability in Q1 2021 will likely drop below 60 which puts pressure on prices. the level of demand doesn’t start dropping until we are below 60. How long will it take to get to lower demand? It could take months, who knows. Demand, once it goes to the low side of normal and then we will see supply go up.

    Number of Sales:

    ADRE is adding 500 new licensees a month, not all in residential but it is increasing the amount of competition as more people will be fighting for a certain number of monthly sales.

    Supply will come up when demand goes below normal, prices will continue to go up until demand is lower than supply.

    As transaction counts decrease, it will impact all of our jobs. We need to position ourselves for the 2nd half of the year. Focus all efforts on listings. We have the demand but the competition will be increasing significantly in the 2nd half of the year.

    Interest rates:

    The recent big hike could be a reason for the drop-off in demand. Even though 3% is great, people get scared when it increases. It does limit options for some buyers.

    Those who waited for prices to go down are now paying $20,000 more for the median sales priced home just since December due to rate increases. Since 2018 the median sales price has increased by $80,000 but monthly payments have only gone up by $133.

    Rents:

    Rents are more expensive than mortgages. Rents are rising quickly. The median house rents for $250 more a month than the going rate for a mortgage for the same house.

    Rents are rising = not a bubble, rents decline due to false demand. Rents are declining in San Francisco while houses are still rising, equating to false demand. San Francisco could be considered over-valued. Prices only drop due to vacancies. The number one risk in housing is vacant houses.

    Vacant Homes:

    • 77% of sales in Q4 2020 were owner occupied purchases.
    • The remaining 23% were iBuyer, investor buy & hold or flip, vacation rental, 2nd home properties.
    • Second homes are always counted as vacant. The new Fannie and Freddie rules may impact this market.
    • The new lending guidelines will not impact international buyers.

    Supply: 

    • Supply stopped dropping for the first time in a year.
    • It actually increased by 100 listings in one week.
    • This is the worst year in the past 20 years for new supply, even with the slight increase and despite being the best quarter ever for sales.

    Sales:

    • Selling 2500 houses a week, listing 2000 a week.
    • Pendings have been flat for 1.5 months, we can’t increase properties under contract when there isn’t enough supply.
    • And still are having the best quarter ever.
    • Appreciation is pushing 24% year over year, but most price ranges it is about 10%-15%.

    These markets do not stay like this forever. We will not see then impact of the pullbacks for about a month. Then we may see a slow down in sales. Need more inventory under $500,000.

    Sales Over Asking:

    • 49% of sales closed over asking the first week of March.
    • 40% of sales closed over asking in February.
    • The median amount over asking is $10,000.
    • 50% of all accepted contracts were on the market for only 6 days.

    Population Growth and New Builds:

    We overbuilt for 10 years before we started underbuilding for another 10 years and population growth outpaced building. In 2019 we ate up the last of the glut of housing.

    Developments:

    Without new listings we have to look at new construction which is a challenge due to labor shortages and lumber prices are up 200%, adding, on average an additional $24,000 in cost to the average new build.

    Most developments are going into the south and west, due to cheaper available land. Very little in the north. Values are increasing the most in the north. Click here for the interactive map.

    Contract Ratio:

    On March 1 the contract ratio was 300. That means for every 100 active listings there are 300 pending listings.

    Final Thoughts:

    • Supply is down 77.7% below normal.
    • Demand is 14.5% above normal.
    • Year over year appreciation is pushing 24%.
    • Sales prices are not going to decline this year.
    • There will likely be fewer sales in 2021 than in 2020 due to the low inventory levels.
  • Greater Phoenix Real Estate Update 3/12/2021

    One year ago yesterday, the World Health Organization officially declared the coronavirus a worldwide pandemic. Despite our efforts, no one accurately predicted the following 366 days. The light at the end of the tunnel is getting brighter. Kids are going back to school, vaccines are being distributed, the economic conditions are improving, and residential real estate – the sector that carried the entire economy for a year.

    Real Estate Disruption:

    Two weeks ago I wrote about real estate becoming less grassroots, more Wall Street, and Zillow’s new Zestimate. You can read the update here. On Wednesday, Brad Inman wrote about 8 of the 10 largest real estate firms being publicly traded. Those firms represent nearly 45% of all Realtors. There are upsides and downsides to Wall Street in real estate. Read his article here.

    Last year Compass lost $270 million (details below). Zillow’s iBuyer and Opendoor combined lost $607 million in 2020. In 2019 they lost a combined $650 million. How is it that two companies can lose over $1.2 billion dollars in two years and remain in business? These companies are spending big money fighting for market share in the strongest sector in the economy. Why? Because US residential real estate is valued at $39.3 trillion, which is nearly double the 2019 US GDP ($21.4 trillion) and it is the nation’s most valuable asset. It is followed by equities at $37.2 trillion and commercial real estate at $20.4 trillion. With so much value in residential real estate and it being an industry that dodged disruption for a long time, Wall Street and Silicon Valley will continue to create and fund disruptors until they can figure out how to turn a profit.

    Compass:

    Compass, one of the fastest-growing real estate firms in the country has made a lot of waves over the past few years spending big money on advertising and up to $250,000 agent signing bonuses. CEO, Robert Reffkin has raised millions from investors like Softbank, Opendoor’s biggest investor before going public. Compass is spending money buying tech companies and Realtors. They recently filed their IPO and showed that despite bringing in $3.7 billion in revenue in 2020, it had a net loss of over $270 million. The filing notes stated, “may not be able to achieve profitability and we may continue to incur significant losses in the future.” Reasons given are market expansion costs, declines in real estate sales, and increased competition in the market. Compass is counting on its tech investments to drive profits.

    Opendoor:

    On its recent earnings call, CEO Eric Wu said that Opendoor’s offer requests have increased 50% year over year. By the end of 2021, Opendoor will have doubled number of markets and will continue entering new markets, with a goal of being in 100 markets and serving 70% of US homes. In order to gain market share the company has expanded its buy box and is continuing to build its vertical integration by offering title, escrow, and mortgage services along with traditional brokerage services.

    REX’s Lawsuit:

    On Tuesday, discount brokerage, REX, filed an anti-trust lawsuit against Zillow, Trulia, and NAR. The company charges roughly 2% commission, 1% goes to the brokerage and 1% to the listing agent. It is not a member of any MLS and does not pay buyer’s agents a commission. REX markets all of its listings online, including on Zillow and Trulia. The complaint states that NAR’s rules, enforced by the MLSs, requires that a seller pay a buyer agent’s commission. Now that Zillow is also a licensed brokerage it has joined the MLSs and must follow local MLS rules. As Zillow has adjusted its platform to be compliant, non-agent listings are now in a different section from the agent-represented listings. Zillow’s spokesperson said Zillow’s goal is to change the MLS rules so that all available listings would be located in one place on the site, allowing for easier searching. However, currently, the MLS does not allow for that.

    National Real Estate:

    Nationwide there are just under 318,000 active single family listings, a 55% decrease year over year.

    One of the reasons for our low inventory nationwide is due to the low interest rates we have had for over 10+ years. 5% in 2009 was a record low. While our housing market recovered slowly after the Great Recession, many people moved up but kept their previous homes as rentals. Since 2013 about 7 million single family residences have become rentals, removing their availability from the resale market.

    The supply to demand imbalance continues to push up sales prices and more properties are selling for over asking than ever before. Nationwide we hit a record low for the amount of homes taking a price reduction, the average is about 35% of active listings have at least one price drop before going under contract. Today it is just under 17%.

    The AZ Market:

    Here in Phoenix 44% of sales in the past 30 days closed over asking.

    Greater Phoenix has fewer than 3800 active listings and only 2700 active single family homes available which explains our 19.5% year over year appreciation.

    Join us today for a Zoom meeting at 11am for a deep dive in the Greater Phoenix market with Tina Tamboer with the Cromford Report. To register, click here.

    Lending:

    Mortgage interest rates tend to follow the 10-year treasury yield so it is often used to predict mortgage rates. This chart shows them moving together for the past 50 years.

    Going deeper, here they are for the past 10 years. The 10-year treasury rate has been increasing since October and interest rates only started catching up in February. An increasing treasury rate means a growing economy because as the treasury rate goes up, investors become more confident in the market.

    Last week purchase mortgage applications were up 7% week over week and 2% year over year. Demand remains higher than supply, both nationally and locally. It is impressive that applications increased when rates have increased as quickly as they have. A big reason for the continued demand, according to several leading economists, is based on today’s demographics. The largest group of the largest generation is about 26-34; prime home-buying age. These ‘Replacement buyers’ as some call them, will keep demand high through the end of 2024.

    For forbearance and foreclosure news, check out my update and video from Wednesday, here.

    Real Estate News:

    • UWM, the country’s largest wholesale lender recently announced it will not work with mortgage brokers who work with Rocket Mortgage or Fairway Mortgage. Does this set a precedent of big companies stating, “If you do business with them, I will not do business with you.”?
    • Walmart is partnering with Ribbit Capital, a fintech investment firm to create a new fintech that will offer “innovative and affordable” financial products. They even hired the head of Goldman Sachs’ consumer unit to run it. This is in addition to Walmart’s debit, credit, and check cashing services. While they haven’t specifically said they are going into mortgages, many experts in the field believe that is exactly what Walmart is creating, affordable mortgages.
    • Two weeks ago Federal judge in Texas ruled that the CDC’s eviction moratorium is unconstitutional. The court stated that Congress lacked the authority to give the CDC power to halt evictions, and that the moratorium infringes upon landlords’ rights under state law. The DOJ promptly filed a notice to appeal the ruling.
    • Initially created for apartment complexes, SmartRent (based in Scottsdale), which offers home technology services just announced a $31 million partnership with home builder, Lennar. One of SmartRent’s features is self-guided tours which allows the perspective buyer to tour the property at any given time (scheduled a little as 1 minute ahead of time, online). The company’s website states this allows builders longer tour hours and reduces a builder’s Realtor costs.
    • Another commercial property management company, Jones Lang LaSalle, is getting into the single family rental market.

    Final Thoughts:

    Logan Mohtashami of HousingWire said, “Once schools are open again, parents will be free to re-enter the job force: By September 2022 or earlier, we should have regained all the jobs lost to COVID-19. These positive economic factors warrant higher mortgage rates as we are no longer in recession in America. Now, we want to get all the jobs back that COVID-19 took from us.”

    Please share this with your colleagues and clients.

    Copyright 2021 by Sarah Perkins

  • Greater Phoenix Real Estate Update 3/5/2021

    Today is all about the AZ market. Recently, Lawyers Title hosted a presentation with Tina Tamboer with the Cromford Report. She always shares pertinent and timely information. Below I have combined a lot of her information from her presentation, along with additional information from my research.

    What affects supply?

    • New Homes
    • FSBOs
    • Appreciation/Depreciation (equity)
    • Foreclosures/Household Formation (shrinking)
    • Relocation (Outbound)
    • Divorce/Illness/Death/Job Losses/Tragedy
    • Consumer Sentiment

    What affects demand?

    • Interest Rates
    • Appreciation/Depreciation (affordability)
    • Relocation (inbound)
    • Employment/Income
    • Loose/Tight Lending Practices
    • Population Growth
    • Household Formation (growing)
    • Consumer Sentiment – this could be the most important of them all.

    What affects luxury demand?

    • Stock Market Performance
    • Corporate Profits
    • Exchange Rates
    • Consumer Sentiment

    Employment:

    • Initial and continuing unemployment remains elevated but has dropped more quickly than experts initially predicted.
    • We still need to drop again by 50% in order to get to where we were a year ago.
    • The pandemic has negatively affected low-income earners and renters far more than it has homeowners, which is why despite the high levels of unemployment real estate continues to be the strongest sector in the economy.
    • Mid-level managers had the highest initial claims, according to the most recent update.

    Forbearance:

    There are people who think it will be raining homes when the forbearance period ends. This is not going to happen.

    Every 3 months we see an improvement, as more borrowers exit their forbearance plans. But the past few months have been flat. Hovering around 2.6 million borrowers in a plan.

    Foreclosures:

    What happens with the moratoriums are lifted? We will see a wave of foreclosure filings but not of short sales. After 18 months of no foreclosures, there will be a backlog. According to KCM, on average nationwide there are about 69,000 foreclosure a month, during normal times.

    When the foreclosures are filed, homeowners will likely sell as they have equity, which is why we will not see short sales. The vast majority of borrowers do not have loans greater than the value of their house. Tina expects that we will not see a lot of properties actually being foreclosed upon because the owners can easily sell.

    This will not be a big issue nor will it last very long. It is more about pent-up demand than it is about a wave of foreclosures. These homes will be absorbed quickly and will not have a negative impact on prices.

    Stock Market Performance:

    This impacts the luxury market which has been crazy busy because the stock market is doing so well.

    There was a pause in March, a dip at the election, and then a slight drop for Gamestop and now we have a nice smooth curve. Things are looking good and driving nice corporate profits.

    iBuyers are also impacted by the stock market.

    Population:

    AZ is in the top 3 states for population increase along with Texas and Florid. This shows population changes from July 2019 to July 2020.

    CA lost 70,000 residents. This is the first time it has had declines 150 years.

    LA has been the #1 spot for AZ’s inbound migration for 20 years. This chart shows where people are searching from only.

    Several moving companies share the data of the moves they service. They are all slightly different but show consistent trends. Arizona is usually in the top 5 for inbound relocations nationwide.

    This shows the most people coming here are still coming here to retire. The 55+ group got larger.

    63% of the inbound migration have an annual income of $100,000 or more.

    We are on the low side of international inbound. It is nearly all domestic migration.

    Household Formation:

    Household formation creates demand. In 2020 household formation spiked across the country. The work from home movement drove this train. Now you don’t need to live where you work so people left and got their own space. When you can live anywhere the world opens up.

    Affordability:

    The ideal range for housing affordability is 60-75. Through Q4 2020 in Phoenix someone earning the median income, they can afford 60.6% of what is for sale. In LA it is 9.1% and San Francisco it is 11%.

    Taxes:

    Why are all of the rich people coming here? It only took the threat of CA increasing the income tax from 13% to 16% to create a mass exodus. It created a wealth flight. High tax states are seeing outbound migration to lower tax states.

    Outbound states: CA, IL, NY, NJ

    Inbound: AZ, TX, FL, ID

    Business taxes, corporate taxes, individual income taxes, sales taxes, and property taxes are

    are the highest in those outbound states. AZ, while not the lowest in all of those, competes for being quite low in most of those. Sales tax tends to be the highest because it is the easiest to raise.

    Where are all of the rich people going?

    Maricopa county association of governments, shows demographics, click here for the demographics map. Density is increasing in new luxury areas. South Chandler, a lot of Gilbert, east Mesa, and South Mountain are getting bluer. Showing new emerging luxury markets.

    Job Centers:

    Jobs are created by freeways. The heavier the employment area the bluer. A lot of job growth, biomedical, and tech fueling demand, bringing in people who make a lot of money. Click here for the interactive map.

    The Cromford Market Index:

    Available on the main page of the Cromford Report: http://cromfordreport.com/ (without a subscription)

    • 100 is balanced and prices rise at the rate of inflation, below 100 is a buyer’s market, above 100 is a seller’s market, prices drop below 90, prices rise at 110.
    • On 2/5/2020 we were at 215.1
    • On 3/20/2020 we were at 241
    • On 5/15/2020 we were at 145.2
    • Yesterday we were at 513.6.
    • Prior to this run, the previous peak was 312.9 in the spring of 2005.
    • CMI is the predictor, it moves first and then appreciation follows. Cannot predict the CMI.

    At balance, or 100, values rise at the rate of inflation. We are not at balance. Demand is 18% above normal. Supply is 77% below normal.

    Demand is now dropping faster than supply. The CMI slows as demand decreases. When the index goes flat prices do not drop. Supply remains shockingly low.

    In order for prices to stop rising, the CMI has to be at 100. If it starts on the way down, prices rise more slowly. When will it go down? We can’t know that until it stops rising. In order for prices to start dropping we will have at least 8 to 10 months and that is only after the CMI stops increasing.

    What will slow it down? Affordability.

    Tina thinks we have dropped below 60, the level of demand doesn’t start dropping until we are below 60. How long will it take to get to lower demand? It could take months, who knows. Demand, once it goes to the low side of normal and then we will see supply go up.

    Property values will not go down. As long as demand is above supply, prices rise. When demand and supply come together, below balance, transaction volume declines.

    Appreciation: 

    Prices have increased 22.5% year over year, is it really a good time to buy? It is always a good time to buy in a seller’s market and it is good for sellers to sell in a seller’s market. Buying and selling in a seller’s market is winning.

    Interest rates have impacted affordability. Payments have gone up $72 for an increase buying power of $77,000.

    Rents:

    Rents are more expensive than mortgages. Rents are rising quickly. The median house rents for $250 more a month than the going rate for a mortgage for the same house.

    Rents are rising = not a bubble, rents decline due to false demand. Rents are declining in San Francisco while houses are still rising, equating to false demand. San Francisco could be considered over-valued.

    Supply:

    Supply is down 54% year over year. The end of forbearance plans (summer 2022) will have little impact in adding supply. All price points are down.

    This year is lower than last year and last year was a record. We do not have enough coming in to maintain supply.

    Population Growth and New Builds:

    We overbuilt for 10 years before we started underbuilding for another 10 years and population growth outpaced building. In 2019 we ate up the last of the glut of housing.

    Developments:

    Without new listings we have to look at new construction which is a challenge due to labor shortages and lumber prices are up 170%, adding, on average an additional $16,000 in cost to the average new build.

    Most developments are going into the south and west, due to cheaper available land. Very little in the north. Values are increasing the most in the north. Click here for the interactive map.

    Single Family Permits are Up!

    • Avondale at 428% year over year.
    • Coolidge at 182% year over year.
    • Glendale at 123% year over year.
    • Casa Grande at 84% year over year.

     Multi Family Permits are Up too!

    • Overall increase of 28% year over year.
    • Mostly they are not for sale, build to rent movement is huge.
    • Gilbert is up 434% year over year.
    • Mesa is up 236% year over year.
    • Chandler is up 142% year over year.

    Demand:

    • 50% of all accepted contracts were on the market for only 6 days.
    • Contract activity is booming.
    • Busiest February ever.
    • As of 2/26 there were 12,072 properties in escrow. Normal is 10,000.
    • In February, the contract ratio was 239, meaning for every 100 active listings there are 239 in escrow.
    • In 6 weeks, many areas moved from $200,000 to $300,000 for average sales prices

    Final Thoughts:

    • Supply is down 59% from last year.
    • New listings, year to date, are down 11% from last year.
    • Demand is 18% above normal.
    • Sales prices are not going to decline this year.
    • There will likely be fewer sales in 2021 than in 2020 due to the low inventory levels.