Category: National Real Estate

  • Greater Phoenix Real Estate Update 7/23/2021

    Real estate continues to normalize and shift from an extreme seller’s market to a less extreme seller’s market. Both the leading and lagging real estate indicators illustrate a slowly moderating housing market. The numbers show that things are changing, nothing is happening too quickly, so the movement is relatively healthy and going in the right direction. Buyers have more options and sellers are making some concessions.

    Yet we face a lot of unknowns. Is this inflation truly transitory? Will the mid-September expiration of the expanded unemployment benefits drive employment growth? How many houses will actually be foreclosed on once the foreclosure moratorium is lifted on 7/31? And how long will that process take? How many renters will be evicted once the eviction ban is lifted on 7/31? What will the proposed infrastructure bill actually look like and how much will go to housing? When will the Fed taper its MBS purchasing? What about the rising COVID numbers?

    Economy:

    In a recent podcast, economist Dr. Peter Linneman discussed real estate and the economy with Willy Walker with Walker & Dunlop, a large commercial lender. These are some of his main points:

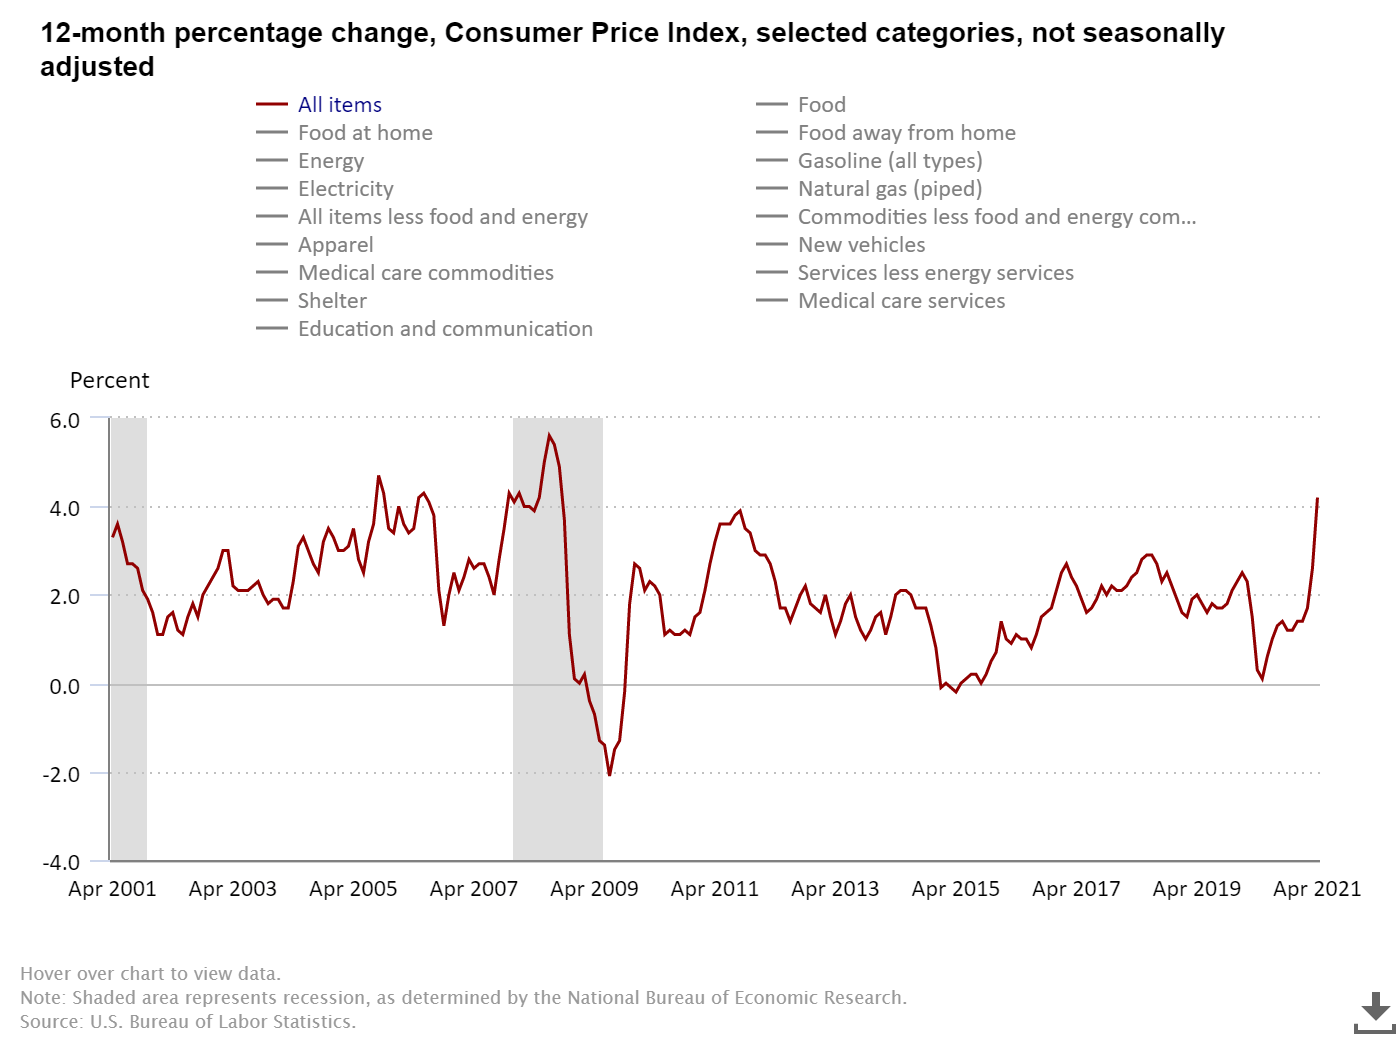
    • Consumer inflation is transitory because inflation was negative last year. However, asset inflation has been significant for nearly a decade. (Greater Phoenix housing bottomed out in August of 2011 and homes have been appreciating since September of 2011.)
    • Expect huge employment growth in September, and not before then, because the additional $300 a week in COVID unemployment benefits expires on 9/6/21.
    • In 2020, about 300,000 Americans inherited $50,000 or more; 3 – 10 years earlier than expected due to COVID deaths. This created a large group of unplanned home buyers who otherwise would have waited years for the down payment funds.
    • While he agrees with many other housing experts that we have been under producing for well over 10 years, he disagrees with NAR which states that nationwide we are short 6.8 million units, he thinks the deficit is closer to 3 – 4 million units. Ivy Zelman thinks it could even be closer to one million. He said in multi-family our deficit is about 700,000. All reasons for continued price increases as long as demand remains, but not a dire situation.
    • Expect another era of roaring 20s. There is a lot of money in the system and not a lot of reason to pull it out, if greed turns to fear there will likely be a correction. Rates will stay low, the Fed will not raise them because they need to keep Federal debt cheap so the government can afford the debt. Additionally, he does not see the Fed tapering its monthly bond and MBS purchases. It has kept the market very liquid. The growth may slow but will stay positive.
    • We need to expand to capacity. Supply is lagging. During the pandemic lockdowns, we continued to consume but did not replace what was consumed. This expansion will drive growth and the roaring 20s, though it will be bumpy. The growth will not last forever, do not fight it, asset ownership will create wealth, spend wisely.

    National Real Estate:

    • According to NAR, the median existing-home sales price is up 23.4% year over year and after four months of declines in sales, in June, existing home sales increased by 1.4% from May.
    • The frenzy is calming and the sky rocketing, year over year appreciation rates are just starting to slow.

    “At a broad level, home prices are in no danger of a decline due to tight inventory conditions, but I do expect prices to appreciate at a slower pace by the end of the year. Ideally, the costs for a home would rise roughly in line with income growth, which is likely to happen in 2022 as more listings and new construction become available.”

    -Dr. Lawrence Yun, NAR Chief Economist

    “Supply has modestly improved in recent months due to more housing starts and existing homeowners listing their homes, all of which has resulted in an uptick in sales. Home sales continue to run at a pace above the rate seen before the pandemic.”

    -Dr. Lawrence Yun, NAR Chief Economist
    • Total inventory is up nationwide, giving buyers welcomed relief with slightly more options as inventory levels remain low.

    The AZ Market:

    • New home sales declined by 16% from June to July, yet strong demand remains.
    • Single family rents increased by 6.6% in May, year over year. Phoenix once again saw the largest year over year price increase at 14% followed by Tucson (11.1%) and Las Vegas (10.7%).
    • Arizona tourist spending declined by 41% in 2020 from 2019. In order to boost tourism, Governor Ducey recently announced the Visit Arizona Initiative which will utilize $101.1 million of federal relief funds.

    New Construction:

    Builder confidence, while still very high, declined by one point to 80 in July due to ongoing labor shortages and the high prices of materials.

    New construction mortgage applications declined by 3% in June from May and was down 23.8% from last year. 2020 was the biggest new construction year since 2006.

    In June, new single family starts are up 6.3% from May and up 29.1% year over year. Which is good news as completions were down in June by 6.3% from May.

    “In other words, builders aren’t hedging long-term plans on short-term improvements after the past year of pandemic challenges. As factors like materials costs stabilize over the next three months, buyers may start to see some inventory and price relief in the new construction market.”

    -George Ratiu, Realtor.com Senior Economist

    Lending:

    The adverse market fee, which was a 0.5% fee added to Fannie Mae and Freddie Mac refinances, has officially been axed. Starting August 1, the FHFA will no longer collect this fee. This is welcomed news for borrowers and the mortgage industry.

    In June, second-home mortgage rate locks declined by 11% year over year. Much of the decline is attributed to Fannie Mae’s and Freddie Mac’s cap on second home and investment property mortgages at only 7% of total loan volume.

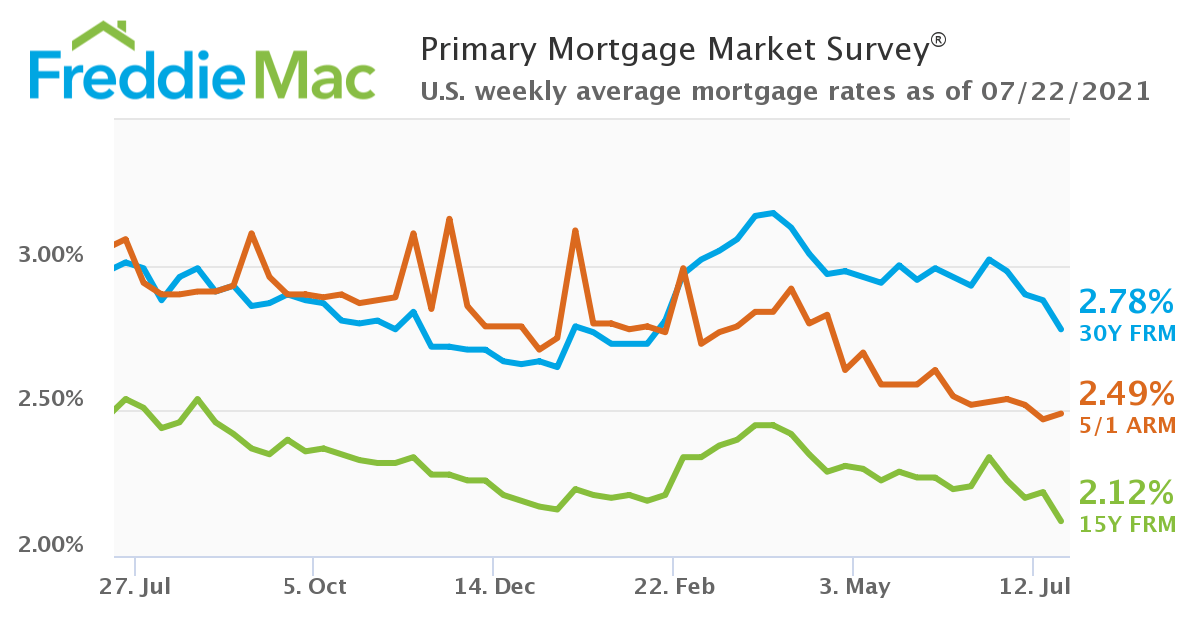
    Mortgage rates dropped again, and the 15-year mortgage reached an all-time low.
    Despite money being so cheap, cash purchases are on the rise. Through April of this year, 30% of purchases are with cash, up from last year’s 25.3%.

    Real Estate News:

    • In 2019, Blackstone, an investment management company with $649 billion in assets, attempted to exit residential real estate investments when it sold its interest in Invitation Homes. The exit did not last very long, in May Blackstone announced the roughly $1 billion purchase of 5,800 apartments in San Diego County with the promise to keep rents affordable for tenants earning 80% or less than the area’s median income. In June, Blackstone announced a $6 billion purchase of Home Partners of America which owns more than 17,000 single family rentals across the country. And this month Blackstone announced a $5.1 billion acquisition of AIG’s affordable housing assets. With over $12 billion in residential real estate investments announced in the past 60 days, Blackstone is back in a big way.
    • In addition to Opendoor’s existing Agent Partner Program, it just announced a second Realtor referral program, Agent Access, which pays out a 1% referral fee plus bonuses ranging from $1,000 to $10,000 based on total number of referrals sent. Opendoor Partner Agents are not allowed to participate in Agent Access.
    • Last Friday, Cloudstar, a data security provider and cloud-hosting company, fell victim to a sophisticated ransomware attack. Its 42,000 users including hundreds of title and escrow companies, currently do not have access to secure documents as everything was taken offline. The company is currently working with forensics experts and law enforcement as negotiations progress.

    Final Thoughts:

    Throughout the rest of the year, expect a further weakening of the seller’s market. The declining affordability and buyer fatigue combined with increased inventory are leading us towards a more normal, balanced market. When housing is more balanced, it is not quite as exciting, but it is much healthier and allows for long-term growth. It is time for the calm after the storm.

    Copyright 2021 Sarah Perkins

  • Greater Phoenix Real Estate Update 7/2/2021

    The market is softening = slowing = normalizing = moving closer to balance which are all good things even though it feels weird. After the wild ride of 2020 and the nearly non-existent inventory levels of Q1 2021, the real estate market is working out its kinks. I have mentioned it before and will say it again, it is impressive what a person can get used to. We got used to 10 or 15 buyers for each listing. We even (kinda) got used to only 4,000 active listings (when we should have 25,000). Now we have to prepare today’s buyers and sellers (and ourselves) for another new normal, a much healthier one.

    National Real Estate:

    Existing home sales declined again for the fourth consecutive month in May but the rate of decline is slowing. Sales are down by nearly 1% since April and 14% since February to a seasonally adjusted rate of 5.8 million units. In 2020 there were 5.64 million existing home sales. Low inventory, falling affordability, and buyer fatigue are blamed for the declines. Sales are nearing pre-pandemic levels as the market continues to normalize and the pent-up demand from last year is exhausted.

    Speaking of falling affordability, the median existing-home price for all housing types in May was $350,300, up 23.6% from May 2020 ($283,500). This is an NAR record high and marks 111 straight months of year-over-year gains since March 2012.

    Pending home sales increased by 8% in May, month over month, after declines in April. The increase is attributed to the low interest rates and increasing inventory. Nationally, active inventory is up by nearly 16% since February.

    New Construction:

    New construction sales declined by 5.9% in May month over month, to an annualized rate of 769,000 units. This is the second month in a row of declines, April also had a 5.9% decline in new home sales. Rising sales prices combined with lumber, labor, and material shortages are blamed for the decline.

    Meanwhile, housing starts increased by 3.6% during the same time period putting new construction inventory levels at 5.1 months. When inventory levels are 4.3 months or less builders are happily building, when inventory levels are 4.4 to 6.4 months builders need evidence of sales growth to continue building, and at 6.5 months or more builders slow or even stop production. Builders only build houses they know they can sell.

    The new construction sales chart below shows the initial declines in sales followed by a giant increase and the recent declines from that peak level.

    The AZ Market:

    Here in Greater Phoenix, when it comes to real estate, everything is magnified. In 2008, when the market crashed, as a country values declined by 25%. Phoenix saw 45% declines. Today, as the entire country sees 23.6% year over year appreciation, Phoenix’s appreciation rate reached 33%, year over year. It should come as no surprise that as the market normalizes, Phoenix is normalizing faster. Inventory is up nationally 16% since February, in Phoenix, it is up by nearly 28% since February.

    May’s Case-Shiller Home Price Index was released on Tuesday. For the 11th month straight, the US has seen price gains. In May it was 15.4%, year over year, the highest reading in over 30 years. Greater Phoenix has topped this chart for the past 23 months and in April came in with a 22.3% year over year price gain. Case-Shiller is what the federal government, national builders, and Wall Street use to gauge price appreciation.

    Cities like San Francisco and New York had huge rental declines. Not only do Phoenix and Tucson top the charts for rental appreciation but four valley cities are in the top 10 fastest growing rents since March 2020.

    ShowingTime’s latest data shows that home showings saw an unusual dip in May, which could indicate further market stabilization. Nationally, showings usually peak in April and remain high through June. In AZ showings slow in the summer more than other parts of the country. We are currently running 32.4% below this time in 2019 and 24.4% below this time in 2020. (Phoenix declines were larger than the national declines)

    Evictions, Foreclosures, and Forbearance:

    Last week the CDC extended the eviction moratorium through the end of July and stated, “this is intended to be the final extension of the moratorium.” On Tuesday the Supreme Court denied the requests to lift the nationwide eviction moratorium filed by the Alabama and Georgia Realtor associations last November. Justice Brett Kavanaugh agrees that the CDC overstepped its authority by issuing the ban but denied the request. The Supreme Court will frown on any further extensions without congressional approval.

    Last week the foreclosure moratorium was also granted a final extended for another month, now set to expire on July 31. On Wednesday the CFPB announced its final ruling on how mortgage servicers are to handle foreclosure proceedings. Only those borrowers who do not qualify for assistance, fail to meet the assistance agreement, who are unable to be reached, or the home has been abandoned are able to be foreclosed on once the moratorium is lifted. Servicers must contact delinquent borrowers prior to foreclosing to offer loss mitigation plans. The rule goes into effect on August 31 which likely means that servicers will not be able to initiate foreclosure proceedings until the end of the year. For more information on the CFPB’s ruling and forbearance info, check out my AZ Forbearance Update from Wednesday, here.

    Lending:

    Rising sales prices likely caused the 5% week over week decline of purchase mortgage applications last week. They are also down by 17% year over year.

    Ginnie Mae announced a new 40 year mortgage term option created for struggling borrowers in order to lower their monthly payments and keep them in their home. The product will be available in October and will be sold on the secondary market.

    New Laws:

    • Within hours of the June 23 Supreme Court ruling, stating that the FHFA’s structure is unconstitutional, giving new power to the president to fire the head of the FHFA, the White House announced plans to replace Mark Calabria, the head of FHFA. Calabria then resigned and by the end of the day, Sandra Thompson was appointed as acting director of the FHFA. Her appointment will likely lead to more policy change and diminishes the likelihood of Fannie Mae and Freddie Mac’s exit from conservatorship. The irony behind this activity is that this lawsuit was brought by investors hoping to end the conservatorship so profits would flow to the investors rather than the government. Thompson’s appointment all but guarantees that Fannie and Freddie will remain in conservatorship for years to come.

    Real Estate News:

    • Not only are consumers using cryptocurrency to buy houses, now people are talking about utilizing non-fungible tokens (like crypto, stored on blockchain ledgers) for homeownership. This NFT-ing of real estate would allow the ownership of a home to be held in one digital wallet which opens up new options for fractional ownership.
    • A credit card provider says it’s partnering with landlords, like Blackstone and Lennar, to help provide “every young person a path to homeownership” by allowing them pay their monthly rent with a credit card, and apply the points they earn to making a down payment on a home. (I am not sure this is best idea)
    • Offerpad is now a mortgage broker. Offerpad Home Loans is licensed in AZ, CO, and AL and plans further, rapid expansion. Will they offer seller carrybacks? If so, the impact to traditional lending could be significant by nearly eliminating appraisals and other typical loan application steps required by traditional lenders.
    • Yesterday the Department of Justice withdrew the proposed settlement and the lawsuit it filed last November against NAR. The settlement for the antitrust lawsuit required NAR to repeal or change several rules regarding buyer agent commissions. The DOJ plans to refile the suit at a later date.

    Final Thoughts:

    Elliott Pollack wrote on Monday, “The impacts of supply and demand imbalances continue to be on full display in each weekly release of economic data. Consumer spending on goods has been hampered, not by lack of demand, but rather bottlenecks in production and the supply chain. Demand has stayed incredibly strong due to pent-up savings, and is driving up prices, with housing at the forefront. Fortunately, with continued vaccinations, more and more of the economy has reopened and spending will shift from goods towards services. This will help drive the country toward full economic recovery and will bolster those industries hit hardest such as food services, tourism, and hospitality.”

    Copyright 2021 Sarah Perkins

  • AZ Forbearance Update 6/30/2021

    In this 19 minute video, Lydia Wietsma and I discuss the latest in forbearance, extensions, and tax liens. We share this information to help provide guidance for real estate professionals and struggling borrowers.

    Deadline & Extensions:

    There is a lot of news around forbearance right now. Today is the final day to get started on a forbearance plan. At the end of the day, no new forbearance plans will be created.

    Do not confuse the end of forbearance with the other moratoriums that were extended last week. Both the eviction and foreclosure moratoriums were extended for one more final month. Those moratoriums will expire at the end of July.

    Forbearance Numbers:

    The forbearance numbers continue to decline. About 3.93% of mortgages or roughly 2 million borrowers remain in a plan after 17 weeks of declines.

    Forbearance by Stage:

    • 10.7% of borrowers are in the initial stage. Initial requests this week dropped to their lowest rate since forbearance plans started 15 months ago. According to Mike Fratantoni, MBA’s senior vice president and chief economist, the pace of new forbearance requests remained at an acutely low level of 4 basis points or 0.04% of borrowers.
    • 83.1% of borrowers are on extension, down from recent weeks.
    • 6.2% of borrowers are re-entries, up from recent weeks also.

    Forbearance Exits from June 1, 2020 through June 20, 2021

    45.2% of borrowers continued making their payments, got caught up upon exit, or paid off the loan with a refinance or sale upon exit. This number continues to decline slightly each week.

    15.2% of borrowers exited their forbearance plan still behind on their payments and without a loss mitigation plan in place.

    Even with the end of forbearance, borrowers still have options. Black Knight estimated that of the loans in forbearance, 96% have at least 10% equity in their homes – typically enough to sell through traditional real estate channels to avoid a default or short sale.

    CFBP:

    On Tuesday, the Consumer Financial Protection Bureau (CFPB) extensive mortgage servicing regulations it hopes will prevent “unwelcome surprises” for borrowers exiting forbearance.

    The CFPB outlined the rules for mortgage servicers to follow in the coming months and them, “Unprepared is unacceptable.”

    Servicers may initiate foreclosure proceedings only after the borrower has submitted a loss mitigation application, and either isn’t eligible for, breaks or rejects the loss mitigation plan. If the borrower was already six months past due by March 2020 or if the property is abandoned, the loan servicer is exempt from those requirements.

    The CFPB rule also outlines escrow shortages which can be included in the loss mitigation option. There are limits on how much servicers require borrowers to deposit in an escrow account over the next year.

    Lenders and servicers may offer streamlined loan modifications, as long as the modification does not increase the monthly payments, or increase the mortgage term beyond 40 years. Servicers may not charge extra fees for the loan modification, and if a borrower accepts a loan modification, the servicer must waive any late fees.

    The CFPB wants servicers to be proactive about communicating with borrowers about their options, especially if they are not in a forbearance plan.

    If borrowers are still delinquent, servicers must contact them ahead of the end of their forbearance period to give them the option to complete a loss mitigation plan.

    Finally, the rule adds clarity to the definition of financial hardship to mean any hardship that the pandemic brought on, either indirectly or directly, from March 2020 to February 2021.

    The rule will take effect at the end of August.

    To learn more about the CFPB, submit a complaint, or better understand borrower protections visit https://www.consumerfinance.gov/

    Servicers, BPOs, and Tax Liens:

    BPO requests are up. 15 new ones last week and 16 so far this week. Lydia is not only giving a statement of value but is also checking the exterior condition and whether or not the property is vacant.

    In addition to the regular BPO visits, she is also being asked to deliver tax lien letters to homeowners that do not have a mortgage but are behind on their property tax payments. Tax lien foreclosures have also been suspended and will resume when the moratorium is lifted.

    Buyers and sellers need to let their Realtor know if they have done a forbearance on any property in the country. It is not something that can be just swept under the rug and it is not something to be ashamed of. As inventory grows strategies change. Forbearance was created to keep people in their homes and has been successful at doing so.

  • Greater Phoenix Real Estate Update 6/18/2021

    The real estate market continues to shift and change, slowly moving towards normalization. Prices continue to increase, demand is slightly subsiding, and inventory is growing (and has a LONG way to go). The intensity is cooling (from 500 degrees to 350 – its still HOT), and fatigued buyers are writing fewer offers before one is accepted. The headlines attempting to explain the still very hot, yet cooling market seem to be causing more confusion than clarification.

    National Real Estate:

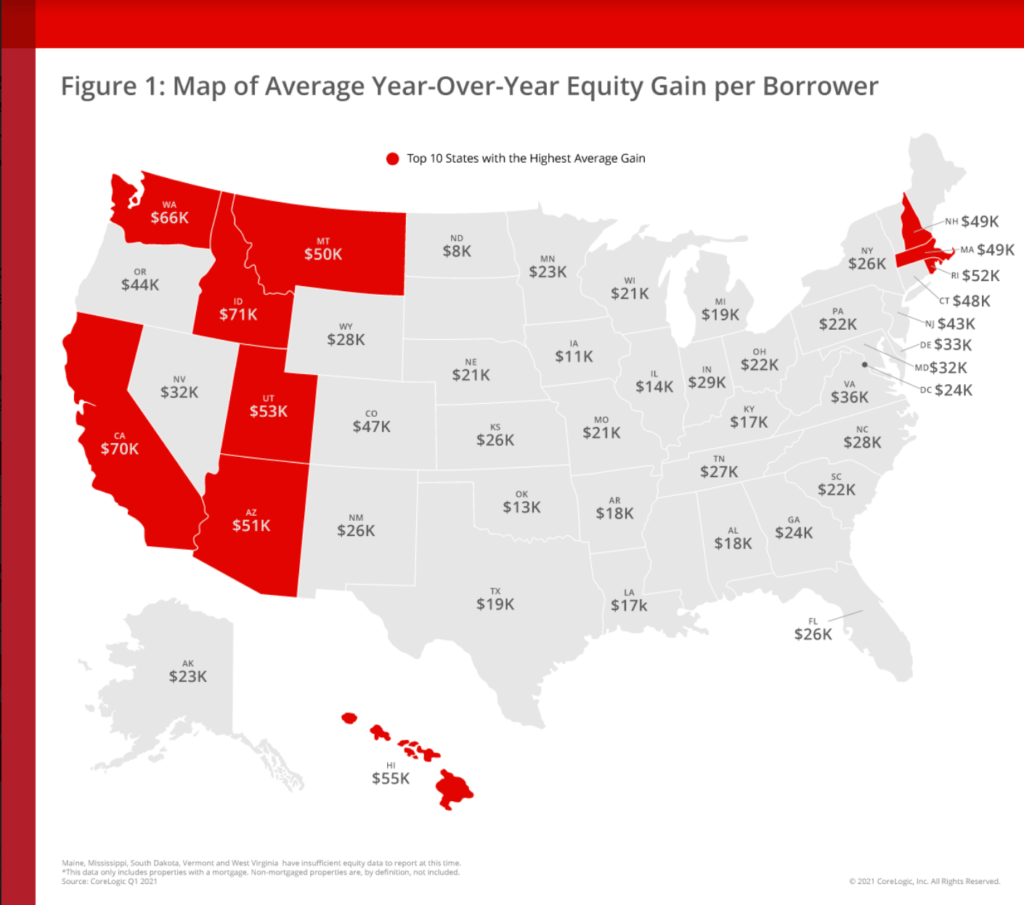
    A recent report from CoreLogic states that homeowners gained $1.9 trillion in equity in Q1 2021, which is a year over year increase of 19.6%. Going deeper that breaks down to an increase of $33,400 in equity per homeowner and is the highest gain in over 10 years. Arizona’s year over year average equity increase is $51,000!

    Demand is slowing and the market is cooling. Pending sales are down (4.4% in April from March). Mortgage applications are down 7% from the average levels from January and February 2020. Redfin’s demand index is down 12% from the peak in late March. These shifts are not a bubble bursting but gradual changes towards a more normal market. Given the extreme imbalance during the winter and spring, it will take well over a year before we have a balanced market.

    Active single family inventory climbed another 3.8% this week to 342,000. That’s now up 11% from the bottom on April 30, but still 51% lower than this time last year when inventory started falling 1-2% a week.

    The Altos market action index is another tool to gauge demand. Any reading above 30 is a seller’s market. The notable change is that the weekly reading (dotted line) dipped below the 90-day rolling average for the first time all year. This shows that the market is not getting hotter from here but is still very hot.

    The AZ Market:

    -For a deep dive into the Greater Phoenix market, join us on June 22 for a Cromford Market Update with Tina Tamboer. For details and registration, click here.

    -Greater Phoenix’s median monthly appreciation rate has declined by maybe 1%, down to 31% year over year. (yes, you read that correctly) Healthy appreciation is 3-6%. Today’s huge appreciation rates are due to low inventory levels and not super high demand. Demand remains solid but is only about 7% above normal.

    -Inventory levels in Greater Phoenix have increased by 10% since the end of May, matching listings counts from the end of January.

    -Habitat for Humanity is building its first 3D printed house in Tempe. The goal is to expedite the building process while reducing labor and construction costs. About 70% of the building will be printed and the remaining 30% will be built through traditional construction. The selected family will move into the 1,600 square foot, 3 bedroom, 2 bathroom home this fall.

    -In Q1 2021 the Maricopa County Assessor’s Office received twice as many construction permit requests as in 2019 and 2020. A total of 19,232 residential and commercial permits were requested. This increase was expected.

    “[We’ve] been seeing this trend now for a number of years, so I think we’re all scaling toward that. It wasn’t like one day the door got opened and a flood of water just rushed in, this has been just kind of a growing trend that we’ve been monitoring over the last several years.”

    – Eddie Cook, Maricopa County Assessor

    -NAR has identified both Phoenix and Tucson as top 10 commercial real estate markets in 2021.

    Phoenix took the top spot in Origin Investments’ machine learning database that identifies cities with “promising fundamentals for success.”

    New Construction:

    Lumber prices have declined by 40% since early May. Timberland industry executives, from several different companies, have been selling off company stock at unusually high rates indicating that Wall Street expects lumber prices to continue to decline.

    “This level of selling is simply unusual and to have this type of alignment among peers like this is unusual. It shows a consensus within the group about how they are thinking about their stock prices.”

    -Ben Silverman, director of research at stocks analytics firm InsiderScore

    The speedy price appreciation of not only lumber but appliances and other materials needed for new construction slightly reduced June’s builder confidence rating to 81 in June, from 83 in May, the lowest level since August 2020. Ratings over 50 reflect strong market conditions.

    Nationwide, single family housing starts increased by 4.2% from April to May while completions were down by 2.6% and permits declined over the same time period.

    Housing Shortage:

    According to a recent NAR report, construction declines over the past 30 years has created a 5.5 million unit housing shortage nationwide. NAR is calling for a “major national commitment” for more building of all housing types, especially for more affordable housing units. To close the gap, builders will have to build 2 million homes a year for the next 10 years. When you combine the underbuilding count with housing demolition (intentional or disaster) the shortfall grows to 6.8 million units.

    NAR is asking the government for help. It will take federal policy to increase the rate of construction to the levels needed. Builders build homes to make money and after the 2008 crash, builders are even more careful with the bottom line. When interest rates rise, new construction takes a bigger hit than resale. In 2018 when mortgage rates moved up to 5%, new construction inventory grew to 6.5 months and builders stopped building. When rates declined in early 2019 inventory declined and builders started building again. When rates increase or demand declines, what will keep the builders building?

    “Unless the government steps in to build when new home sales demand gets soft, we will not add homes to the builders’ demand algorithm. Builders have learned to tightly control inventory by retreating from construction when demand becomes slack. Building more homes is bad business during weaker times.”

    -Logan Mohtashami, HousingWire’s Lead Economist

    Rentals:

    The average size of apartment units under construction is 50 square feet larger than the average apartment unit built over the past five years. The new units allow space for a home office.

    In May, the median rent for multifamily properties increased by 2.5% year over year, matching the growth rate of March 2020. At 9.6%, Phoenix had the second-highest multifamily rent growth behind the Inland Empire, CA. San Jose, San Francisco, and NYC still have negative growth but are improving.

    In April, single-family rents grew by 5.3% nationwide, more than double the April 2020 growth (2.4%). Phoenix’s growth led the country, again, at 12.2% year over year. Chicago and Boston both saw negative growth.

    Remember when rental prices increase as quickly as sales prices the market is operating on healthy fundamentals. When rents decrease while sales prices increase it is a bubble market. Prices decline due to vacancies, which neither the purchase nor rental market have much of.

    Real Estate News:

    Final Thoughts:

    Remember real estate changes slowly. Yes, it has never moved so quickly but it doesn’t change overnight, despite what it seems. By understanding the implications of the slight shifts, we can all better council our clients. And while Sean Black, CEO of Knock, believes that within 5 – 10 years buying a house will be like booking a short term rental on Airbnb, a lot has to happen first.

    Copyright 2021 Sarah Perkins

  • AZ Forbearance Update 6/16/2021

    In this 18 minute video, Lydia Wietsma and I discuss the latest in forbearance, extensions, tax liens, and servicing.

    Forbearance Numbers:

    For 15 straight weeks, the forbearance numbers have been decreasing. There are now about 2 million loans in forbearance or about 4.04% of all mortgages, nationwide.

    Forbearance by Stage:

    • 10.6% of borrowers are in the initial stage of forbearance and new requests dropped down to their lowest level since March 2020.
    • 83.6% of borrowers are on extension, down from previous weeks. Well over 50% of borrowers on extension have been in forbearance for over 12 months.  More and more borrowers are reaching the 15-month mark for their plans and are required to exit forbearance. It is expected that there will be about 700,000 exits this month alone.
    • 5.8% of borrowers are re-entries, up from previous weeks.

    Forbearance Exits from June 1, 2020 through June 6, 2021:

    45.7% of borrowers continued making their payments, got caught up upon exit, or paid off the loan with a refinance or sale upon exit. This number continues to decline slightly each week.

    15.3% of borrowers exited their plan, still behind on their payments and without a loss mitigation plan in place. This number has been increasing.

    “We are seeing an increase in the share of forbearance exits, where borrowers do not have a loss mitigation plan in place. Homeowners who are reaching the end of their forbearance term need to contact their servicer to discuss the next steps in the process, as servicers cannot extend the forbearance term without talking to the borrower.”

    Mike Fratantoni, MBA’s Senior Vice President and Chief Economist

    Forbearance News:

    The FHFA extended forbearance for multifamily rental properties only. The extension is through the end of September. For a landlord to extend forbearance they are required to extend the tenant protections meaning they cannot evict a tenant solely for lack or payment among other things. The eviction ban is set to expire on June 30. Many industry groups, including NAR and the MBA, have asked the CDC to allow the ban to expire.

    For any other property type, the window to enter forbearance is closing. June 30th is the last day to get started on a plan.

    CFPB:

    Finance watchdog, the CFPB is looking to make examples out of lenders and servicers for crossing any lines. They are particularly looking at how forbearance plans are handled. With the administration change, so did the CFPB leadership. The organization did not police as much from 2018-2020 having only fined companies about $800 million. A much smaller number than the $12 billion in fines distributed from 2012-2018. The new leadership stated, “They’re looking to pin some heads on the wall, to show that there’s a new cop on the beat. They want to make examples.”

    Equity & Debt:

    We had talked a lot about the increasing equity environment we are currently in. When you combine that and the responsible lending of the past 10 years it is no surprise that mortgage debt has been kept in check. This chart shows that we do not have a lot of mortgage debt growth since the market crashed 13 years ago but equity certainly has increased.

    From Freddie Mac Deputy Chief Economist Len Kiefer:

    Tax Liens:

    Tax Lien letters are going out from the servicers. This is likely only for properties without a mortgage as most mortgage companies make the tax payments as well. Tax lien foreclosures have also been restricted by the foreclosure moratorium. It may be the iBuyers who have hired the servicing company to distribute the letters and do additional inspections. While we do not know all of the details, we do not know that multiple iBuyers are working with servicing companies for inspections. It is easy to suspect that there is more at play here as well.

    Deadlines:

    There are two weeks left before the end of the forbearance window and the eviction and foreclosure moratoriums are lifted. Based on her interactions with the servicer she works with, Lydia does not believe that they are expecting another extension. They are prepping to move forward come July 1.

  • Greater Phoenix Real Estate Update 6/11/2021

    At Weight Watchers, the first five pounds lost is celebrated, regardless of the end goal. The celebration is to acknowledge the initial progress towards a healthy lifestyle. While today’s residential real estate market remains unhealthy (remember when 10% appreciation was a lot?), initial progress has been made. Prices are leveling off, supply is increasing, and immediate sales are declining. This is good for buyers, especially first-time homebuyers, who are the key to the real estate market. Without them, the machine stops.

    National Real Estate:

    Pending Sales:

    Pending home sales declined by 4.4% in April from March but were up 51.7% year over year (keep in mind April of 2020 was not a big month for contract signings). Low supply and fast-rising prices are blamed for the decline.

    “Contract signings are approaching pre-pandemic levels after the big surge due to the lack of sufficient supply of affordable homes. The upper-end market is still moving sharply as inventory is more plentiful there.”

    -Dr. Lawrence Yun, NAR’s chief economist

    Another potential correlation is the decline in personal savings rates, which dropped from 27.7% in March to 14.9% in April. People are spending more on services and entertainment as the economy reopens. Last year’s closures allowed people to accrue a down payment much more quickly than in the past.

    While pending sales do not tell the whole story, they are a leading indicator and help us gauge where the market is going.

    Pricing:

    51% of homes sold above asking price in May. Last May it was only 26%. As more inventory comes on the market, these numbers will fall and appreciation will slow, which is good for the overall health of the market.

    In a balanced market, about 30% of listings take a price cut before they sell. In hot markets, it is about 25%. Today, we are at 17.1%. This number is ticking up each week from a low of about 8%. The insanity of the pandemic market is calming down and starting to normalize showing we are not in a bubble market.

    According to a recent report from Black Knight, the annual rate of home price growth hit 14.8%. The top five markets with the biggest growth are (1) Austin at 24.9%, (2) Phoenix at 24.4%, (3) Riverside at 22.3%, (4) Seattle at 20.8%, and (5) Sacramento at 20.8%. These levels of appreciation are not sustainable and are nearing the tipping point where affordability issues will slow the appreciation.

    Inventory:

    Active single-family listings increased again by about 2,500 to nearly 330,000. Inventory is up 7% from the April 30 bottom but remains 53% lower than this time last year. There still are more buyers than sellers.

    Three weeks ago, just over 29,500 listings sold in less than 24 hours. This week it was just over 23,000. Homes are staying active slightly longer than before.

    The AZ Market:

    For a deep dive into the Greater Phoenix market, join us on June 22 for a Cromford Market Update with Tina Tamboer. For details and registration, click here.

    58% of homes sold above asking price in May in Greater Phoenix, so far in June that number is 62%. In the past 30 days pending sales have declined by 5%, inventory is up 6%, and price reductions are up 23%. On Monday, Elliott Pollack & Company wrote a great explanation about what this means.

    He wrote: “For about 22 consecutive months, Maricopa County has led the nation in housing price appreciation. In the last year, prices are up somewhere around 20% according to several sources. The Information Market suggests that prices for May 2021 are up 43% since May 2019. And in May of this year, the median sale price of a resale home surpassed the median price of a new home, something that is rarely seen. Prices are rising due to (1) limited for-sale inventory and (2) demand as Greater Phoenix continues to see in-migration.

    So are we in a bubble? A bubble is typically driven by a surge in asset prices that is fueled by irrational behavior and disconnected from fundamentals. By that measure, what is happening in housing today is the opposite of a bubble and should help drive the economy. While the impact of the Great Recession and the collapse of the housing market is still a fresh memory, the damage to the economy was from the subprime mortgage fiasco. There is little evidence today that lending standards are anywhere near those of 2004 through 2007.  

    Some observers believe that it will be quite a while before supply overwhelms demand. The demographics of the population provide a huge tailwind for housing. The key is Millennials and those behind them. They make up the bulk of first-time homebuyers and their numbers will keep growing over the next decade.  

    The hot housing market will eventually cool as supply catches up to demand. But in no way does this runup in the market suggest that a bubble has formed similar to what we saw 15 years ago. The age of high-risk derivatives is gone as financial regulations have prevented a repeat performance. Rather this market is built on a solid foundation of a homeowner’s ability to pay a mortgage. We just need more housing.”

    Inflation:

    According to economist, Elliot Eisenberg there are two types of inflation currently impacting the US economy. Base-effect inflation measures declining prices which we had a year ago so the year-over-year numbers are large. This inflation should settle down by the end of 2021. Bottleneck inflation is based on current shortages both in supply chain and labor and shows up as month-over-month inflation. This is the inflation to watch today.

    Employment:

    After two months of missing the expected job numbers, the data suggests that the supercharged economic recovery may be a little bumpier than initially anticipated.

    “This is also a great time to remember that it is much easier to shut down an economy than it is to open one back up and we are still experiencing the pain and effects from government actions over a year ago.”

    -Elliott Pollack

    Only 559,000 jobs were added in May, 671,000 were expected, bringing the unemployment rate down to 5.8%, a year ago it was 14.8%. There are currently 8 million job openings and 9.3 million people unemployed in all categories.

    The lackluster job reports reduce pressure on the Federal Reserve to taper its $40 billion monthly mortgage-backed securities buying program. When to begin the tapering will likely be discussed at the upcoming Federal Open Market Committee meeting on June 15-16. Experts believe it will be late this year or early next year and when the tapering begins mortgage interest rates will rise.

    “The decrease in initial claims for unemployment insurance in recent weeks, the continued robust demand for workers as shown by the high level of job openings, and other data showing increasing economic activity, point to more hiring over the summer. MBA is sticking with our forecast of a 4.5% unemployment rate by the end of the year.”

    – Mike Fratantoni, senior vice president and chief economist for the MBA

    Real Estate News:

    • Offerpad may be the first major iBuyer to become profitable. In Q1 2021 Opendoor’s net loss was $270 million or nearly $13,000 per home, Zillow Offers’ net loss was $58 million or about $30,000 per home, while Offerpad’s net loss was only $233,000 or $229 per home.
    • Earlier this week the DOJ announced that it had tracked down 63.7 of the 75 Bitcoins Colonial Pipeline paid ransomware hackers, illustrating that cryptocurrency is trackable. Could this lead to an increase in legitimate, large-scale transactions – like buying real estate – using cryptocurrency? Potentially.

    Final Thoughts:

    Sam Khater, Freddie Mac’s chief economist said, “The economy is recovering remarkably fast and as pandemic restrictions continue to lift, economic growth will remain strong over the coming months. Despite the stronger economy, the housing market is experiencing a slowdown in purchase application activity due to modestly higher mortgage rates. However, it has yet to translate into a weaker home price trajectory because the shortage of inventory continues to cause pricing to remain elevated.”

    Copywrite 2021 Sarah Perkins

  • AZ Forbearance Update 6/2/2021

    In this 14 minute video, Lydia Wietsma and I discuss the latest in forbearance, delinquencies, and loan servicing. Scroll down for the summary.

    Forbearance Numbers:

    This week was week number 13 of continued improvement in the forbearance numbers and are now down to 4.18% of loans in forbearance or about 2.1 million borrowers. This is fewer than half the total amount of borrowers who were initially in a forbearance plan in May 2020 which was about 8.47% of borrowers which was way below the predicted 30% of borrowers who were expected to go into forbearance. The chart below represents last week’s data but a powerful illustration nonetheless.

    Forbearance By Stage:

    • 11.6% of borrowers are in the initial stage of forbearance and new requests dropped down to their lowest level since March 2020.
    • 82.8% of borrowers are on extension, down from previous weeks. Well over 50% of borrowers on extension have been in forbearance for over 12 months. This means that a large number of forbearance plans will be expiring soon.
    • 5.6% of borrowers are re-entries, also up from previous weeks.

    Forbearance Exits from June 1, 2020 through May 23, 2021:

    46.3% of borrowers continued making their payments, got caught up upon exit, or paid off the loan with a refinance or sale upon exit. This number has declined slightly in recent weeks.

    15% of borrowers exited their plan, still behind on their payments and without a loss mitigation plan in place. It is critical for struggling borrowers who are nearing the end of their forbearance plan to call their lender or loan servicer to discuss the options. There are options.

    Based on this info, if 15% of the 2.1 million borrowers exit forbearance who are still behind on their payments and without a loss mitigation plan, means that nationwide there would be about 315,000 borrowers who would need help upon exit. Divided by 50 states, each state would have about 6,300 borrowers without a loss mitigation plan. These are the ones who need to know their options so they do not lose their homes. And 315,000 is a far cry from the 10 million foreclosures we had nationwide during the crash.

    Delinquencies:

    In April, the national delinquency rate dropped to 4.66%. A borrower who is in forbearance and not making payments is counted in these numbers. 900,000 borrowers have gotten caught up in the past 12 months. At 1.768 million, the seriously delinquent rate remains 4x the rate from February 2020.

    Black Knight data services, which supplies much of the data we discuss, is predicting that delinquency rates will normalize to pre-pandemic levels by the end of this year.

    Please note the 1.8 million borrowers are I mentioned in the video are not the total number of borrowers delinquent but a rounded number of the total borrowers that are 90+ days late.

    Deadline – June 30, 2021:

    The deadline to enter into a forbearance plan is June 30, 2021. Time is of the essence and struggling borrowers must reach out to their lender or mortgage servicer to get started. Check out the available resources below.

    The ban on rental evictions and the foreclosure moratorium also expire on June 30, 2021. It is possible that any of these programs may be extended at any time without any warning. The CFPB proposed a foreclosure moratorium through the end of 2021, which is still being discussed.

    Servicing:

    Requests for inspections are up! Lydia received 17 inspection requests in 2 days and not all are iBuyer owned. Sometimes it is to deliver letters encouraging borrowers to call their servicers to find out about their options. A large lender is offering 0% interest on second loans for the deferred amount. The servicing companies are hiring more staff to prepare the June 30 expirations. There is a backlog of pending foreclosures due to the moratorium so we will see an increase in notices of trustee sale.

    The Market:

    Do not overprice listings. Despite a 32% year-over-year appreciation rate, the market is starting to slow a bit. Some listings are lasting days rather than hours on the market.

    Resources:

  • Greater Phoenix Real Estate Update 5/28/2021

    “Buy land, they’re not making it anymore.” ~Mark Twain

    April saw its best sales rate in 15 years and at the same time sales declined again for the third straight month. Homes are selling faster than ever before, and prices are higher than ever before; yet the signs are all there, the market is slowing – very slowly – and just starting to normalize.

    “One of the main reasons that inventory can keep falling as it has and sales overall continue to grow is precisely because of this faster market velocity. And unlike previous periods when demand for homes was high and time on market short, notably the pre-2008 housing boom, the market this time around is driven by sound fundamentals unlikely to fade anytime soon.”

    ~ Treh Manhertz, Zillow

    National Real Estate:

    Pending sales for the seven-day period ending May 16 were down 10% from four weeks prior, compared to an 8% increase during the same period in 2019. (NAR)

    In the past week, single family inventory increased by 10,000 listings or 3%. This is the biggest increase in new inventory since June of 2019. That is a three-week trend of increasing inventory and it takes three weeks to see a trend. Nationwide, during normal market cycles, inventory tends to peak around August. Expect more slow increases in inventory in the coming weeks. It will likely take years to get to normal levels.

    Last week just over 29,500 listings sold in less than 24 hours. This week it was just shy of 27,000. Homes are staying active only hours longer than in previous weeks.

    88% of homes are selling in 30 days.

    Price reductions tend to be very cyclical. Usually, by mid-May we see more people cutting their prices before they go too deep into the summer. We are just barely starting to see the seasonality now with 16.3% of listings taking a price reduction. The average is around 28%. Markets remain very hot, yet we are slowly starting to move closer to normal. Now is not the time to push the market or overprice a listing.

    New Construction:

    New home sales fluctuate more than resales month to month. It is not unusual to go positive growth, negative growth, positive growth. A more stable approach to new construction is by measuring monthly supply levels, averaged over three months. At 6.5 months builders stop building. Below 4.4 months business is good and builders are building. At 4.4 to 6.5 months, the market is fine. April’s report shows a 3-month average supply of 4.23 months.

    Housing permits, starts, and builder’s confidence levels remain strong. Affordability challenges for both buyers and builders are the root of the falling numbers. Buyers and builders are both benefitting from the low-interest rates which will not last forever.

    In order to manage labor and supply chain shortages as well as the skyrocketing costs of materials, many builders are adjusting how they work with buyers. Some builders are building spec houses to sell outright, some are waiting to go under contract once they are closer to the build start date, and some builders are going under contract without a finalized price.

    “In the short-term, inventory shortages will persist. U.S. Census Bureau data from earlier this week showed residential housing starts have started to slow due to challenges in the cost and availability of building materials.”

    ~Joel Kan, MBA’s Vice President of Economic & Industry Forecasting

    The AZ Market:

    Greater Phoenix took second place in two recent price index reports. One for losing affordability and the other for the annual appreciation rate, which is pushing 32%!

    On Monday, local housing economist Elliott Pollack wrote, “Permits in Greater Phoenix were above 3,000 for the second month in a row, bringing the year-to-date total to almost 12,000 permits. The median sales price for both resales and new homes increased to $365,000 and $370,878 respectively, narrowing the gap between resale and new home prices to just $5,878.”  

    MLS Aligned is a new showing scheduling service that is co-founded and owned by five MLS’s, including ARMLS. Due to a 12-year-old ARMLS policy that doesn’t allow vendors to also be broker members, ARMLS will not extend the contract with ShowingTime after its expiration on 1/1/2022. Zillow is both a member of ARMLS and the owner of ShowingTime. The other co-owners are Metro MLS in WI, MLSListings in Silicon Valley, RMLS in OR, and UtahRealEstate.com.

    Earlier this year Scottsdale formed a municipal committee that consists of residents, Realtors, hospitality officials, and two city council members to research and track the city’s short-term rentals. Over the past three weeks, two city employees found 1,000 short-term rental locations that are currently are in violation of contract or tax licensing requirements. Will this committee set a precedent for other cities?

    Greater Phoenix retail vacancy rates decline as 99.6% of the lost retail jobs have been recovered. Leasing activity is up 18% year over year and up 85% since the whole decline in Q2 2020.

    Greater Phoenix has recovered 73.6% of jobs lost while the US has only recovered 63.3% of jobs lost.

    Earlier this week the Case-Shiller Index released its March numbers. Nationally, March saw a 13.2% year-over-year appreciation rate. Greater Phoenix had the highest appreciation rate of 20% year over year. Economists, Wall Street, and the federal government use Case Shiller’s data on appreciation rates. The index is considered a “repeat sales index” which means that it looks at the difference in sales price from when a property is purchased and when it is sold. It is a very accurate way to monitor home prices. The downside is that it is a very slow report, these are only March’s numbers.

    Commercial Real Estate:

    Apartment complex vacancy rates are expected to hit 4.55% this year, 4.38% in 2022, and 4.18% in 2023. All of those are lower than the 20-year average and significantly lower than the 7.2% apartment vacancy rate reached in 2009.

    Corelogic recently announced that single family rents increased nationwide by 4.3% in March. The cities with the largest-double digit rental increases were Phoenix and Tucson. Renting costs more than buying!

    Lending:

    Purchase mortgage applications increased for the second time in May after a weak April with multiple declines.

    In 2020, 15% of buyers purchased homes with cash. Through mid-May 2021 that number has grown to 25%.

    A new bill has been proposed to create a new loan program similar to a VA loan that allows first responders, law enforcement, and teachers to borrow up to 100% of the acquisition price.

    Real Estate News:

    • Chlorine prices have increased by 36% year over year. New pool demand is up 20% year over year after 2020’s large increase over 2019. Expect chlorine prices to continue to climb.
    • In addition to the Georgia and Alabama Association of Realtor’s lawsuits against the CDC’s eviction moratoriums; the Florida Association of Realtors filed a lawsuit against the CDC stating that the CDC does not have the authority to be the “nation’s landlord-in-chief.” NAR supports all three lawsuits and stated, “

    “Nearly half of America’s rental housing is provided by mom-and-pop property owners who own four units or less. These providers will be hesitant to pour their sweat and savings into housing if a government entity without oversight can seize their only ability to generate income. Many have struggled for more than a year to pay their bills and maintain their properties as legally required. This future uncertainty will suppress the availability of affordable rental housing in America.”

    Final Thoughts:

    Yesterday, Elliot Eisenberg wrote, and it sums up our market beautifully, “April existing-home sales fell 2.7% M-o-M, to 5.85 million/year, the best April sales rate since 2006. That said, it was the third straight monthly decline. While low rates and remote working still boost demand, a lack of homes, especially at lower price points, vertiginous Y-o-Y price appreciation of 13% to 19% depending on how you measure, and no new meaningful growth in home construction activity are quietly taking their toll.”

    Copyright 2021 Sarah Perkins

  • This Week in (Greater Phoenix) Housing 5/24/2021

    In this 12 minute video, Amber Kovarik and I talk about supply, demand, lending, and discuss what the numbers mean and what the actual buyer experience is like versus only following general data trends. The numbers don’t always tell the whole story.

    The market is confusing right now. Inventory is increasing and demand is decreasing. Yet, 80.5% of offers being written right now are for listings with multiple offers. Over 57% of closings are closing over asking.

    The reason we watch supply and demand so closely is that they help us gauge the leading indicators, like housing permits, loan applications, number of new listings, and number of listings going pending. The Cromford Market Index is the best leading indicator available. It peaked at an insanely high number of 514 on March 14. Anything over 100 is a seller’s market and yes, I just said 514. Yesterday it was 453. What that means is it is still a super hot seller’s market. It also means that the sky-high appreciation rate is starting to slow. This is good for everyone.

    In March there were 10 buyers per listing and today there are 5 buyers per listing. Remember it only takes one buyer to sell a house.

    As people are out and about more, the personal savings rates will decline. Dr. Lawrence Yun, Chief Economist for NAR, expects “revenge spending” on more services and entertainment in the coming months which will slow some of the frenzy we have been experiencing. He also expects that bidding wars will not be commonplace in 2022.

    Consumer price inflation increased by 0.8% from March to April, the largest increase since June 2009. It increased by 4.2% year over year, the highest since September of 2008. Core inflation is up 3% year over year. Experts blame supply chain challenges and last spring’s weak readings and believe this inflation is short-term and will settle down in the coming months. Housing has taken on the largest rate of inflation at 18% (nationally) year over year. Consumers call it appreciation and economists call it inflation.

  • Greater Phoenix Real Estate Update 5/21/2021

    Residential real estate continues moving at breakneck speeds. In April, nearly 75% of offers written by Redfin agents were for listings with multiple offers, nationwide. In greater Phoenix, it was 80.5%. Last week Tina Tamboer with the Cromford Report told us that 57.1% of homes that closed in greater Phoenix in April, closed over asking. These exciting times of economic growth and massive home-price appreciation are being dampened by fear, not just of a bubble – which we are not in – but also by the threat of inflation. One of the ways the government is able to slow inflation is by increasing rates (not mortgage), which then usually puts pressure on mortgage rates which would increase affordability challenges thus weakening homebuyer demand.

    Inflation:

    Consumer price inflation increased by 0.8% from March to April, the largest increase since June 2009. It increased by 4.2% year over year, the highest since September of 2008. Core inflation is up 3% year over year. Experts blame supply chain challenges and last spring’s weak readings and believe this inflation is short-term and will settle down in the coming months. Housing has taken on the largest rate of inflation at 18% (nationally) year over year. Consumers call it appreciation and economists call it inflation.

    In late April the Federal Reserve stated again that it intends to keep short-term interest rates at nearly 0% until we reach full employment (roughly 5%) and inflation is slightly above 2% “for some time.” It will also continue buying $80 billion in Treasury securities and $40 billion in mortgage backed securities monthly until those benchmarks are reached.

    Employment:

    American workers are more productive than they were pre-pandemic. Federal Reserve Governor Christopher Waller said, “It fits with what we have been hearing from businesses about labor supply shortages. GDP is back to its pre-pandemic level, but we have recovered only 14 million of the 22 million jobs lost last spring.”

    With nearly 8 million job openings nationwide and many employers struggling to find workers, 22 GOP led states, including Arizona, opted to end the additional $300 in weekly pandemic unemployment benefits early. In Arizona, those benefits will expire on July 10 rather than in early September. There are just over 6.6 million people receiving Pandemic Unemployment Assistance nationwide.

    Despite the dismal April jobs report, the weekly jobs report released yesterday shows that 444,000 people filed for initial unemployment benefits, down 7% from the previous week and hitting an all-time low since March 14, 2020, when it was 256,000. In Arizona, we had a 27% decline in initial unemployment claims. Continued unemployment claims, known as insured unemployment, increased by 0.1% week over week to 3,751,000. In Arizona, that number declined by 4% to 52,836.

    While the unemployment numbers remain high, experts predict Arizona will add 116,900 jobs by the end of 2021, which would put us ahead of our pre-pandemic numbers, according to the Economic Club of Phoenix, a unit of the WP Carey School of Business at ASU. In April of 2020, Arizona lost 331,000 jobs.

    Source: US Department of Labor

    National Real Estate:

    Single-family housing starts in April declined 13.4% from March, putting us at an annual rate of 1.09 million single-family starts. Builders blame supply chain and labor shortages for the decline.

    As people are out and about more, the personal savings rates will decline. Dr. Lawrence Yun, Chief Economist for NAR, expects “revenge spending” on more services and entertainment in the coming months which will slow some of the frenzy we have been experiencing. He also expects that bidding wars will not be common by 2022.

    Single-family inventory increased again this week by 1% to 313,577. Experts predict inventory to gradually increase by about 1% a week over the next few weeks. There are no signs of distressed listings coming to market. This gives our exhausted buyers more flexibility and room for negotiation. As you can see below, we have only had 3 weeks of inventory increases in the past year.

    71% of new listings went under contract in less than a week, a slight decrease from last week’s 73%. Expect strong demand through June.

    Home sales prices were flat this week at $395,000 and new listing asking price dropped from $365,000 to $360,000. For the past month, new listing asking prices have stayed flat so prices are no longer skyrocketing, on a national level. Normally the asking prices top out in May, last year it did in July. The new listings prices lead the market by about a month. Then closed listings followed by a month and then the headlines follow by another month.

    The AZ Market:

    From July 2019 through July 2020, Phoenix ranked #1 in net migration. We had 89,000 people move here or 244 per day. In 2020 alone Phoenix grew by 106,008 people, ahead of the 10-year average of 85,562 people a year.

    According to the Information Market, in Maricopa County, new home sales are up year to date by 8.6% and resales are up 22.3%. In April, the median sales price for new homes was up 24.6% year over year. For resales, it is up 32!!

    For more in depth information specific to greater Phoenix, see my update from last week, here.

    Lending:

    It is no surprise that mortgage demand declined in April from March but remain significantly above last year’s totals. Demand has been slowly declining since March. The continued low inventory combined with affordability pressures is still to blame. Experts predict there will be a modest rise in rates this year, which will likely further impact demand as well.

    1031 Exchanges & Proposed Policy:

    President Biden’s proposed American Families Plan does not completely eliminate 1031 exchanges but it does cap the amount allowed in the exchange. The plan allows for up to $500,000 in capital gains deferral.

    A study from the University of Florida shows that the average size of a 1031 exchange transaction from 2010 to 2020 was $500,000; which is far smaller than institutional commercial real estate transactions. Walker & Dunlop’s average transaction amount is $49 million and they do not use 1031 exchanges.

    Real Estate News:

    • Fannie Mae recently revised down the expected existing home sales counts due to rising mortgage rates and potential inflation. The article states, “Homes will sell at an annual pace of 5.88 million during April, May and June. That’s down from the previous forecast for second quarter sales to come in at 6.16 million, annualized.”
    • National mortgage delinquency rate improved in April as 400,000 borrowers became current on their loans. The delinquency rate declined to 4.66%, a 7.08% decline from March’s rate.
    • On Wednesday, Zillow launched an in-app calling feature which allows potential buyers to call an agent directly without ever leaving the app. The Realtor has 30 seconds to answer before the call is then routed to another Premier Agent.
    • Two of the country’s largest single-family rental REITs upped their rates on vacant home in April by a lot. American Homes 4 Rent increased 11% and Invitation Homes increased by 10%.
    • Popular CRM, Liondesk announced last week that it is being acquired by Lone Wolf Technologies. As the system integrates with Lone Wolf, users may see some changes.

    Cryptocurrency:

    Yesterday, the IRS announced that “businesses that receive crypto assets with fair market value of more than $10,000” must be reported. This is part of President Biden’s proposed American Families Plan. The announcement comes on the heels of Bitcoin’s peak earlier this week at nearly $65,000 and then an immediate decline to just below $40,000 after a similar announcement that China is planning its own cryptocurrency regulations.

    Final Thoughts:

    While yes, the inflation numbers are more intimidating than we would like, these are short-term numbers and are expected to fall and normalize over time to a more balanced level.

    Demand is declining some but remains stable. Inventory is rising but is coming from such a small number it needs to rise for some time before it becomes a concern.

    For those who remain afraid of a bubble, I quote one of my favorite housing economists, Logan Mohtashami of HousingWire, “Home prices, on the other hand, are rising too fast. When you have the best housing demographics ever recorded in U.S. history in the years 2020-2024 and the lowest mortgage rates ever recorded in history, then the notion that housing demand will collapse is, in a word, ridiculous. Along with stable demand, the financial balance sheets of our current homeowners are solid. But hey, in America, trash sells, no matter how unbelievable.”

    Copyright 2021 Sarah Perkins