Tag: #theazmarket

  • Greater Phoenix Real Estate Update 8/27/2021

    Residential real estate pulled our economy out of the shortest recession in history. As last year’s market frenzy cools, the severe imbalance of supply and demand lessens and prices continue to increase, just at a slower rate. According to the 2020 US Census, housing units increased by 6.7% while population grew by 7.4%; both were declines from previous decades, but it doesn’t change the fact that demand (population) outpaced supply (housing units). Over the past 10 years, Maricopa County’s population increased by 15.8% and housing units increased by 8.3%.

    Demand outpacing supply combined with 10 million job openings and only 5.7 million jobs left to recover; residential real estate has garnered significant attention from investors. When an asset class or sector underperforms, investments are redirected into performing asset classes/sectors. Investors do their homework and invest where money will likely grow the most. Year over year rental rates are up along with property appreciation. John Burns of John Burns Real Estate Consulting said, “Investors won’t be slowing down at all. They’re only accelerating.”

    And don’t worry about the coming year over year negative reports. 2020 was an anomaly and is not a good comparison for a normalizing market.

    Rentals & the Eviction Ban:

    Yesterday the Supreme Court lifted the CDC’s eviction ban, stating that the CDC did not have the authority to create the ban in the first place, ending it six weeks earlier than the planned October 3 end date. In June, the Supreme Court ruled that the only way to further extend the eviction ban was through an act of Congress, which did not happen. Through the end of July, only $5.1 billion of the $46.5 billion in rental relief funds had been distributed.

    According to a new report from Zillow, nationwide rent prices were up 9% in July, year over year. Greater Phoenix saw the largest year over year rent increase, at 23%.

    In 33 of the 50 largest American cities, the typical rent is higher than the typical monthly mortgage payment. This is true in Greater Phoenix.

    National Real Estate:

    On Monday, NAR released its existing home sales report for July. Some interesting data points:

    • Total inventory is up 7.3% from June to 2.6 months of supply but down 12% from July 2020 when it was 3.1 months.
    • Nearly 90% of total sales in July were listed for less than a month.
    • 23% of sales were all cash, up from 16% in July 2020.
    • 30% of July sales went to first time homebuyers, down from 31% in June and from 34% in July 2020.

    “We see inventory beginning to tick up, which will lessen the intensity of multiple offers. Much of the home sales growth is still occurring in the upper-end markets, while the mid- to lower-tier areas aren’t seeing as much growth because there are still too few starter homes available.”

    – Dr. Lawrence Yun, NAR’s chief economist

    Total inventory (including both new and existing) peaked in 2008 then started declining. The declines have been consistent since 2014. While inventory has been rising since February and the market started showing signs of seasonality, which is good, we do not want to see inventory drop again, as it usually does in the fourth quarter. If demand remains the same and inventory declines then we see a faster rate of appreciation, which at its current levels, is unsustainable and has only just started to slow.

    Available Inventory

    The AZ Market:

    In January the Greater Phoenix median sales price was $340,000; now it is $405,000. That is over a 19% appreciation rate in this year alone. Most of those gains took place at the beginning of the year with 15.5% of the gain occurring from January to May. The median sales prices from May to August increased by 3.15% and from June to August the increase was 1.25%. The appreciation rate is slowing, and this is good for the overall health of the market.

    There are 62% more active listings with an asking price over $400,000 than under.

    In July, iBuyers accounted for 8.1% of all home sales in Maricopa County.

    In Q2 2021, 17 houses sold for at least $1,000,000 over the initial list price, up from 8 in Q1 2021. Fifty houses sold for at least $500,000 over the initial list price in Q2 2021, up from 15 in Q1 2021.

    85224 in Chandler is the only Arizona zip code to make it in the top 50 in Realtor.com’s 2021 Hottest Zip Codes in America list.

    Greater Phoenix, through July, has recovered 99% of jobs lost due to the pandemic and only needs 2,500 more jobs to match February 2020’s employment rate. Arizona has recovered 93.7% of jobs lost.

    According to the 2020 Census, at an 11.2% increase, Phoenix grew faster than any other major city over the past 10 years and passed Philadelphia as the nation’s fifth largest city. Buckeye took the top spot for fastest growing city in the country, among cities with at least 50,000. It grew by 80%!

    For more on the Greater Phoenix market, click here for my update from last week which is exclusively about our local market.

    New Construction:

    Lumber prices are down from the peak in May at $1,515 per 1,000 board feet to $472 per 1,000 board feet in early August. Due to the backlogs, it is unlikely that new home buyers will feel the pricing relief anytime soon.

    Month over month builder confidence declined by 5 points in August to 75, the lowest reading in 13 months. The decline is attributed to high material costs and labor shortages. Any reading over 50 is considered a good market. In April 2020 the index dropped to 30.

    “There are now almost 690,000 single-family homes under construction – the largest number since 2007. This is clearly a positive sign given the remarkably low levels of inventory on the market.”

    – Mike Fratantoni, the MBA’s chief economist

    After three months of declines, new home sales in July increased by 1% from June, beating expectations. June’s sales numbers were revised up. New home inventory is up 5.5% to a three-month average of 5.9 months. Builders tend to pull back once they hit 6.5 months.

    Commercial Real Estate:

    Much of commercial real estate has recovered from the pandemic and is now beating out February 2020 prices. The Green Street Commercial Property Price Index, which is based on REIT net asset values, beat February 2020’s ranking by 1.3%. In July, prices were up 14% year over year and up 2.4% from June.

    With prices growing over 20%; mobile home parks, self-storage, and industrial grew the fastest. In Greater Phoenix, the industrial vacancy rate is down to 4.7%. However, some asset classes are still down. The year over year prices for retail and lodging are down 7%, office is down 8%, and mall values are down by 18%. In Greater Phoenix, the office vacancy rate has increased for five consecutive months and the vacancy rate is up to 19.7%.

    Real Estate News:

    • Offerpad is the first iBuyer to turn a profit. In Q2 2021 they brought in $9.2M in profit. Based on the overly inflated offers from Opendoor and Zillow, it is likely the only iBuyer that will be profitable for some time.

    Final Thoughts:

    Danielle Hale the chief economist for Realtor.com summed it up well when she said, “Continued economic recovery is key to maintaining (real estate) sales momentum, and anything that disrupts progress, such as rising COVID cases, could knock home sales off course. We’ve already seen a pullback in builder confidence and mixed construction data as builders balance buyer interest with supply challenges, rising costs, and concerns about the future of the economy and housing affordability. Still, with listing price growth beginning to recalibrate in response to shifting supply and demand dynamics, we should see a steady pace of home sales over the next few months, especially if mortgage rates remain low.”

    Copyright 2021 Sarah Perkins

  • AZ Forbearance Update (video) 12/30/2020

    In this 15 minute video, Lydia Wietsma and I discuss this weeks’ biggest news in forbearance. For a short holiday week, a lot is happening.

    One – Forbearance Numbers.

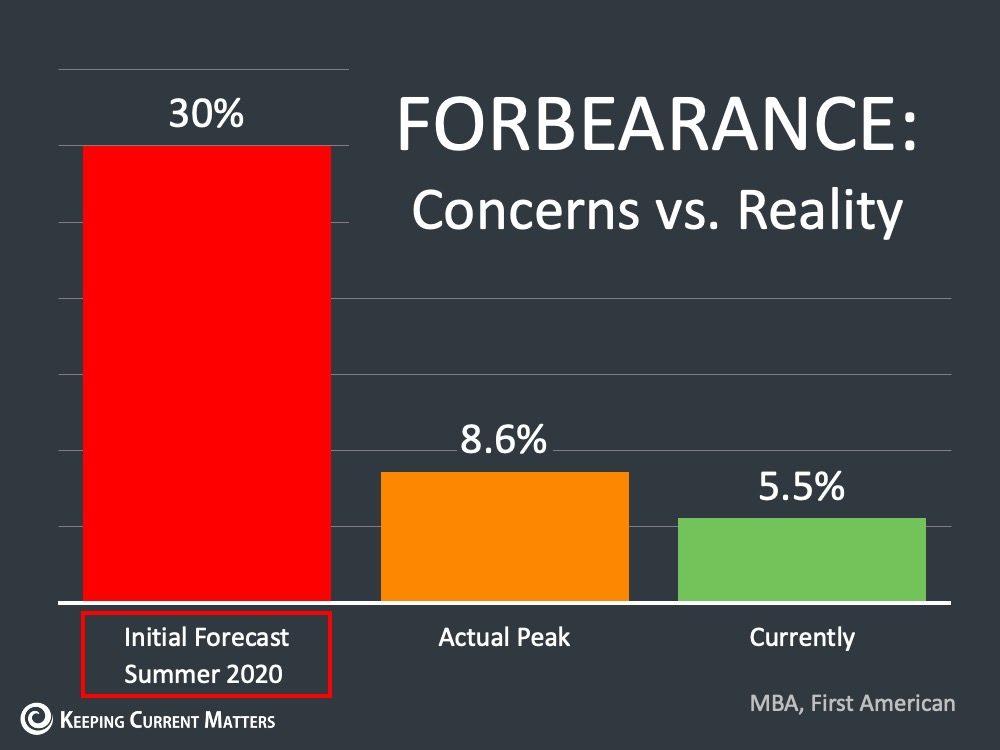
    When the CARES Act passed in March, creating forbearance plans, it was expected that around 40 million borrowers would enter an available plan. In reality, since March, about 4.3 million entered a plan. Now, as we end the year, 5.5% of loans or about 2.7 million borrowers remain in a forbearance plan. And nearly 79% of those in forbearance are on extension. Initial plans are 3 – 6 months long and the extensions are 3 – 6 months long.

    Based on these timelines, a huge number, 367,000, forbearance plans are set to expire in January. How many will go on extension remains to be seen.

    Roughly 45% of borrowers leaving forbearance are caught up and current on their payments.

    Two – FHA Extension.

    The biggest news in forbearance is FHA’s extension for entering a forbearance plan. If a borrower has an FHA loan they can now call their servicer through February 28, 2021 to get started on a forbearance plan.

    For all other mortgage types, the deadline is tomorrow.

    Three – Delinquencies.

    The biggest news in forbearance is FHA’s extension for entering a forbearance plan. If a borrower has an FHA loan they can now call their servicer through February 28, 2021, to get started on a forbearance plan.

    For all other mortgage types, the deadline is tomorrow.

    Four – Equity.

    For anyone concerned about what the market is doing right now, please keep in mind these things:

    • Demand continues: Mortgage applications are still increasing and for the week ending on 12/18, mortgage applications are up 26% year over year.
    • Prices have been increasing since 2012.
    • American homeowners with a mortgage have an average of $195,000 in equity, a struggling homeowner can sell their home and walk away with cash in their pocket.

    In 2020 housing has been the leading sector in our entire economy. Experts predict more of the same in 2021. Rates are expected to stay low with demand high. Many expect to see a strong spring selling season, as long as inventory increases.

    Five – Increased Inspections.

    Lydia is seeing a lot more servicing requests from the loan servicing company she works with. Last week had a 3 day work week and this week is 4 and each week she has gotten 10 inspection requests, which is more than she has received in two back to back weeks this year. She was told that they are hiring and training more employees now too. Does this mean that they are gearing up for some big things in 2021? The answer remains to be seen.

    Six – Not Free Money.

    The forbearance plan deferrals are not forgiven, they are to be repaid. This is not free money. Lydia shared another concerning story about borrowers who were not negatively affected by the pandemic who took forbearance and spent the money elsewhere. How many instances of this will come out? We know there will be consequences. The significance of those consequences will be seen in the coming months.

  • This Week in Phoenix Real Estate (video) 12/28/2020

    In this 8 minute video, I cover 4 topics impacting greater Phoenix real estate this week.

    One – the Market:

    Be mindful of the headlines. Demand remains way above normal but it has fallen slightly below its peak in November. This is causing all kinds of headlines claiming the sky is falling. While our demand is the highest it has been in 9 years, inventory is at the lowest, maybe ever, at least in the past 20 years. Inventory is down 20% just since last month and 51% from a year ago. There are about 6300 available listings. That is it. We could literally use 20,000 more listings in our market, like tomorrow. Nationwide there are fewer than 450,000 single-family residences available.

    Also, remember, the market is cyclical, it is normal for activity to slow at the holidays. The best kind of housing market is a stable housing market. For us to move towards more cyclical norms is a good thing.

    Existing home sales have declined slightly from November. However, there are still about 25% more pending sales than there were at this time last year.

    For new homes, over the past 10 years the average decrease in activity from mid-November to mid-December is 25% and for the same time period, new home sales are up 20% year over year.

    The strength of the market is driven by low inventory, high buyer demand, and super-low mortgage rates. This strength is expected to continue into 2021 with, hopefully, an increase in listings.

    Two – Population/Migration:

    The biggest challenge, that we know of today, is the quickly rising prices, we are up 17% year over year. Increasing supply will slow the price appreciation which will help keep today’s buyers engaged. Over the past 10 years, nationwide, builders have underbuilt for the demand, and it is coming to a head now.

    Combine the low inventory with population growth and supply diminishes even faster. The full census numbers come out in March but the preliminary numbers for 2020 are in and Arizona’s population growth is just over 105,000. 2020 actually had slightly fewer people move here than in 2018 and 2019. Over the past 10 years, about 890,000 people moved to Arizona, of which about 80% or 712,000 moved to greater Phoenix.

    Further data shows that the mass exodus from big cities has not been what was initially expected. Fewer than 1% of the population left the biggest cities in the country. If you take the homeowners that moved this year in the 50 biggest cities in the country, about 84% stayed in the same city.

    Three – Stimulus Bill:

    Yesterday, the president signed the $900 billion relief bill into law. There will be a stimulus check, expanded unemployment programs extended through 4/19/2021, additional $300 in weekly benefits extended through 3/14/2021, additional funding for PPP, and an extension to the eviction moratorium through 1/31/2021.

    The biggest news for our industry is the $25 billion in rental assistance which allows landlords to apply for funds to cover rents in arrears, utilities, and other housing costs. This is great for landlords as the majority of landlords are mom & pop investors.

    Forbearance timelines are not addressed in this stimulus bill. Although last week, FHA announced a 2-month extension on both the foreclosure moratorium and forbearance initiation. This means struggling borrowers who have FHA loans can get started on their initial forbearance plan through 2/28/2021.

    Only FHA has extended these, any other struggling borrower who needs to get started on a forbearance plan must call their servicer by the end of the day Thursday.

    Four – News:

    1. Last week, another commission based class action lawsuit was filed. This one did not name NAR but did name the local MLS and industry giants like Realogy, Keller Williams, and RE/MAX.
    2. Luxury builder, Camelot Homes will now allow you to take a house for a test drive so to speak, they just announced their “Stay and Play” experience for a new community in Desert Mountain in north Scottsdale.
    3. 2021 is expected to be another big year for mergers and acquisitions also, we should expect more IPOs and SPACs for businesses going public.

    Happy New Year!!!

  • AZ Forbearance Update (video) 12/23/2020

    In this 13 minute video, Lydia Wietsma and I discuss the most recent five things you need to know about forbearance. The majority of borrowers leaving forbearance are current upon plan exit, only 13% of borrowers leaving their forbearance plan do so without having a loss mitigation plan in place. There is not much time left if someone needs to take advantage of these CARES Act benefits.

    We do these updates to help real estate professionals and consumers understand forbearance, and to let struggling borrowers know that although experts are forecasting a tough winter, there are options.

    One.

    Last week total number of mortgage loans now in forbearance increased slightly from 5.48% to 5.49% as of December 13, 2020. According to MBA’s estimate, 2.7 million homeowners are in forbearance plans.

    While the news of an increase is not great, we need to remember total loans in forbearance was expected to hit 30% and our peak was 8.6%.

    Two.

    Forbearance Numbers by Stage:

    • 18.78% of total loans in forbearance are in the initial forbearance plan stage, which is up very slightly from the previous week which was 18.72%.
    • 78.54% are in a forbearance extension, this is down from the previous week which had 78.72% in extension.
    • 2.69% are forbearance re-entries which is up from the previous week of 2.56%. This group has been slowly growing over the past few weeks.

    About 13% of the borrowers exiting forbearance are still behind on their payments and left their program without a loss mitigation plan in place. This is the group that needs to know their options.

    When you look at this slide, this means that we are looking at roughly 116,000 borrowers in this situation who will need guidance.

    Three.

    While the new stimulus bill covers renters, landlords, extends the PPP loan options for small businesses, extended unemployment benefits, and more, it does not extend forbearance plan protections.

    Eviction and foreclosure protections were extended through 1/31/2021.

    Four.

    Borrowers who want to get started in a forbearance plan have 4.5 business left to call their servicer to get started. Time is of the essence.

    Five.

    Lydia is receiving more and more inspection requests from the servicer she works with. So far this week she has received 10 requests. The activity is picking up.

    When exiting forbearance borrowers have a number of options; not all of them require the owner to sell their property. Some of these options include:

    • Utilizing a 401K in two ways.
      • Individuals are allowed to borrow from their 401K with the option of paying themselves back with interest, since it is a loan being paid back, essentially paying yourself back there are no penalties. Talk to your 401K administrator for details.
      • Through provisions of the CARES act, an individual can also withdraw an amount of their 401K with no penalties. Again, talk to your 401K administrator for details.
    • Permanent loan modification or refinance, after making 3 payments in a row, to something that allows borrowers to stay. Some scenarios include adding the forborne amount at the end of the loan, some pay a lump sum to get caught up, some offer payment plans to get caught back up.
    • Rentals are in high demand with quickly appreciating values. What about moving out of the property and renting it out to make up the difference in payments.
    • Sell and buy something more affordable, after 3 payments in a row have been made. Pay off the loan and get a new loan with more agreeable terms.
    • Sell, pay off the loan and forborne the amount, and rent/move in with family.
  • This Week in Phoenix Real Estate (video)

    In this 7 minute video, I talk about the 4 things you need to know about greater Phoenix real estate this week.

    One – Inventory:

    After stabilizing for a few months this summer and fall, available listing inventory is dropping again. We are down to 6,800 active listings. That is down 18% since last month and 50% year over year. It is also 67% below normal.

    Our demand is 34% above normal, coupled with incredibly low inventory buyers are struggling to get offers accepted. Despite seasonal demand decreases, we still have about 4 buyers for every available listing.

    Two – Appreciation:

    The very low supply and above normal demand has pushed prices up all year. We have been in an appreciating market for 8 years. Year over year, the greater Phoenix is running at about a 17% appreciation rate. The huge increases have made some people afraid we are in a bubble, however, today’s market is dramatically different. Dr. Lawrence Yun said, “There is no comparison” between today’s market and the bubble from 2004-2006.

    Today, we have true demand versus the false demand we had in 2005. Rents decreased during the bubble, people bought houses solely to park money, today people are living in the property and single family rents are appreciating faster than houses for sale. In 2005, there were extremely loose lending options available requiring no money down and lending up to 120% of the purchase price. Today in order to get a loan, a borrower must have a down payment and meet certain criteria.

    Today, the average American homeowner with a mortgage has $194,000 in equity, providing owners with a lot of options. When the market crashed in 2008, few were left with options.

    Three – Lending:

    2020 is on pace to hit nearly $4.4 trillion in first-lien mortgage originations, the largest volume in history.

    Of the roughly 138 million US housing units, 42% have no mortgage, of the roughly 77 million that do have a mortgage about 50% have interest rates in the 4s% or higher. (KCM)

    While the Fed does not control mortgage interest rates, it’s consistent purchasing of treasuries and mortgage backed securities has kept rates low. At the most recent meeting, the Fed announced that it would continue purchasing at the same rate until there is “substantial progress” towards an overall stronger economy. Chairman Powell realizes that this will take time and is prepared to stay the course throughout the recovery.

    Four – Built to Rent: 

    About 6% of new single family homes are built-to-rent and will not enter into the market at all. It is expected that nearly 700,000 will be built by 2030. Nationwide, roughly 35% of rentals are single family properties and the demand is rising. There are about 84 million single family residences across the country.

    Phoenix-based Christopher Todd Properties is currently developing 943 single-family built to rent homes in greater Phoenix. These communities have apartment-style amenities like gated entry, community pool and fitness area, and carports for parking. Many of these are 1-2 bedrooms and are roughly 1,000 square feet renting for about $1900 a month.

    Courtesy of Christopher Todd Properties. Christopher Todd Communities at Stadium, a built-for-rent property of 300 houses in Glendale, AZ.
  • Greater Phoenix Real Estate Update 12/18/2020

    Unsurprisingly, the US housing market will finish out the year as the best performing sector in our entire economy. It is good to be part of the solution. Given the performance, low inventory, and low-interest rates driving up demand, a new challenge is emerging – affordability.

    Experts forecast a stabilizing housing market for 2021. A stable housing market is good. It is expected that inventory will rise and prices will continue to increase, only at a slower rate. This is not a collapse, it is normalization and it is the path towards stability. Be mindful of the fear-mongering headlines, no bubble, no collapse, no foreclosure crisis. In 1710, writer Jonathan Swift wrote, “Falsehood flies and the Truth comes limping after it.” Somethings never change.

    Economy.

    Elliott Pollack summed it up with, “The economy will normalize in the second quarter of 2021 due to having COVID-19 vaccines in wide distribution. There is significant pent-up demand in the real estate market, and people are sitting on gobs of cash because they’ve had nowhere to spend it for the past nine months, so we will see explosive growth at first, then continue to grow at above normal trend lines through 2023.”

    The Phoenix metro area ranks as the top U.S. job market in 2020 among bigger cities and Arizona has the third-best job market among states trailing only Utah and Idaho. (Elliott Pollack)

    Real Estate News.

    • On 12/21/2020 Opendoor will be publicly traded on the NASDAQ with the symbol “OPEN.”
    • Mr. Cooper, formerly Nationstar, settled with the Consumer Financial Protection Bureau (CFPB) and will refund $90 million to customers and will pay $6.5 million in damages for foreclosing on borrowers after loan modifications were completed. (HousingWire)
    • Knock Nest is now available in Phoenix. It is a leaseback program that allows homeowners to sell their property Knock and then rent it back from them. Leases have 12 month terms after which the seller turned renter has the option to renew the lease, buy the property back, or move out.
    • Last week Airbnb had the largest IPO in 2020 with an opening trade valued at $101.6 billion; as of opening day, Airbnb is worth more than the three largest hotel chains combined, which are Hilton, Marriot, and Intercontinental. (Business Insiders)
    • Forbes is launching an exclusive, international luxury listing marketplace. The platform is invite only and the minimum listing price allowed is $2 million.
    • CoStar is unlikely to unseat Zillow’s clear position as the most visited portal. However it continues to make moves to create more competition between the two companies. With the acquisition of Homesnap, CoStar is creating new competitors for subsidiaries of Zillow’s who currently have no competitors, such as StreetEasy in NYC. (Inman)

    The AZ Market.

    Cromford Market Index (CMI): The CMI is the best leading indicator available (balance is 100, above 100 is a seller’s market and below 100 is a buyer’s market. Prices rise at 110 and drop at 90). Yesterday it was 400.1, an all-time record high. A week ago it was 387.7, a lot of movement in a week! On May 15 it hit bottom at 145.2.

    Supply: The reason for the CMI’s height is low inventory. After stabilizing for a few months this summer and fall, available listing inventory is dropping again. We are down to 6,645 active listings excluding UCB. That is down 18% since last month and 50% year over year. It is also 66.4% below normal.

    Demand: Our demand is 34.4% above normal, coupled with incredibly low inventory buyers are struggling to get offers accepted. Despite seasonal demand decreases, we still have 4.2 buyers for every available listing.

    • The Taiwan Semiconductor Manufacturing Company just paid $89 million for 1,128 acres in north Phoenix. The factory expects to bring 1,600-1,900 new jobs. (Rose Law Group)
    • According to Realtor.com, Phoenix is #6 of the top 10 strongest housing markets expected in 2021, rankings based on job market strength, affordability (despite rising prices, we are the cheapest big city in the country), and proximity to other major metros.
    • NAR and 20 economists forecasted the top 10 strongest metros for economic strength based on domestic migration, low unemployment, mobility, and more…and Phoenix came in at #1!!

    National Real Estate.

    • As of Monday, there were only 469,000 single-family residences for sale nationwide. There is a total of 84 million single-family residences which means only 0.6% is on the market. (Altos)
    • With 1.4 million NAR members and only 469,000 listings there are 3 Realtors for every available single family listing in the country.
    • Inventory usually drops from Thanksgiving through the second week of January, at which point could see 50,000-60,000 new listings hitting the market each week thereafter. (Altos)

    Appreciation.

    • The average national, annual appreciation since 1991 is 3.8%. This is where the 3-4% average came from. (KCM)
    • The average national, annual appreciation since 2012 is 6.1%. (KCM)
    • Greater Phoenix has seen a nearly 17% appreciation year over year, which has created some concerns about the 2005 bubble, however today’s market is dramatically different.
    • Earlier in the year, the average American homeowner with a mortgage had $177,000 in equity. Today it is $194,000, few had that kind of equity in 2005.

    “Such a frenzy of activity, reminiscent of 2006, raises questions about a bubble and the potential for a painful crash. The answer: THERE IS NO COMPARISON. Back in 2006, dubious adjustable-rate mortgages taxed many buyers’ budgets. Some loans didn’t even require income documentation. Today, buyers are taking out 30-year fixed-rate mortgages. Fourteen years ago, there were 3.8 million homes listed for sale, and home builders were putting up about 2 million new units. Now, inventory is only about 1.5 million homes, and home builders are under producing relative to historical averages.”

    Dr. Lawrence Yun, Chief economist for Nar

    Forbearance.

    After 25 weeks of decreases, we had 2 weeks of increases, followed by a week of staying flat, and now last week, we had a decline in total mortgage loans in forbearance. It dropped from 5.54% to 5.48% or roughly 2.7 million borrowers. This is good news, since 3 weeks makes a trend.

    While people are leaving their forbearance plans, more are leaving through a loan modification which indicates that not everyone has been able to get caught back up, even if they are working.

    Forbearance numbers by stage:

    • Just under 19% are in the initial stage.
    • Just under 79% are on extension.
    • About 2.5% are re-entries.

    Of the total forbearance exits from June 1 through December 6, 2020:

    • 30% continued to make their payments throughout the term.
    • 16% were caught up upon plan exit.
    • 13% did not make all of their payments and exited forbearance without a loss mitigation plan in place.

    For more details on this, click here to see my latest forbearance video.

    Delinquencies.

    While yes, there will be homeowners impacted by foreclosure, it will not be a giant number like we saw in 2009-2012. We are not in a bubble, the today’s price appreciation is due to a supply and demand imbalance, not false demand as was the case in 2005.

    • Keep in mind all loans in forbearance that are late are marked as delinquent despite not being penalized for being late. (Black Knight)
    • Delinquencies improved in October, decreasing by 3.3% to 6.44%, their lowest level since March. At 1.8 million, seriously delinquent loans, which are 90+ days late is dropping but is still 5x what it was in February. (Black Knight)
    • Arizona’s delinquency rate is 5.4%, (national is 6.4%) there are 13 states with lower delinquency rates than AZ so we are almost in the top-performing quarter of the states. (Black Knight)
    • Delinquency rates are the lowest for condos at 4.7%, then 6.8% for single-family houses, and over 9% for 2-4 unit multifamily properties. (Black Knight)

    “The COVID-19 pandemic has primarily hit renters, but it has impacted a lot of homeowners, too. As the housing market muscles its way through the current economic downturn, I see foreclosures forming more of a trickle rather than a flood.”

    Matthew Gardner, Chief Economist for Windermere

    Lending.

    • Yesterday, for the 15th time this year we hit another all-time low for mortgage interest rates. (Freddie Mac)
    • 2020 is on pace to hit nearly $4.4 trillion in first-lien mortgage originations, the largest volume of any year on record.
    • Q3 2020 set records across the board, with the largest single quarter of purchases ($455 billion), refinances ($867 billion) and total lending ($1.3 trillion) ever recorded. (Blackknight)
    • Through September, about 6.4 million homeowners refinanced their primary mortgage, with that number expected to reach over 9 million by the end of the year.
    • Of the roughly 138 million US housing units, 42% have no mortgage, of the roughly 77 million that do have a mortgage about 50% have interest rates in the 4s% or higher. (KCM)
    • While the Fed does not control mortgage interest rates, it’s consistent purchasing of treasuries and mortgage backed securities has kept rates low. At the most recent meeting, the Fed announced that it would continue purchasing at the same rate until there is “substantial progress” towards an overall stronger economy. (MBA)

    Commercial Real Estate.

    Prior to COVID roughly 6% of employees worked from home. In April, 85% of employees worked from home. In mid-October 73% of employees worked from home and our numbers have stayed about the same since. Dallas has the lowest rate of working from home at 60% and San Francisco has the highest rate of 87%. (Elliot Eisenberg)

    93.6% of renters living in large, professionally managed apartment complexes paid their rent through the end of November. That number was 95.2% through November 2019; a decrease of 1.6%. Despite the decrease, it is better than initially expected. (Elliot Eisenberg)

    About 6% of new single family homes are built to rent and will not enter into the market at all. It is expected that nearly 700,000 will be built by 2030. (RCLCO real estate advisors) According to a 2018 National Bureau of Economic Research study, roughly 35% of rentals are single family properties and the demand is rising.

    Phoenix-based Christopher Todd Properties is currently developing 943 single-family built to rent homes in greater Phoenix. These communities have apartment-style amenities like gated entry, community pool and fitness area, and carports for parking.

    Courtesy of Christopher Todd Properties. Christopher Todd Communities at Stadium, a built-for-rent property of 300 houses in Glendale, AZ.

    Final Thoughts.

    Logan Mohtashami of HousingWire said it perfectly, “And remember, my friends, always be the detective, not the troll. Math, facts, and data matter, and the rest is storytelling.”

    Please share this with your colleagues and clients.

    Copyright 2020 by Sarah Perkins

  • AZ Forbearance Update (video) 12/16/2020

    In this 13 minute video, Lydia Wietsma and I discuss the most recent five things you need to know about forbearance. The majority of borrowers leaving forbearance are current upon plan exit. There is not much time left if someone needs to take advantage of these CARES Act benefits.

    We do these updates to help real estate professionals and consumers understand forbearance, to let struggling borrowers know that although experts are forecasting a tough winter, there are options.

    One.

    Lydia and I have been watching the numbers very closely. We had our first 2 weeks of increases, followed by a week of staying flat, and now last week, we had a decline in total mortgage loans in forbearance. It dropped from 5.54% to 5.48% or roughly 2.7 million borrowers.

    While people are leaving their forbearance plans, more are leaving through a loan modification versus which indicates that not everyone has been able to get caught back up, even if they are working.

    Another point to make here is that the initial forbearance requests increased to the highest level since August 2. Servicer requests (renewals or initial) increased to the highest point since April 19. Lydia, that means people are watching our videos and making those calls as we get closer and closer to the cut off at the end of the year. Either our informational videos or the fact that the unemployment numbers are worse than experts predicted, while still moving modestly in the right direction.

    To break the forbearance numbers down by stage, of the borrowers in forbearance, just under 19% are in the initial stage, just under 79% are on extension and about 2.5% are re-entries.

    Two.

    Of the cumulative forbearance exits for the period from June 1 through December 6, 2020:

    • 30% continued to make their payments throughout the term.
    • 16% were caught up upon plan exit
    • 13% did not make all of their payments and exited forbearance without a loss mitigation plan in place.

    Three.

    The Cares Act created a lot protections for homeowners and renters. However, upon the expiration of the eviction moratoriums struggling renters will be very exposed. The provisions for homeowners are considerably more extensive. Borrowers in forbearance have the benefit of time within a forbearance plan. And even if borrowers are late and then proceed towards foreclosure, that process takes about 6 months. How much time does a renter get? This is another benefit of homeownership.

    Also remember homeowners have gained a lot of equity this year and there are options available. There are about 6755 active listings in ARMLS, we should have 25,000, prices will continue to rise.

    Four.

    Including today and Christmas Eve there are only 11 business days left for borrowers to call their servicer and get started on a forbearance plan. It may be extended but currently the program expires on 12/31/2020.

    Servicers are getting more active. Lydia’s requests are increasing, yesterday she had 6 inspection requests. They are getting ready to move forward on loans that are delinquent as soon as the moratoriums are lifted. The foreclosure moratorium expires 1/31/2021.

    Five.

    When exiting forbearance borrowers have a number of options; not all of them require the owner to sell their property. Some of these options include:

    • Utilizing a 401K in two ways.
      • Individuals are allowed to borrow from their 401K with the option of paying themselves back with interest, since it is a loan being paid back, essentially paying yourself back there are no penalties. Talk to your 401K administrator for details.
      • Through provisions of the CARES act, an individual can also withdraw an amount of their 401K with no penalties. Again, talk to your 401K administrator for details.
    • Permanent loan modification or refinance, after making 3 payments in a row, to something that allows borrowers to stay. Some scenarios include adding the forborne amount at the end of the loan, some pay a lump sum to get caught up, some offer payment plans to get caught back up.
    • Rentals are in high demand with quickly appreciating values. What about moving out of the property and renting it out to make up the difference in payments.
    • Sell and buy something more affordable, after 3 payments in a row have been made. Pay off the loan and get a new loan with more agreeable terms.
    • Sell, pay off the loan and forborne the amount, and rent/move in with family.
  • Greater Phoenix Real Estate Update 12/11/2020

    Today is all about the AZ market. Yesterday, Lawyers Title hosted a presentation with Tina Tamboer with the Cromford Report. She always has incredible information to share. Below I have combined most of her information from her presentation, along with some additional information from my research.

    Employment.

    The national unemployment rate through November is 6.7%. The Arizona unemployment rate through November is 8%. After running lower than the rest of the country through October, we had some slight gains in unemployment. Tina called it a stutter step.

    There was a short recovery for some and then a long, slow recovery for the large group remaining unemployed. Early on it was about the age of the unemployed, that has changed and now there is one significant indicator in regards to unemployment. It is education level. The largest group of unemployed Americans, at 64%, have only a high school education. The unemployment rate for those with at least 4 years of college is 11%. It is only 2% for those with a graduate degree. This could be a large factor for housing and why it has not been impacted by the high unemployment rates.

    Forbearance.

    Most forbearance plans are 3, 6, or 9 months long. Unless the borrower requests an extension; once the plan has run its course the borrower is removed from the plan. This is why we often see the biggest drops at the end of the month. (Tina Tamboer)

    After two weeks in a row of slight forbearance count increases, the first increases in 25 weeks, I closely watched the numbers released this week, three weeks make an early trend. And they remained flat, unchanged from the previous week, 5.54% of loans and roughly 2.8 million loans in a forbearance plan. (MBA)

    Initial stage forbearance plans decreased. Like the 2 weeks prior, this past week had increases in forbearance plan extensions and re-entries. Nearly 78% of all loans in forbearance are on extension. (MBA)

    Click here to watch my 12 minute forbearance update video from Wednesday.

    Luxury Real Estate.

    Between corporate profits and a bullish stock market, the luxury real estate market is moving faster than ever.

    Increasing corporate profits is a significant indicator for luxury real estate. Q3 2020 had huge corporate profits with an increase of 27.5% over Q2 2020. Nationwide luxury real estate is booming and Arizona is no exception. In October, the largest residential sale in the state closed at just over $24 million in Silverleaf in Scottsdale.

    The stock market is on the rise. Wall Street does not like uncertainty. It improves after elections, regardless of who is elected because it likes to know who is in the White House and Congress. Political uncertainty is poison for the stock market. And we have not seen a recovery like this since 2009!

    Cromford Market Index.

    Available on the main page of the Cromford Report: http://cromfordreport.com/ (without a subscription)

    Cromford Market Index Continued.

    • 100 is balanced and prices rise at the rate of inflation, below 100 is a buyer’s market, above 100 is a seller’s market, prices drop below 90, prices rise at 110.
    • On 2/5/2020 we were at 215.1
    • On 3/20/2020 we were at 241
    • On 5/15/2020 we were at 145.2
    • Yesterday we were at 387.7, a new record and nearly double the May low.
    • Prior to this run, the previous peak was 312.9 in the spring of 2005.
    • CMI is the predictor, it moves first and then appreciation follows.

    What is driving the CMI this time? We have had different drivers over throughout the past 9 months. At the beginning we had a flat supply line with rising demand. Then supply was remained stable while demand increased. Since Thanksgiving, supply started dropping and demand has been relatively stable, only declining very slightly. Demand remains 35% above normal while supply remains 65% below normal. Tina thinks that there might be a slight decrease in demand due to affordability challenges.

    The CMI has been moving at Ludacris speed. In the first 10 days of December we have gone from 375.6 to yesterday’s 387.7. When the market turns, which it has not done yet, how long is the journey back to balance and what does that look like?

    In 2005 it took 8 months from the turn to reach balance. In 2009 it took 4 months. In 2013 it took 6 months. Based on where we are now, even at a very fast clip, it will take at least 10-12 months to reach balance. Because it is still going up today, it will be even longer. As long as you are in a seller’s market prices rise. Prices may rise more slowly, but they still rise. We are nowhere near a crash, we are very far above normal.

    Affordability.

    Wages did not increase from Q2 2020 to Q3 2020 but affordability dropped. Here is a chart from HousingWire illustrating price increases and wage increases. Wages are not keeping up with appreciation, putting pressure on buyers.

    Greater Phoenix is on the edge of no longer being affordable. At the end of Q3 2020 our affordability rate was 61.9, down 3 points from Q2 2020 while wages remained flat. Below 60 is considered unaffordable. We dropped below the affordable range in 2018 and demand dropped. Demand drops when affordability is challenged. Tina believes that we will drop below 60 by the end of Q4 2020. Even if demand would start to come down now, because we are above normal, prices will still rise. The movement takes a long time. It hasn’t started yet, the day isn’t today but at some point there will be a shift.

    When shifts start prices increase more slowly. That is the prediction for 2021 that prices will go up more slowly.

    Appreciation.

    Year over year appreciation through December is nearly 17%. Nearly all of that appreciation has come since May. With the speed of this increase it is no surprise people fear a bubble. This time is very different from 2005. For a more detailed explanation of the market differences, check out my market comparison here.

    Prices are not going to go down. Don’t wait. We haven’t seen a price decline in 9 years.

    Single family rental demand is through the roof. For today’s median home the full mortgage payment is $1,563. For the same house a renter is paying $1,850 and those prices go up each year, in Q4 2019 the rent was $1,595!

    2001 to 2005 rents dropped by 18%, not real housing demand. NYC and San Francisco have dropping rents and increasing rental vacancies. Tina doesn’t recommend buying in an area with dropping rentals rates.

    Supply.

    Available inventory is down 44.6% from 2019. Yikes! For most of the past several months our inventory levels stayed stable, just at very low levels. We were bringing them on the market very quickly but they were selling just as quickly. Since Thanksgiving supply has not been able to keep up with demand and inventory levels are dropping.

    The big question coming into the New Year is how many new listings will we get in January-March? If we do not get enough new listings in January-March we will have a struggle with supply for most of the year. The first half of the year sells more than then second half (in normal markets)

    Year to date through December 6, we have had a 1.9% increase in new listings year over year. The week after Thanksgiving brought fewer new listings than expected. Even with 28% more new listings, it is not enough to keep up with the 35% above normal demand.

    Builders.

    Last week, DR Horton bought 270 square miles of raw land called Superstition Vistas for $245.5 million. It is bigger than Mesa, Gilbert, Chandler, and Queen Creek combined!

    Builders are building in many areas throughout the valley around job expansion. Tons in Florence and Casa Grande. The Town of Maricopa is getting a hospital. Be sure to check out the Land Use Explorer http://geo.azmag.gov/maps/landuse/ on the Maricopa County Association of Governments website, https://www.azmag.gov/Programs/Maps-and-Data. The Land Use Explorer shows expansion, what is approved, proposed and pending. The yellow below shows single family developments.

    • Lots of jobs and future development coming to the area.
    • We have exceeded 2019 total permits through October by 3.5% and by 23% in single-family permits.
    • Multi-family is up 30% but mostly for apartment complexes to rent.
    • The cause of the housing shortage: 2000-2019 we had a population growth of 18% and an increase in total housing units of 9%.

    Demand.

    • A lot of our demand is coming from renters because rent has gone up so much. Lots of millennials buyers. (national, 32% of buyers are first time home buyers)
    • Typically we have around 9,100 listings in escrow at this time of year. Today we have 28% more pendings than normal.
    • December typically sees a decline in supply, lots of cancellations and expirations and, of course, lots of closings.
    • Under contract, regardless of when they went into escrow are up 27.9% year over year.
    • Every year we have a drop in listings under contract in the 2nd half of the year. This year we stayed stable, which never ever happens. Busiest December ever.
    • We had a slight slowdown in new contracts after Thanksgiving, better than last year but still weak.
    • Escrow fallouts are down, year over year.
    • 122% gain in sales from 600-800K, year over year.

    This is the best Q4 ever. More sales than ever before. We are up 25% year over year for the quarter. The week after Thanksgiving, listings over $1 million had an accepted contract rate 102% above this time last year. Year to date sales are up 2.5%, this is not higher because of the March slow down.

    Every year CA is the #1 state feeding buyers to AZ. #1 county is LA County, followed by San Diego County and Orange County.

    Who is buying what?

    • 77.3% of buyers are owner occupied, 12.2% are investor purchases, and 2% are iBuyer purchases.
    • Where did the ibuyers go? They are going into lending and they are going traditional and selling regularly on the market.
    • iBuyer purchases are down 56%.
    • FSBOs are being purchased by ibuyers and investors, a great way to approach FSBOs offering help

    Contract Ratio.

    • 50% of all contracts accepted were on the market for 13 days or less.
    • 35% closed over asking in November. Median over asking is $5,100.
    • For every 100 listings on the market there are 174 in escrow.

    Final Thoughts.

    2021 talking point: forbearance expiration, foreclosure moratorium expiration, and affordability. New listings are up 6% so far in Q4 2020. November new listings were up 2% year over year. November sales were up 26% year over year. Under contract up 28% year over year. Luxury is a huge part of the increase. 2020 has been a rollercoaster. Any stability in 2021 will be welcome.

    To sign up for a Cromford Report subscription visit http://cromfordreport.com/join-armls.html 

    Please share this with your colleagues and clients.

    Copyright 2020 by Sarah Perkins

  • AZ Forbearance Update (video) 12/9/2020

    In this 12 minute video, Lydia Wietsma and I talk about the five things you need to know about forbearance. Time is short but there are options. Forbearance programs are available through the end of the year. Watch the full video for details.

    We do these updates to help real estate professionals and consumers understand forbearance, to let struggling borrowers know that although experts are forecasting a tough winter, there are options.

    One.

    We have talked about 3 weeks creates a trend. Well, after two weeks in a row of slight forbearance count increases, we were closely watching the numbers. And this past week, they remained flat, unchanged at 5.54% of loans and roughly 2.8 million loans in a forbearance plan.

    Initial stage forbearance plans decreased. Like the 2 weeks prior, this past week had increases in forbearance plan extensions and re-entries. Nearly 78% of all loans in forbearance are on extension.

    The surging cases nationwide led experts to believe we would see forbearance numbers rising more than they have.

    Two.

    Of the cumulative forbearance exits for the period from June 1 through November 29, 2020:

    • About 46% represented borrowers who continued to make their monthly payments during their forbearance period or made up the past-due amount when exiting their plan.
    • 13% represented borrowers who did not make all of their monthly payments and exited forbearance without a loss mitigation plan in place yet.
    • December marks the next large volume of expirations, with more than 1 million (39%) active plans currently set to expire.
    • Based on the current distribution, approximately 175,000 forbearance plans will reach their 12-month expiration in January/February, with more than half a million reaching that expiration mark in March 2021

    Of the nearly 6.5 million homeowners that have entered forbearance plans since the beginning of the pandemic, only 43% (2.77 million) remain in active forbearance as of mid-November.

    Three.

    Delinquencies: Keep in mind all loans in forbearance that are late are marked as delinquent they are not being penalized for being late.

    Delinquencies improved in October, decreasing by 3.3% to 6.44%, their lowest level since March. At 1.8 million, seriously delinquent loans, which are 90+ days late is dropping but is still 5x what it was in February.

    Arizona’s delinquency rate is 5.4%, (National is 6.4%) there are 13 states with lower delinquency rates than AZ so we are almost in the top-performing quarter of the states.

    Four.

    Time is of the essence 14.5 business days (Christmas Eve is only half) Move quickly, get into forbearance if necessary. Do not panic sell, there are options.

    Five.

    Servicing timelines increased. Usually provide 24 hours and now 48 hours. Are things changing? We are watching.

  • This Week in Phoenix Real Estate (video)

    In this 12 minute video Amber Kovarik and I talk about what is happening this week in real estate.

    Today’s Takeaways.

    Right now there are a lot of headlines about how the housing market is softening, that we are turning into a buyers market. That is not the case. What is the case is that there was a slight decrease in contract signings from September to October, a 1.1% decrease. That doesn’t mention that there was still a 20% year over year increase. Seasonality could be coming into play now, in that it does get a little quieter around the holidays. What the bigger factor is lack of inventory. A buyer cannot write an offer on a property that is not for sale.

    To put it in perspective, in the US there are about 140 million housing units. Of those, about 84 million are single family homes. (Greater Phoenix has about 2 million housing units and just over 1.4 million single family homes) Last week, for the first time in history, the number of single family homes for sale nationwide dropped to just below 500,000.

    Greater Phoenix has about 4 buyers for every available listing. In order for the Phoenix market to be balanced we would need 25,000-35,000 active listings, we have 7,300. Aside from New York and San Francisco all other major metros are in similar situations. There are some areas in the country that have sufficient inventory for the demand giving us a national average of about 3 buyers for every listing nationwide.

    Interesting Facts.

    • Demand for primary homes is up 50% and for second homes is up 100%, year over year (Redfin)
    • 19% of buyers paid cash in 2019 and 2020. (HousingWire)
    • For the fourth time, FHFA extended the foreclosure and eviction moratoriums to January 31, 2021. (HousingWire)
    • Mortgage interest rates have hit all-time lows 14 times this year. (MBA)

    Every time we get news that is not favorable for the economy interest rates have gone down. There is so much uncertainty that the fed has just keeps buying more and more mortgage-backed securities. It likely will not go much lower.

    Appraisal delays continue. 45 day escrow periods can help make things go more smoothly. Bring on the harmony to a real estate transaction!

    With the new conforming loan limits a buyer can now purchase a property for $577,000 with 5% down without having to get a jumbo loan.

    With the new FHA limits a buyer can now buy a property for $381,000 with 3.5% down.