
Today is all about the AZ market. Recently, Lawyers Title hosted a presentation with Tina Tamboer with the Cromford Report. She always shares pertinent and timely information. Below I have combined a lot of her information from her presentation, along with additional information from my research.
What affects supply?
- New Homes
- FSBOs
- Appreciation/Depreciation (equity)
- Foreclosures/Household Formation (shrinking)
- Relocation (Outbound)
- Divorce/Illness/Death/Job Losses/Tragedy
- Consumer Sentiment
What affects demand?
- Interest Rates
- Appreciation/Depreciation (affordability)
- Relocation (inbound)
- Employment/Income
- Loose/Tight Lending Practices
- Population Growth
- Household Formation (growing)
- Consumer Sentiment – this could be the most important of them all.
What affects luxury demand?
- Stock Market Performance
- Corporate Profits
- Exchange Rates
- Consumer Sentiment
Employment:
- Initial and continuing unemployment remains elevated but has dropped more quickly than experts initially predicted.
- We still need to drop again by 50% in order to get to where we were a year ago.
- The pandemic has negatively affected low-income earners and renters far more than it has homeowners, which is why despite the high levels of unemployment real estate continues to be the strongest sector in the economy.
- Mid-level managers had the highest initial claims, according to the most recent update.

Forbearance:
There are people who think it will be raining homes when the forbearance period ends. This is not going to happen.
Every 3 months we see an improvement, as more borrowers exit their forbearance plans. But the past few months have been flat. Hovering around 2.6 million borrowers in a plan.

Foreclosures:
What happens with the moratoriums are lifted? We will see a wave of foreclosure filings but not of short sales. After 18 months of no foreclosures, there will be a backlog. According to KCM, on average nationwide there are about 69,000 foreclosure a month, during normal times.
When the foreclosures are filed, homeowners will likely sell as they have equity, which is why we will not see short sales. The vast majority of borrowers do not have loans greater than the value of their house. Tina expects that we will not see a lot of properties actually being foreclosed upon because the owners can easily sell.
This will not be a big issue nor will it last very long. It is more about pent-up demand than it is about a wave of foreclosures. These homes will be absorbed quickly and will not have a negative impact on prices.

Stock Market Performance:
This impacts the luxury market which has been crazy busy because the stock market is doing so well.
There was a pause in March, a dip at the election, and then a slight drop for Gamestop and now we have a nice smooth curve. Things are looking good and driving nice corporate profits.
iBuyers are also impacted by the stock market.

Population:
AZ is in the top 3 states for population increase along with Texas and Florid. This shows population changes from July 2019 to July 2020.

CA lost 70,000 residents. This is the first time it has had declines 150 years.
LA has been the #1 spot for AZ’s inbound migration for 20 years. This chart shows where people are searching from only.

Several moving companies share the data of the moves they service. They are all slightly different but show consistent trends. Arizona is usually in the top 5 for inbound relocations nationwide.
This shows the most people coming here are still coming here to retire. The 55+ group got larger.
63% of the inbound migration have an annual income of $100,000 or more.
We are on the low side of international inbound. It is nearly all domestic migration.

Household Formation:
Household formation creates demand. In 2020 household formation spiked across the country. The work from home movement drove this train. Now you don’t need to live where you work so people left and got their own space. When you can live anywhere the world opens up.

Affordability:
The ideal range for housing affordability is 60-75. Through Q4 2020 in Phoenix someone earning the median income, they can afford 60.6% of what is for sale. In LA it is 9.1% and San Francisco it is 11%.

Taxes:
Why are all of the rich people coming here? It only took the threat of CA increasing the income tax from 13% to 16% to create a mass exodus. It created a wealth flight. High tax states are seeing outbound migration to lower tax states.
Outbound states: CA, IL, NY, NJ
Inbound: AZ, TX, FL, ID
Business taxes, corporate taxes, individual income taxes, sales taxes, and property taxes are
are the highest in those outbound states. AZ, while not the lowest in all of those, competes for being quite low in most of those. Sales tax tends to be the highest because it is the easiest to raise.

Where are all of the rich people going?
Maricopa county association of governments, shows demographics, click here for the demographics map. Density is increasing in new luxury areas. South Chandler, a lot of Gilbert, east Mesa, and South Mountain are getting bluer. Showing new emerging luxury markets.

Job Centers:
Jobs are created by freeways. The heavier the employment area the bluer. A lot of job growth, biomedical, and tech fueling demand, bringing in people who make a lot of money. Click here for the interactive map.
The Cromford Market Index:
Available on the main page of the Cromford Report: http://cromfordreport.com/ (without a subscription)

- 100 is balanced and prices rise at the rate of inflation, below 100 is a buyer’s market, above 100 is a seller’s market, prices drop below 90, prices rise at 110.
- On 2/5/2020 we were at 215.1
- On 3/20/2020 we were at 241
- On 5/15/2020 we were at 145.2
- Yesterday we were at 513.6.
- Prior to this run, the previous peak was 312.9 in the spring of 2005.
- CMI is the predictor, it moves first and then appreciation follows. Cannot predict the CMI.
At balance, or 100, values rise at the rate of inflation. We are not at balance. Demand is 18% above normal. Supply is 77% below normal.
Demand is now dropping faster than supply. The CMI slows as demand decreases. When the index goes flat prices do not drop. Supply remains shockingly low.
In order for prices to stop rising, the CMI has to be at 100. If it starts on the way down, prices rise more slowly. When will it go down? We can’t know that until it stops rising. In order for prices to start dropping we will have at least 8 to 10 months and that is only after the CMI stops increasing.
What will slow it down? Affordability.
Tina thinks we have dropped below 60, the level of demand doesn’t start dropping until we are below 60. How long will it take to get to lower demand? It could take months, who knows. Demand, once it goes to the low side of normal and then we will see supply go up.
Property values will not go down. As long as demand is above supply, prices rise. When demand and supply come together, below balance, transaction volume declines.

Appreciation:
Prices have increased 22.5% year over year, is it really a good time to buy? It is always a good time to buy in a seller’s market and it is good for sellers to sell in a seller’s market. Buying and selling in a seller’s market is winning.
Interest rates have impacted affordability. Payments have gone up $72 for an increase buying power of $77,000.
Rents:
Rents are more expensive than mortgages. Rents are rising quickly. The median house rents for $250 more a month than the going rate for a mortgage for the same house.
Rents are rising = not a bubble, rents decline due to false demand. Rents are declining in San Francisco while houses are still rising, equating to false demand. San Francisco could be considered over-valued.
Supply:
Supply is down 54% year over year. The end of forbearance plans (summer 2022) will have little impact in adding supply. All price points are down.
This year is lower than last year and last year was a record. We do not have enough coming in to maintain supply.

Population Growth and New Builds:
We overbuilt for 10 years before we started underbuilding for another 10 years and population growth outpaced building. In 2019 we ate up the last of the glut of housing.

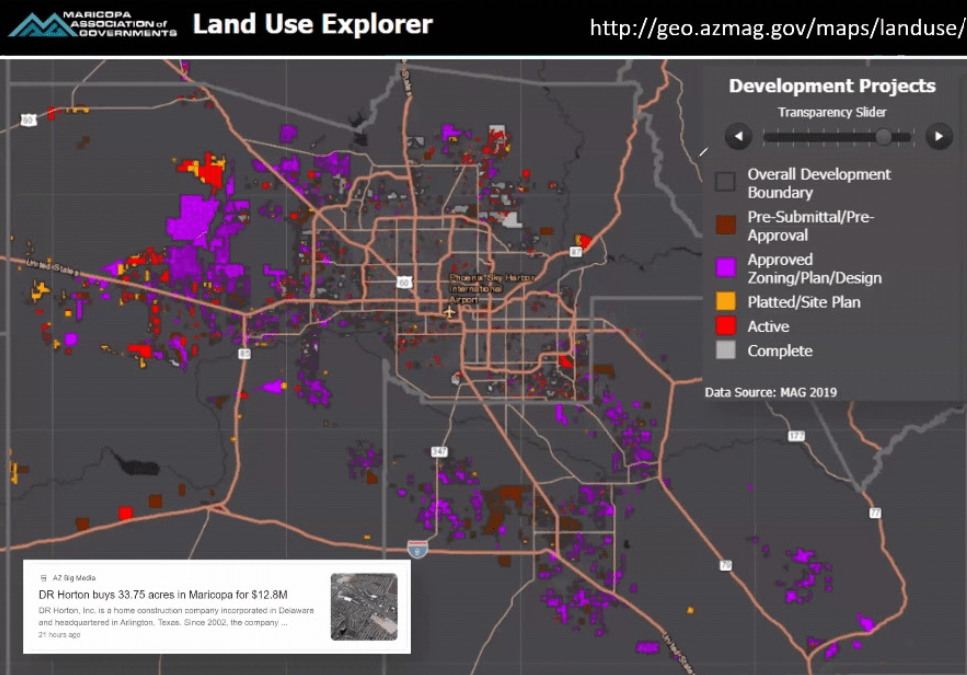
Developments:
Without new listings we have to look at new construction which is a challenge due to labor shortages and lumber prices are up 170%, adding, on average an additional $16,000 in cost to the average new build.
Most developments are going into the south and west, due to cheaper available land. Very little in the north. Values are increasing the most in the north. Click here for the interactive map.
Single Family Permits are Up!
- Avondale at 428% year over year.
- Coolidge at 182% year over year.
- Glendale at 123% year over year.
- Casa Grande at 84% year over year.
Multi Family Permits are Up too!
- Overall increase of 28% year over year.
- Mostly they are not for sale, build to rent movement is huge.
- Gilbert is up 434% year over year.
- Mesa is up 236% year over year.
- Chandler is up 142% year over year.
Demand:
- 50% of all accepted contracts were on the market for only 6 days.
- Contract activity is booming.
- Busiest February ever.
- As of 2/26 there were 12,072 properties in escrow. Normal is 10,000.
- In February, the contract ratio was 239, meaning for every 100 active listings there are 239 in escrow.
- In 6 weeks, many areas moved from $200,000 to $300,000 for average sales prices
Final Thoughts:
- Supply is down 59% from last year.
- New listings, year to date, are down 11% from last year.
- Demand is 18% above normal.
- Sales prices are not going to decline this year.
- There will likely be fewer sales in 2021 than in 2020 due to the low inventory levels.


Sarah Perkins is an award winning account executive and has been in title sales since 2004. As the Director of Industry Research & Senior Account Executive, Sarah’s role is to bring real estate transactions to Navi Title. Sarah supports her clients by helping them navigate the ever-changing real estate space through thorough research and understanding of current trends impacting today’s home buyers and sellers.